Documentation Revision Date: 2016-03-29
Data Set Version: 1
Summary
This data set consists of six files in GeoTIFF (*.tif) format and one comma-separated text file (*.csv).
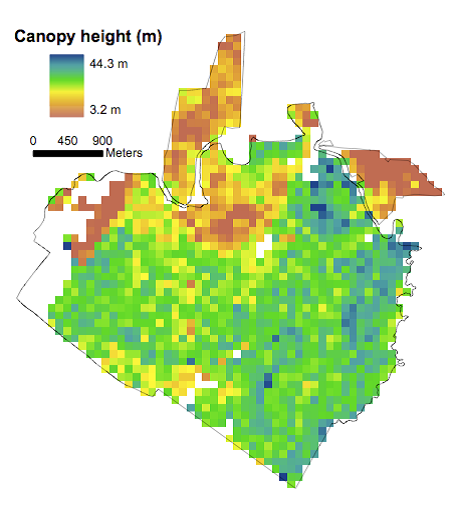
Figure 1. Lidar-derived mean vegetation canopy height in 1998 at 100-m (1-ha) resolution at La Selva Biological Station in Costa Rica (from ls98_ht.tif).
Citation
Hurtt, G.C., R.Q. Thomas, J. Fisk, R.O. Dubayah, and S.L. Sheldon. 2016. Canopy Height and Biomass from LiDAR Surveys at La Selva, Costa Rica, 1998 and 2005. ORNL DAAC, Oak Ridge, Tennessee, USA. http://dx.doi.org/10.3334/ORNLDAAC/1312
Table of Contents
- Data Set Overview
- Data Characteristics
- Application and Derivation
- Quality Assessment
- Data Acquisition, Materials, and Methods
- Data Access
- References
Data Set Overview
This data set contains land-use, canopy height, and aboveground carbon estimates derived from LiDAR data collected at La Selva Biological Station in Costa Rica in March 1998 and March 2005. The data are provided as GeoTIFFs (*.tif) of 100-m (1 ha) resolution. A look-up table (*.csv) is provided that relates modeled changes in height to changes in stand characteristics (including age and carbon content). The data were used to test the accuracy and scale-dependency of high-resolution predictions of vegetation dynamics and carbon flux by the Ecosystem Demography (ED). The ED model is an individual-based terrestrial ecosystem model that predicts both ecosystem structure and corresponding ecosystem fluxes from climate, soil, and land-use inputs.
Related Data Sets:
Hurtt, G.C., P.R. Moorcroft, and S.W. Pacala. 2013. Ecosystem Demography Model: Scaling Vegetation Dynamics Across South America. Model product. Available on-line [http://daac.ornl.gov] from Oak Ridge National Laboratory Distributed Active Archive Center, Oak Ridge, Tennessee, U.S.A. http://dx.doi.org/10.3334/ORNLDAAC/1149
Data Characteristics
Spatial Coverage: This data set covers the land area of the La Selva Biological Station in Costa Rica.
Spatial Resolution: 100 meter (1 ha)
Temporal Coverage: The data represents vegetation as measured in March 1998 and March 2005.
Temporal Resolution: Discrete measurements
Study Area:
|
Study Area |
Westernmost Longitude |
Easternmost Longitude |
Northernmost Latitude |
Southernmost Latitude |
| La Selva Biological Station, Costa Rica |
-84.04716574 |
-83.99555481 |
10.45261017 |
10.39889419 |
Data File Information:
This data set consists of six files in GeoTIFF (*.tif) format and one comma-separated text file (*.csv). All GeoTIFF files are in the Universal Transverse Mercator Zone 16N projected coordinate system referenced to the World Geodetic System 1984 datum (i.e. WGS 84 UTM Zone 16N).
Table 1: Data files
|
File Name |
Description |
|
ls98_cnt.tif |
Count of lidar footprints within each grid cell from survey in March 1998 |
|
ls05_cnt.tif |
Count of lidar footprints within each grid cell from survey in March 2005 |
|
ls98_ht.tif |
Mean canopy height for each grid cell in meters derived from March 1998 lidar survey |
|
ls05_ht.tif |
Mean canopy height for each grid cell in meters derived from March 2005 lidar survey |
|
ls_ed_delta_ht.tif |
Predicted canopy height change (in meters) between 1998 and 2005 from the ED model |
|
ED_predictions_by_height_class.csv |
Table relating ED-predicted height in 1998 to changes in height and biomass between 1998 and 2005. All parameters are class-specific. |
|
ls_lu.tif |
Gridded land use at the La Selva Biological Station in year 2000 produced by the Organization for Tropical Studies (reprocessed from Corella, 2001). Land use classes were based on IKONOS imagery. Land use classification values are described in Table 3. |
Table 2: Data fields in file ED_predictions_by_height_class.csv
|
Column header |
Units |
Description |
|
htclass |
none |
height class index |
|
height98 |
meters |
forest height in 1998 |
|
height05 |
meters |
forest height in 2005 |
|
height_change |
meters |
predicted change in height between 1998 and 2005 |
|
age98 |
years |
age of forest stand in 1998 |
|
total_carbon_98 |
kg C/m2 |
total carbon in 1998 |
|
total_carbon_05 |
kg C/m2 |
total carbon in 2005 |
|
aboveground_C_98 |
kg C/m2 |
aboveground carbon in 1998 |
|
aboveground_C_05 |
kg C/m2 |
aboveground carbon in 2005 |
|
delta_carbon_7yr
|
kg C/m2 7-yr |
change in aboveground carbon between 1998 and 2005 |
Table 3: Land use classification values for ls_lu.tif. Only values representing old-growth forest (primary forest; 12) and secondary forest (8) were used in the canopy change analysis.
|
Value |
Class |
|
1 |
Open Pasture |
|
2 |
Forested Swamps |
|
3 |
Abandoned Plantation |
|
4 |
Current Plantations |
|
5 |
Developed Areas |
|
6 |
Ecological Preserve |
|
7 |
Shaded Pasture |
|
8 |
Secondary Forests |
|
9 |
Arboretum |
|
10 |
Successional Plots |
|
11 |
Selectively-logged Forests |
|
12 |
Old-growth Forests |
|
13 |
Abandoned Agroforestry |
|
15 |
Open Swamps |
Spatial Data Properties for GeoTIFF files
Spatial Representation Type: Raster
Pixel Depth: 32 bit float & 8 bit integer
Pixel Type: integer
Compression Type: LZW
Number of Bands: 1
Raster Format: TIFF
No Data Value: -9999
Scale Factor: 1
Number Columns: 56
Column Resolution: 100 meters
Number Rows: 60
Row Resolution: 100 meters
Extent in the item's coordinate system
North: 1157021.125
South: 1151021.125
West: 823349.625
East: 828949.625
Spatial Reference Properties
PROJCS["WGS_1984_UTM_Zone_16N",
GEOGCS["WGS 84",
DATUM["WGS_1984",
SPHEROID["WGS 84",6378137,298.257223563,
AUTHORITY["EPSG","7030"]],
AUTHORITY["EPSG","6326"]],
PRIMEM["Greenwich",0],
UNIT["degree",0.0174532925199433],
AUTHORITY["EPSG","4326"]],
PROJECTION["Transverse_Mercator"],
PARAMETER["latitude_of_origin",0],
PARAMETER["central_meridian",-87],
PARAMETER["scale_factor",0.9996],
PARAMETER["false_easting",500000],
PARAMETER["false_northing",0],
UNIT["metre",1,
AUTHORITY["EPSG","9001"]],
AUTHORITY["EPSG","32616"]]
Origin = (823349.625000000000000,1157021.125000000000000)
Application and Derivation
Recent publications have demonstrated the potential of using LiDAR remote sensing and height-structured forest ecosystem modeling to constrain estimates of future carbon stocks and fluxes through accurate initialization of vegetation structure (Hurtt et al., 2004; Thomas et al., 2008; Hurtt et.al., 2010; Antonarakis et al., 2011, 2014). The contents of this data set served as the initialization and test data for assessing the accuracy and scale dependence of forest dynamics modeled by the ED model. More details can be found in Hurtt et al. (2016).
Quality Assessment
The lidar data that were used to produce the 1998 and 2005 canopy height models were not subjected to validation beyond that of the vendor. The canopy height models were the basis for comparison of measured to modeled changes in canopy height over the 7-year period between surveys. The results of that comparison are described in the following section.
Data Acquisition, Materials, and Methods
The Ecosystem Demography (ED) model (Hurtt et al., 1998, 2013; Moorcroft et al., 2001) is an individual-based terrestrial ecosystem model that predicts both ecosystem structure (e.g. above and below-ground biomass, vegetation height and basal area, and soil carbon stocks) and corresponding ecosystem fluxes (e.g. NPP, NEP, and evapotranspiration) from climate, soil, and land-use inputs. The model consists of integrated sub-models governing processes such as leaf-level physiology, plant allocation, allometry, phenology, dispersal, the effects of fire disturbances, and below-ground sub-models for soil carbon dynamics and hydrology. This data set was acquired to test the accuracy and scale-dependency of high-resolution predictions of vegetation dynamics and carbon flux by the ED model.
A Laser Vegetation Imaging Sensor (LVIS) was flown over La Selva Biological Station in March 1998 and again in March 2005. The LVIS is a medium altitude waveform digitizing LiDAR with 10-30 m diameter footprints (Blair et al., 1999). Gridded canopy height was derived at 30-cm vertical resolution for each collection and aggregated to 100-m (1-ha) spatial resolution. A look-up table (ED_predictions_by_height_class.csv) of forest structure development from recently disturbed to old growth conditions was modeled using a local climatology and used to relate ED-predicted height in 1998 to changes in height and biomass between 1998 and 2005.
Land cover data for the La Selva Biological Station, year 2000, (ls_lu.tif) were obtained from the Organisation for Tropical Studies at http://cro.ots.ac.cr/en/laselva/gis/laselva_gis/gis/lu00.htm. This land use map was created by the combined work of Osvaldo Corella, a LSBS student intern from the Instituto Tecnológico de Costa Rica and Matthew Clark, the LSBS GIS Laboratory Manager (Corella, 2001). Land cover information was digitized from IKONOS satellite imagery taken on August 16, 2000.
The ED model was initialized using the canopy height data from 1998 and used to predict changes in mean canopy height over the 7-year period between data collections (Figure 2). Hectares observed to be at or above modeled maximum canopy height were predicted to have no change in height.
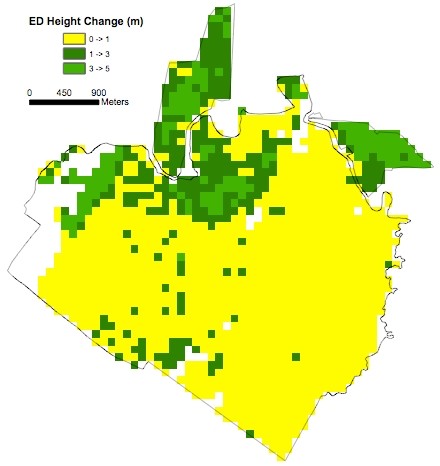
Figure 2. Ecosystem Demography predicted canopy height change between 1998 and 2005 at 100-m (1-ha) resolution.
Predicted change in canopy height between 1998 and 2005 was compared to change measured from lidar-derived canopy height. The comparison focused on hectares with ≥ 20 LVIS footprints in both 1998 and 2005 (ls98_cnt.tif, ls05_cnt.tif) and hectares classified as primary and secondary forest (from ls_lu.tif). Averaged over the domain, model predicted mean change in canopy height was 0.53 ± 0.04 m. This is within 0.5 m of changes in mean canopy height measured from the LiDAR data (0.85 ± 0.09 m). Model predicted changes in canopy height were lower for the subsets of primary and secondary forest and not statistically different from those measured from the LiDAR data. More details can be found in Hurtt et al. (2016).
Data Access
This data is available through the Oak Ridge National Laboratory (ORNL) Distributed Active Archive Center (DAAC).
Canopy Height and Biomass from LiDAR Surveys at La Selva, Costa Rica, 1998 and 2005
Contact for Data Center Access Information:
- E-mail: uso@daac.ornl.gov
- Telephone: +1 (865) 241-3952
References
Antokarakis, A.S., S.S. Saatchi, R.L. Chazdon, and P.R. Moorcroft. 2011. Using lidar and radar measurements to constrain predictions of forest ecosystem structure and function. Ecological Applications 21: 1120-1137.
Blair, J.B., D.L. Rabine, and M.A. Hofton. 1999. The laser vegetation imaging sensor (LVIS). ISPRS Journal of Photogrammetry and Remote Sensing 54: 115–122.
Corella, O. 2001. Elaboración de un mapa histórico del cambio de uso del suelo en la Estación Biológica La Selva, Puerto Viejo de Sarapiquí, Heredia. Thesis. Instituto Tecnológico de Costa Rica.
Hurtt, G.C., P.R. Moorcroft, S.W. Pacala, and S.A. Levin. 1998. Terrestrial models and global change: challenges for the future. Global Change Biology 4: 581-590.
Hurtt, G.C., R. Dubayah, J. Drake, P.R. Moorcroft, S.W. Pacala, and M. Fearon. 2004. Beyond potential vegetation: combining lidar remote sensing and a height-structured ecosystem model for improved estimates of carbon stocks and fluxes. Ecological Applications 14: 873-883.
Hurtt, G.C., J. Fisk, R.Q. Thomas, R.O. Dubayah, P.R. Moorcroft, and H.H. Shugart. 2010. Linking models and data on vegetation structure: quantifying model-data requirements for future space-borne missions. Journal of Geophysical Research 115: G00E10.
Hurtt, G.C., P.R. Moorcroft, and S.W. Pacala. 2013. Ecosystem Demography Model: Scaling Vegetation Dynamics Across South America. Model product. Available on-line [http://daac.ornl.gov] from Oak Ridge National Laboratory Distributed Active Archive Center, Oak Ridge, Tennessee, U.S.A. http://dx.doi.org/10.3334/ORNLDAAC/1149
Hurtt, G.C., R.Q. Thomas, J. Fisk, R. Dubayah, and S. Sheldon. 2016. The Impact of Fine-scale Disturbances on the Predictability of Vegetation Dynamics and Carbon Flux. PLoS ONE. In press.
Moorcroft, P.R, G.C. Hurtt, and S.W. Pacala. 2001. A method for scaling vegetation dynamics: the ecosystem demography model (ED). Ecological Monographs 71: 557-585.
Thomas, R.Q., G.C. Hurtt, R. Dubayah, and M. Schilz. 2008. Using LiDAR data and a height structured ecosystem model to estimate forest carbon stocks and fluxes over mountainous terrain. Canadian Journal of Remote Sensing 34: S351-S363.