Documentation Revision Date: 2024-09-06
Dataset Version: 1
Summary
This dataset includes 30 files in cloud optimized GeoTIFF (COG) format.
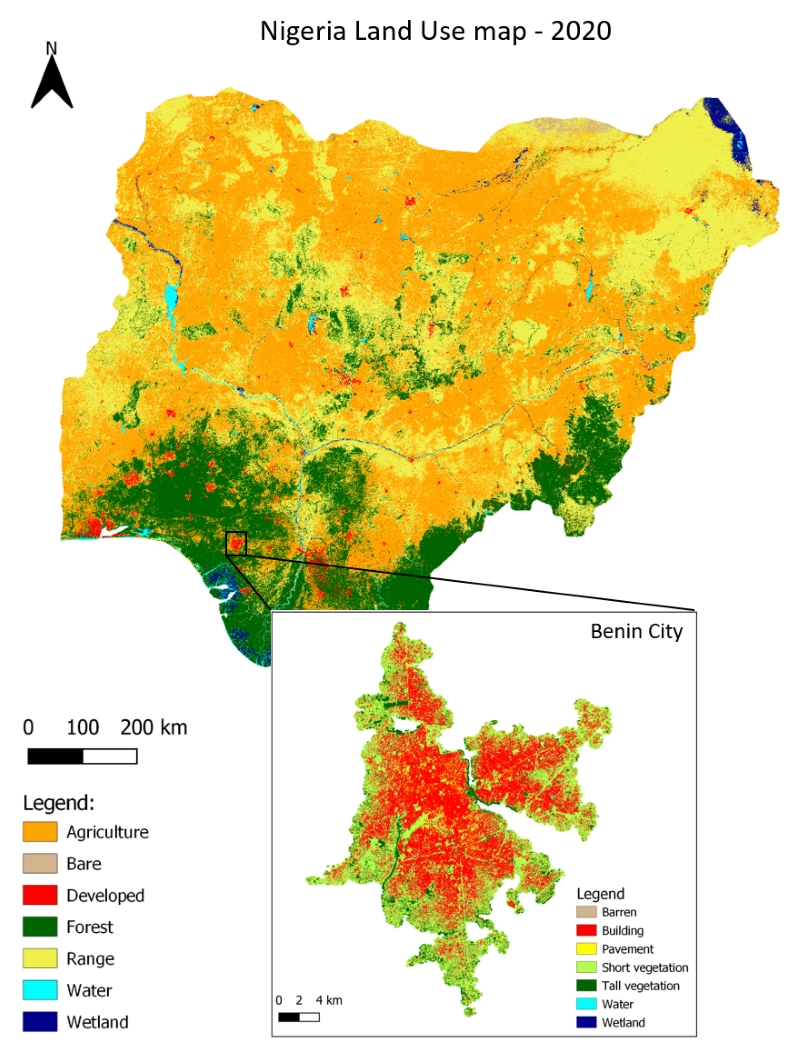
Figure 1. Predicted land use for Nigeria with a detailed land cover for Benin City (inset).
Citation
Vogeler, J., and S. Shah Heydari. 2024. Annual Land Use and Urban Land Cover: Ethiopia, Nigeria, and South Africa, 2016-2020. ORNL DAAC, Oak Ridge, Tennessee, USA. https://doi.org/10.3334/ORNLDAAC/2367
Table of Contents
- Dataset Overview
- Data Characteristics
- Application and Derivation
- Quality Assessment
- Data Acquisition, Materials, and Methods
- Data Access
- References
Dataset Overview
This dataset provides a two-tier annual Land Use (LU) and Urban Land Cover (LC) product suite over three African countries, Ethiopia, Nigeria, and South Africa, across a 5-year period of 2016-2020. Remote sensing data sources were used to create 30-m resolution LU maps (Tier-1), which were then utilized to delineate urban boundaries for 10-m resolution LC classes (Tier-2). Random Forest machine learning classifier models were trained on reference data for each tier and country (but one model was trained across all years); models were validated using a separate reference data set for each tier and country. Tier-1 LU maps were based on the 30-m Landsat time series, and Tier-2 urban LC maps were based on the 10-m Sentinel-2 time series. Additional data sources included climate, topography, night-time light, and soils. The overall map accuracy was 65-80% for Tier-1 maps and 60-80% for Tier-2 maps, depending on the year and country. The data are provided in cloud optimized GeoTIFF (COG) format.
The ORNL DAAC compiles, archives, and distributes data on vegetation from local to global scales. Specific topic areas include: belowground vegetation characteristics and roots, vegetation biomass, fire and other disturbance, vegetation dynamics, land cover and land use change, vegetation characteristics, and NPP (Net Primary Production) data.
Related Publications:
Cardenas-Ritzert, O.S. E., J.C. Vogeler, S. Shah Heydari, P.A. Fekety, M. Laituri, and M. McHale. 2024. Automated Geospatial Approach for Assessing SDG Indicator 11.3.1: A multi-level evaluation of urban land use expansion across Africa. ISPRS International Journal of Geo-Information 13:226. https://doi.org/10.3390/ijgi13070226
Shah Heydari, S., J.C. Vogeler, O. Cardenas-Ritzert, S.K. Filippelli, M. Laituri, and M. McHale. 2024. Multi-tier land use and land cover mapping framework and its application in urbanization analysis in three African countries. Remote Sensing, In Press.
Acknowledgements:
This work was funded by the NASA Land Cover and Land Use Change Program (grant 80NSSC21K0313). O. Cardenas-Ritzert, S. Filippelli, M. Laituri, and M. McHale contributed to the development of project objectives and analyses.
Data Characteristics
Spatial Coverage: Ethiopia, Nigeria, and South Africa
Spatial Resolution: 30 m for Tier 1 land use; 10 m for Tier 2 land cover
Temporal Coverage: 2016-01-01 to 2020-12-31
Temporal Resolution: Annual estimates
Study Areas: Latitude and longitude are given in decimal degrees.
| Site | Westernmost Longitude | Easternmost Longitude | Northernmost Latitude | Southernmost Latitude |
|---|---|---|---|---|
| Ethiopia | 32.02876 | 49.68746 | 16.20533 | 2.98263 |
| Nigeria | 2.57257 | 14.90288 | 14.44025 | 4.16829 |
| South Africa | 15.98231 | 35.03725 | -20.62296 | -35.33684 |
Data File Information
This dataset includes 30 files in cloud optimized GeoTIFF (COG) format. The files hold integers that indicate land use/land cover classes. There are 10 files for each of three countries and two files for each country-year combination.
The file naming convention is <country>_<year>_<tier>.tif, where
- <country> = "Ethiopia", "Nigeria", or "SouthAfrica"
- <year> = year of estimate: 2016, 2017, 2018, 2019, or 2020
- <tier> = "T1" for Tier 1 land use or "T2" for Tier 2 land cover.
Tier 1 (T1) files hold land use across the entire country while Tier 2 (T2) files provide land cover classification for delineated urban areas.
GeoTIFF characteristics:
- Pixel Values: Integers indicating land use/land cover classes (Table 1).
- Spatial resolution: 30 m for T1; 10 m for T2
- Coordinate system: WGS 1984 Albers for Africa
- Proj.4 string: +proj=aea +lat_0=0 +lon_0=0 +lat_1=20 +lat_2=-23 +x_0=0 +y_0=0 +datum=WGS84 +units=m +no_defs
Table 1. Pixel values and land use/land cover classes for GeoTIFFs.
| Pixel value | Tier 1 (land use) | Tier 2 (urban land cover) |
|---|---|---|
| 0 | No data | No data |
| 1 | Agriculture | Barren |
| 2 | Bare | Building |
| 3 | Developed | Pavement |
| 4 | Forest | Short Vegetation |
| 5 | Rangeland | Tall Vegetation |
| 6 | Water | Water |
| 7 | Wetland | Wetland |
Application and Derivation
The aim of this work was to develop an integrated mapping framework to support urbanization related assessments of land use and land cover (LULC) change. The methodology allows for the identification of dynamic urban boundaries and quantification of annual urbanization-driven change for 2016 - 2020. The country-wide LU maps were the base data for capturing dynamic urban boundaries described in Cardenas-Ritzert et al. (2024). The Tier-2 maps were used to calculate the United Nations defined Sustainable Development Goal Indicator 11.3.1 related to urbanization rates and identifying hotspots of rapid urban expansion.
These LULC products for developing countries can serve as a basis for monitoring historic and current patterns of land use as well as its socioeconomic impacts. For Instance, incorporating multiple resolutions may elicit more nuanced depictions of how urbanization manifests on the landscape. Basic relationships between land uses and social-environmental services can lead to decisions that amplify inequities and to biased urban planning policies (McHale et al., 2018).
Quality Assessment
Model accuracy was assessed using an independent set of validation points for each country and product tier. One of the generated maps was used to make a stratified sample within map classes and the strata information was used to assess area-adjusted map accuracy for each year (e.g., Stehman, 2014). The overall map accuracy was 65-80% for Tier-1 maps and 60-80% for Tier-2 maps, depending on the evaluation year and country.
Table 2. Accuracy assessment for Tier 1 land uses for 2020.
| Ethiopia | Nigeria | South Africa | |||||||
|---|---|---|---|---|---|---|---|---|---|
| LU Class | UA | PA | F1 | UA | PA | F1 | UA | PA | F1 |
| Agriculture | 61.2 | 77 | 68.2 | 72.4 | 77.4 | 74.8 | 64.7 | 89.9 | 75.3 |
| Bare | 45.5 | 95.8 | 61.7 | 81 | 27.9 | 41.5 | 53.7 | 6.9 | 12.2 |
| Developed | 33.1 | 23.4 | 27.4 | 81.5 | 47.8 | 60.3 | 92 | 24.1 | 38.2 |
| Forest | 76.4 | 80.2 | 78.3 | 62.7 | 59 | 60.8 | 53.7 | 82.9 | 65.10 |
| Range | 86.4 | 72 | 78.5 | 57.9 | 57.4 | 57.6 | 77.4 | 88.5 | 82.6 |
| Water | 96.7 | 100 | 98.3 | 75.3 | 92.9 | 83.2 | 86.3 | 98.8 | 92.1 |
| Wetland | 57.7 | 64.7 | 61 | 78.3 | 49.7 | 60.8 | 67.60 | 8.30 | 14.8 |
| Map OA | 95% CI | Map OA | 95% CI | Map OA | 95% CI | ||||
| 74.60 | ±7.3 | 65.9 | ±5.4 | 73.60 | ±6.8 | ||||
- OA = overall accuracy, PA = producer accuracy, UA = user accuracy, F1 = the harmonic mean of PA and UA,
and 95% CI = error value for constructing 95% confidence interval for Map OA
Table 3. Accuracy assessment for Tier 2 land cover for 2020.
| Ethiopia | Nigeria | South Africa | |||||||
|---|---|---|---|---|---|---|---|---|---|
| LC Class | UA | PA | F1 | UA | PA | F1 | UA | PA | F1 |
| Barren | 40.1 | 60.4 | 48.2 | 66.9 | 31.8 | 43.1 | 68.8 | 36.4 | 47.6 |
| Building | 68.1 | 55.6 | 61.2 | 58.4 | 85.2 | 69.3 | 48 | 85.8 | 61.5 |
| Pavement | 29.3 | 63.1 | 40 | 66.2 | 26.9 | 38.30 | 46.1 | 41.7 | 43.8 |
| Short vegetation | 89.8 | 85.7 | 87.7 | 75.2 | 74.3 | 74.7 | 85.4 | 67.5 | 75.4 |
| Tall vegetation | 62.7 | 63.2 | 63 | 65.7 | 70.1 | 67.8 | 46.5 | 55.9 | 50.8 |
| Water | 96.7 | 95.8 | 96.3 | 90 | 96.4 | 93.1 | 77.5 | 82.3 | 79.8 |
| Wetland | 52.3 | 58.8 | 55.4 | 86.8 | 58.9 | 70.2 | 16.9 | 90.2 | 28.4 |
| Map OA | 95% CI | Map OA | 95% CI | Map OA | 95% CI | ||||
| 78.3 | ±5.1 | 66.3 | ±5.3 | 62.8 | ±3.7 | ||||
Consult Shah Heydari et al. (2024, In Press) for full assessment results.
Data Acquisition, Materials, and Methods
All remote sensing data used in this project (Table 4) were obtained through Google Earth Engine (GEE) data repository except WorldClim data (www.worldclim.org, version 2.1). All data were resampled to the target resolution (30 m for Tier-1, 10 m for Tier-2). All optical data (Landsat/Sentinel-2) were filtered for cloud/cloud shadow pixels using the sensor quality bits. For Sentinel-2, an additional cloud processing was applied to enhance the detection using GEE’s cloud masking utility (s2cloudless; Google, 2023). Speckle filtering and a few more enhancements were applied to Sentinel-1 SAR data (Mullissa et al., 2021).
Table 4: Input data sources used for map synthesis in Tier-1 and Tier-2 products. Derived spatial indices (TCA/TCB/TCG/TCW, UCI, BAI/BAEI/NBAI, WI, and MNDWI) and calculated GLCM metrics are described in Shah Heydari et al. (2024, In Press).
| Imagery Details | |||
|---|---|---|---|
| Sensor type / Dataset | Tier 1 Land Use products | Tier 2 Land Cover products | Derived features |
| Optical | Landsat Collection-2 Surface Reflectance @ 30 m: six bands of Blue, Green, Red, NIR, SWIR1, and SWIR2
|
Sentinel-2 Top of Atmosphere @ 10 m: six bands of B2(blue), B3(green), B4(red), B8(NIR), B11(SWIR1), B12(SWIR2)
|
Zonal (optical/radar source): Min/Mean/Max/StDev of the pixel values within a 3x3 and 5x5 neighborhood Context (optical/radar source): GLCM metrics of ASM, Contrast, Correlation, Variance, Sum average, Entropy, Information Measures of correlation (1 and 2), Dissimilarity, Cluster shade, and Cluster prominence |
| Synthetic Aperture Radar | Sentinel-1 SAR Ground Range Detected VV polarization @ 30 m
|
Sentinel-1 SAR Ground Range Detected VV polarization @ 10 m
|
|
| Visible Infrared Imaging Radiometer Suite (VIIRS) Day/Night Band (DNB) @ 460 m | Included | Included | Yearly median of average monthly radiance values (months with at least two observations are counted) |
| TerraClimate @1/24 degree (~4.5 km) | Not included | Included | Total year precipitation and yearly minimum/maximum temperature |
| WorldClim V2.1 @ 30 arcsec (~1 km) | Included | Included | 19 bioclimatic variables (bio_01 to bio_19) featuring normal (30-years) temperature and precipitation statistics, as defined in Appendix 1 |
| SRTM digital elevation data @ 30 m | Included | Included | Terrain parameter (elevation, slope, aspect) – static parameter |
| Continuous Heat-Insolation Load Index (CHILI_Index) @ 90 m | Included | Included | CHILI index (a number between 0 to 255) |
| iSDA soil texture class @ 30 m | Included | Included | USDA Texture Class at 0-20cm depth (a number from 0 to 12) |
| World Ecoregions (RESOLVE), vector dataset | Included | Included | Ecoregion identifier (a 3-digit number) |
The training data were created using a mixture of random and manual points within each country’s extent (Table 5). The land use and land cover were interpreted manually for each year within 2016-2020 by trained interpreters using Google Earth high-resolution imagery, a Landsat time-series viewer application named TimeSync Plus (Oregon State University, 2023; Cohen et al., 2010.), and a similar tool developed for viewing Sentinel-2 data trajectories. One of the generated maps was then used to make a stratified sample within map classes and the sampled information was used to assess area-adjusted map accuracy for each year according to Stehman (2014) (see Tables 2-3).
Table 5. Number of interpreted reference pixels for training and validation for Tier 1 and Tier 2 across each study country.
| Country | Tier | Training pixels | Validation pixels |
|---|---|---|---|
| Ethiopia | Tier 1, whole country | 740 | 550 |
| Tier 2, final urban agglomerations | 1172 | 700 | |
| Nigeria | Tier 1, whole country | 687 | 700 |
| Tier 2, final urban agglomerations | 1200 | 525 | |
| South Africa | Tier 1, whole country | 957 | 1000 |
| Tier 2, final urban agglomerations | 2897 | 1050 |
Using training data for all years, a supervised Random Forests model (Scikit-learn, 2023; Pedregosa et al., 2011) was trained and optimized using the best features found after an iterative feature selection. A variety of parameter settings for the Random Forest models were tested including the number of trees, maximum depth, and minimum leaf size. The best balance between complexity and model improvements was provided by 100 trees grown to unlimited depth with a minimum leaf size of four.
The total number of features created from data sources (Table 4) was 154 features for Tier 1 maps and 170 features for Tier 2 maps. These numbers were reduced to a limited set of less-correlated features (between 28 - 53 features) for final models. For each country and product tier, the correlation matrix for the training data was calculated, and a dendrogram (hierarchical clustering model) of feature correlations was created. Through an iterative process, different thresholds were used to cut the dendrogram to generate a set of randomly selected features from each cluster. These features were used to train a Random Forests model, and model performance was calculated. A final set of 10-20 top performing models were selected for further visual refining. This extra refining step was needed because models with comparable model assessment results can still produce significantly different map products when applied spatially. For final model selection, the model outputs were visually compared within several heterogeneous test areas for each product tier and study country. The trained model was then applied to the full extent of Tier 1 (country-level) or Tier 2 (urban centers within each country) for each year within that period.
To make land use transitions more realistic for Tier 1 products, a 3-year window (current year, one year before, one year after) was applied to extract the features and train models. For post processing, small patches of <5 pixels with the same land use type were removed, and each pixel was replaced with the majority pixel value from the immediate eight neighbors. For Tier 2 processing, the features were extracted just for the current year because the land cover can have spontaneous yearly changes. A gap filling procedure was performed to fill the input features with a replacement from previous and/or next year if there was a null in the input data. No spatial post-processing was applied to the Tier 2 products.
Data Access
These data are available through the Oak Ridge National Laboratory (ORNL) Distributed Active Archive Center (DAAC).
Annual Land Use and Urban Land Cover: Ethiopia, Nigeria, and South Africa, 2016-2020
Contact for Data Center Access Information:
- E-mail: uso@daac.ornl.gov
- Telephone: +1 (865) 241-3952
References
Cardenas-Ritzert, O.S. E., J.C. Vogeler, S. Shah Heydari, P.A. Fekety, M. Laituri, and M. McHale. 2024. Automated Geospatial Approach for Assessing SDG Indicator 11.3.1: A multi-level evaluation of urban land use expansion across Africa. ISPRS International Journal of Geo-Information 13:226. https://doi.org/10.3390/ijgi13070226
Cohen, W. B., Z. Yang, and R. Kennedy. 2010. Detecting trends in forest disturbance and recovery using yearly Landsat time series: 2. TimeSync — Tools for calibration and validation. Remote Sensing of Environment 114:2911–2924. https://doi.org/10.1016/j.rse.2010.07.010
Google. 2023. Sentinel-2 Cloud Masking with s2cloudless. https://developers.google.com/earth-engine/tutorials/community/sentinel-2-s2cloudless
McHale, M.R., S.M. Beck, S.T. A. Pickett, D.L. Childers, M.L. Cadenasso, L. Rivers, L. Swemmer, L. Ebersohn, W. Twine, and D.N. Bunn. 2018. Democratization of ecosystem services—a radical approach for assessing nature’s benefits in the face of urbanization. Ecosystem Health and Sustainability 4:115–131. https://doi.org/10.1080/20964129.2018.1480905
Mullissa, A., A. Vollrath, C. Odongo-Braun, B. Slagter, J. Balling, Y. Gou, N. Gorelick, and J. Reiche. 2021. Sentinel-1 SAR Backscatter Analysis Ready Data Preparation in Google Earth Engine. Remote Sensing 13:1954. https://doi.org/10.3390/rs13101954
Oregon State University. 2023. eMapR/TimeSync-Plus: An application for gathering point and polygon spectral temporal information from Landsat time series data into a database. Retrieved September 19, 2023, from https://github.com/eMapR/TimeSync-Plus.
Pedregosa, F., G. Varoquaux, A. Gramfort, V. Michel, B. Thirion, O. Grisel, M. Blondel, P. Prettenhofer, R. Weiss, V. Dubourg, J. Vanderplas, A. Passos, D. Cournapeau, M. Brucher, M. Perrot, and E. Duchesnay. 2011. Scikit-learn: Machine Learning in Python. Journal of Machine Learning Research 12:2825-2830. http://jmlr.org/papers/v12/pedregosa11a.html
Scikit. 2023. Scikit-learn: Machine learning in Python—Scikit-learn 1.3.0 documentation. Retrieved September 19, 2023, from https://scikit-learn.org/stable
Shah Heydari, S., J.C. Vogeler, O. Cardenas-Ritzert, S.K. Filippelli, M. Laituri, and M. McHale. 2024. Multi-tier land use and land cover mapping framework and its application in urbanization analysis in three African countries. Remote Sensing, In Press.
Stehman, S.V. 2014. Estimating area and map accuracy for stratified random sampling when the strata are different from the map classes. International Journal of Remote Sensing 35:4923-4939. https://doi.org/10.1080/01431161.2014.930207
Worldclim. 2023. Worldclim Biometric variables. https://www.worldclim.org/data/bioclim.html