Revision Date: July 15, 2014
Summary:
This data set provides global leaf area index (LAI) values for woody species. The data are a compilation of field-observed data from 1,216 locations obtained from 554 literature sources published between 1932 and 2011. Only site-specific maximum LAI values were included from the sources; values affected by significant artificial treatments (e.g. continuous fertilization and/or irrigation) and LAI values that were low due to drought or disturbance (e.g. intensive thinning, wildfire, or disease), or because vegetation was immature or old/declining, were excluded (Iio et al., 2014).
To maximize the generic applicability of the data, original LAI values from source literature and values standardized using the definition of half of total surface area (HSA) are included. Supporting information, such as geographical coordinates of plot, altitude, stand age, name of dominant species, plant functional types, and climate data are also provided in the data file.
There is one data file in comma-separated (.csv) format with this data set and one companion file which provides the data sources.
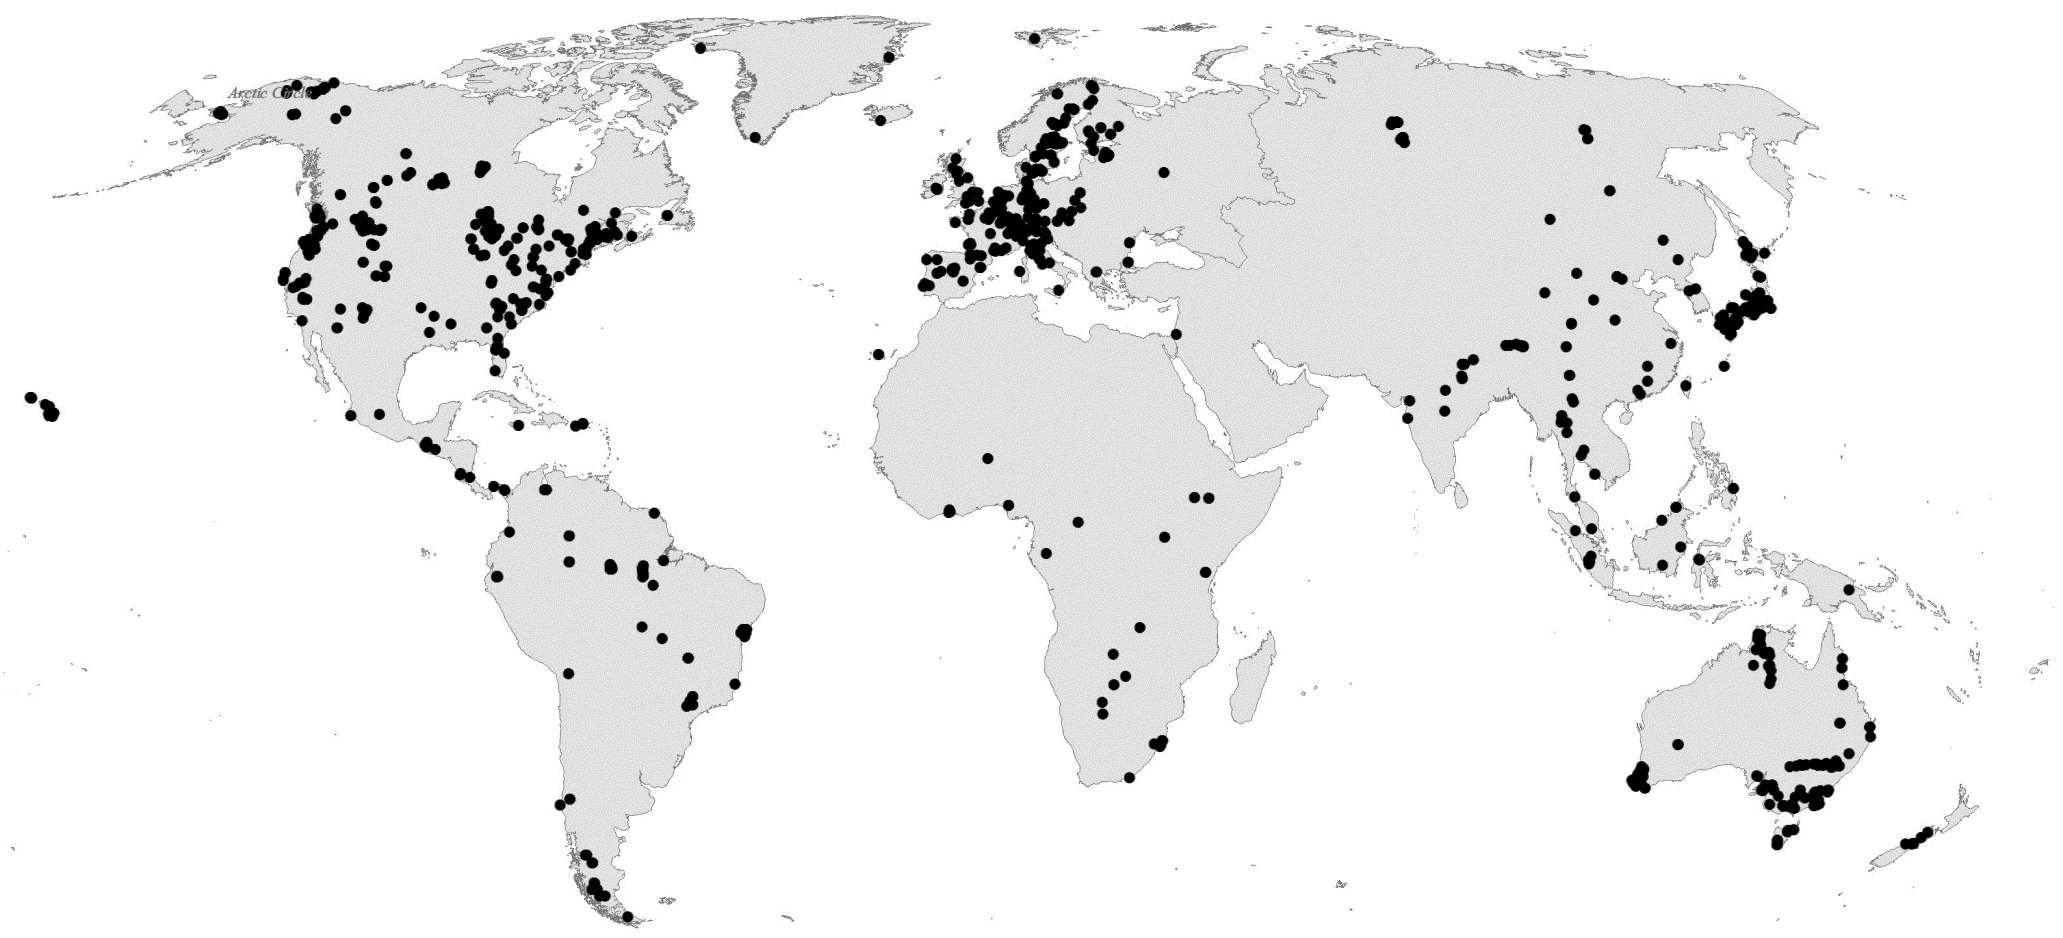
Figure 1. Global distribution of field plots of LAI data from sources used in the data compilation (Lio et al., 2013).
Acknowledgements: This study was supported by a Grant-in-Aid for Scientific Research on Innovative Areas in Japan ‘Comprehensive studies of plant responses to high CO2 world by an innovative consortium of ecologists and molecular biologists’ (no. 22114513).
Data and Documentation Access:
Get Data: http://daac.ornl.gov/cgi-bin/dsviewer.pl?ds_id=1231
Companion File: LAI_Database_Reference_List.pdf
Data Citation:
Cite this data set as follows:
Iio, A., and A. Ito. 2014. A Global Database of Field-observed Leaf Area Index in Woody Plant Species, 1932-2011. Data set. Available on-line [http://daac.ornl.gov] from Oak Ridge National Laboratory Distributed Active Archive Center, Oak Ridge, Tennessee, USA. http://dx.doi.org/10.3334/ORNLDAAC/1231
Table of Contents:
- 1 Data Set Overview
- 2 Data Characteristics
- 3 Applications and Derivation
- 4 Quality Assessment
- 5 Acquisition Materials and Methods
- 6 Data Access
- 7 References
1. Data Set Overview:
This data set provides global leaf area index (LAI) values for woody species. The data are a compilation of field-observed data from 1,216 locations (mostly on a plot basis) obtained from 554 literature sources published between 1932-2011. Onlysite-specific maximum LAI values were included from the sources; values affected by significant artificial treatments (e.g. continuous fertilization and/or irrigation) and LAI values that were low due to drought or disturbance (e.g. intensive thinning, wildfire, or disease), or because vegetation was immature or old/declining, were excluded. To maximize the generic applicability of the data, original LAI values from source literature and values standardized using the definition of half of total surface area (HSA) are included. Supporting information, such as geographical coordinates of plot, elevation, stand age, name of dominant species, plant functional types, and climate data are also provided.
2. Data Characteristics:
Spatial Coverage
Field-observed data were compiled from 1,216 locations. See Figure 1.
Site boundaries: (All latitude and longitude given in decimal degrees)
| Site (Region) | Westernmost Longitude | Easternmost Longitude | Northernmost Latitude | Southernmost Latitude |
|---|---|---|---|---|
| Global | -164.78 | 175.62 | 78.42 | -54.2 |
Temporal Coverage
The data are from published measurements taken between 1932-2011.
Data File Information
There is one comma separated (.csv) data file. Missing numeric values are represented by -9999. Missing text fields are blank cells.
Table 1. Data file description: LAI_Woody_Plants_Database.csv
| Column | Column Name | Units/format | Description |
|---|---|---|---|
| 1 | Reference_number | Number of reference (see reference companion file) | |
| 2 | Publication_year | Year | Year of publication of source literature |
| 3 | Overstory_LAI_original | m2 m-2 | Overstory LAI reported in source literature |
| 4 | Understory_LAI_original | m2 m-2 | Understory LAI reported in source literature |
| 5 | Total_LAI_original | m2 m-2 | Stand total LAI reported in source literature (overstory + understory LAI) |
| 6 | Source | Tables and figures in source literature, in which LAI values are reported: T: table, F: figure | |
| 7 | Definition_overstory | Definition of overstory LAI: PA: projected area, HSA: half of total surface area, TSA: total surface area | |
| 8 | Definition_understory | Definition of understory LAI: PA: projected area, HSA: half of total surface area, TSA: total surface area | |
| 9 | Definition_total | Definition of stand total LAI: PA: projected area, HSA: half of total surface area, TSA: total surface area | |
| 10 | Conversion_factor_overstory | Factor used for converting overstory LAI to half of total surface area | |
| 11 | Conversion_factor_understory | Factor used for converting understory LAI to half of total surface area | |
| 12 | Conversion_factor_total | Factor used for converting total LAI to half of total surface area | |
| 13 | Overstory_LAI_HSA | m2 m-2 | Overstory LAI based on half of total surface area |
| 14 | Understory_LAI_HSA | m2 m-2 | Understory LAI based on half of total surface area |
| 15 | Total_LAI_HSA | m2 m-2 | Total LAI based on half of total surface area (overstory + understory LAI) |
| 16 | Element_clumping_index_overstory | Element clumping index for overstory LAI | |
| 17 | Element_clumping_index_total | Element clumping index for total LAI | |
| 18 | Needle_clumping_index_overstory | Needle clumping index for overstory LAI | |
| 19 | Needle_clumping_index_total | Needle clumping index for total LAI | |
| 20 | Corrected_overstory_LAI_HSA | m2 m-2 | Overstory LAI after clumping correction |
| 21 | Corrected_total_LAI_HSA | m2 m-2 | Total LAI after clumping correction |
| 22 | Method | Measurement methods used to obtain LAI: D: Direct methods, IR: Indirect optical methods assuming random leaf distribution, IC: Indirect optical methods taking into account foliage clumping, IR2: Indirect optical methods taking into account only one of two foliage clumping indices (We or ge) in conifer, O: Other methods | |
| 23 | Method_2 | Measurement methods used for LAI (detail): Allometry2: Allometric methods, the equations which were derived from other sites. | |
| 24 | Notes_Method | Other supporting information for measurement methods | |
| 25 | MAT | Degree | Mean annual temperature described in source literature |
| 26 | MAP | mm | Mean annual precipitation described in source literature |
| 27 | Stand_age | Year | Stand age |
| 28 | Stand_age2 | Stand age (categorical): Y: young, I: intermediate, M: mature | |
| 29 | Dominant_species | Name of dominant species | |
| 30 | PFT1 | Plant functional type 1 (life form): TREE, SHRUB, MANG: Mangrove, WOODY: other woody species, GRASS, MOSS | |
| 31 | PFT2 | Plant functional type 2 (phylogeny): ANGIO: Angiosperm, GYMNO: Gymnosperm, Mix: Mixture of ANGIO and GYMNO | |
| 32 | PFT3 | Plant functional type 3 (leaf shape): BROAD: Broad flat-leaf, CONIF: Coniferous, M: Mixture of BROAD and CONIF | |
| 33 | PFT4 | Plant functional type 4 (leaf phenology): DECID: Winter deciduous, EVER: Evergreen, sDECID: semi-deciduous, Mix: Mixture of various types | |
| 34 | Vegetation_status | Vegetation status of stands: Natural, Plantation, Mix (Mixture of several types), Not described | |
| 35 | Country | Country name | |
| 36 | Location | Location name | |
| 37 | Site | Site or plot name | |
| 38 | Latitude | Decimal Degree | Latitude |
| 39 | Longitude | Decimal Degree | Longitude |
| 40 | Elevation | m | Elevation above sea level |
| 41 | Notes | Other supporting information |
3. Data Application and Derivation:
These data can be used as a source of input data for models and for validation of LAI estimated from models and remotely sensed data.
Leaf area index LAI is one of the key variables related to carbon, water and nutrient cycles in terrestrial ecosystems, but its global distribution patterns remain poorly understood. Iio et al., 2014 evaluated the dependence of LAI on mean annual temperature (MAT) and wetness index (WI); a ratio of annual precipitation to potential evapotranspiration for three plant functional types (PFTs): deciduous broadleaf, DB; evergreen conifer, EC; evergreen broadleaf, EB at the global scale.
4. Quality Assessment:
Potential bias resulting from optically indirect estimates of LAI was corrected by applying typical clumping indices derived from the standard literature (Iio et al., 2014).
Potentially erroneous coordinates located in water bodies or other unlikely areas were checked by using a global gridded (10'´x 10') climate database (CRU 2.0, http://www.cru.uea.ac.uk/data/).
Although LAI was found to be significantly correlated with MAT, WI and PFTs, there was still a fair degree of unexplained variation in our global LAI data set (Iio et al., 2014). This variation could stem from methodological inaccuracies and/or biotic and abiotic factors that are not considered in this analysis. Regarding methodological uncertainties, different experimental designs used in the source studies, such as plot sizes and number of samplings, could have been responsible for some of the unexplained variation in our database. Furthermore, the extensive time period over which the source literature was published, 1932−2011, could lead to uncertainty because measurement techniques, especially for the IR approach, have changed considerably over time and because ambient CO2 concentration has increased by more than 50 ppm in the past 50 years, which may have affected LAI (Norby et al., 2005); (McCarthy et al., 2006). The fact that only 6% of the total number of records explicitly included understorey LAI grass/herb/shrub layers may also cause uncertainty, especially in the case of regions of sparse vegetation such as savanna and tundra.
5. Data Acquisition Materials and Methods:
The data are a compilation of field-observed data from 1,216 locations mostly on a plot basis obtained from 554 literature sources and databases published between 1932-2011. Only LAI site-specific maximum values were included from the sources as described in Iio et al., 2014.
Data Sources
(1) Literature published up until 2011: Literature searches were conducted using online databases (e.g. ISI Web of Science) or search engines (e.g. Google Scholar) with the search terms ‘forest’ and ‘leaf area index’. Literature was identified from this initial list that reported LAI values based on field measurements (i.e. publications that relied solely on theoretical calculations were excluded). Additional literature sources were identified from the bibliographies of those articles. A list of literature sources used is contained in the companion file ref.txt.
(2) Web-accessible databases: These included Scurlock et al. (2001), http://dx.doi.org/10.3334/ORNLDAAC/584; FLUXNET, http://www.fluxnet.ornl.gov/; and VALERI, http://w3.avignon.inra.fr/valeri.
(3) Data books: These included Reichle 1981 and Cannell 1982. When data were used from the pre-existing databases, wherever possible, the source literature was checked for each data set to ensure that it met our criteria below.
The data were included in the database if the source included the following:
(1) The description of the geographical location of the observational plot..
(2) The description of the method used to measure LAI. When several LAI values measured by different methods were available, priority was given to LAI values estimated by direct methods (D); e.g., destructive harvesting, allometric equations, litter trapping. Other data were not included because it is generally assumed that D is the most accurate method for quantifying LAI.
(3) The description of the name of dominant species or plant functional type PFT; i.e., phenology and leaf shape in the plot was provided.
(4) The definition of LAI (e.g., projected area basis, surface area basis) was described or could be assumed based on our criteria; see the section on Data manipulation.
(5) The plots observed were free from significant artificial treatments such as continuous CO2 enrichment, heating, fertilization, and irrigation.
(6) LAI values that were clearly low due to drought, disturbance e.g., management, wildfire, insect herbivory or disease, or the presence of immature or old and declining vegetation were excluded i.e., maximum LAI was selected as far as possible.
(7) When seasonal and inter-annual changes in LAI were available, only the maximum value was included i.e., one value per plot.
Database Variables
Measurement methods for LAI
The LAI measurement methods were separated into four groups:
(1) Direct methods (D), including destructive harvesting, litter trapping and allometric approaches.
(2) Indirect optical methods assuming foliage randomness (IR), in which the fraction of gap in the canopy was measured using commercial instruments such as the plant canopy analyzer (LAI-2000, Li-Cor, Inc., Lincoln, NE, USA), fish-eye cameras and ceptometers.
(3) Indirect optical methods that took into account foliage non-randomness (i.e. clumping) (IC), by combining measurements of gap fraction and gap-size distribution in the canopy (Chen and Cihlar 1995; Leblanc et al. 2005) or by direct calibration against D estimates of LAI.
(4) Other methods (OT), such as indirect contact methods (e.g. plumb line, point quadrat), semi-direct approaches (e.g. litter trapping for evergreen species) and other empirical approaches (e.g. leaf counting, visual methods, the Adelaide method).
Vegetation status
LAI data from plantations were included only when artificial manipulation was not significant (i.e. continuous fertilization and irrigation and/or heavy thinning was not conducted in the plot). The vegetation status was divided into four subgroups:
(1) Plantation (trees had been planted)
(2) Natural forest (trees had grown naturally)
(3) Mixture of (1) and (2)
(4) Not described in source literature.
Geographical locations
Country, location, site name, geographical coordinates and altitude are also included. When the geographical coordinates of the plots were not provided in the source literature, they were determined from the place name by using national maps, Global Gazetteer Version 2.2 (http://www.fallingrain.com/world) or Google Earth.
Stand age and related information (e.g. mature, young, old-growth forests)
When year of tree planting or emergence was described in the literature source, stand age was calculated by subtracting the year in which a stand was established from the year in which LAI measurements were made.
Climate variables-mean annual temperature and precipitation were included if available in the literature.
LAI in different layers
LAI data divided into different layers (e.g., sub-canopy layer, understory, ground vegetation), were summarized to produce three values: overstory, understory and total LAI (total = overstory + understory). In the case of understory, LAI values for herbaceous species were also included because species composition is not clearly described in most papers (i.e. making a distinction between woody and herbaceous species is difficult for understory vegetation).
Data manipulation
If values in the literature were given as a range, the mid-range values were selected (e.g. if LAI was reported as 4.5-5.0, we input 4.75 as a representative value).
Standardizing definitions of LAI
The definition of LAI was standardized as half of the total leaf surface area (HSA) per unit ground area because this is considered to be the most appropriate definition for light transfer models and is a useful measure for making comparisons between different leaf shapes (Chen and Black 1992). The factors applied in order to convert from projected area (PA) to HSA are derived from Cannell (1982): 1.4 for pine, 1.15 for other conifers and 1.0 for broadleaf species.
The following were assumed if the definition of LAI was not provided in the source literature:
(1) The definition for flat broadleaf species is on the basis of projected leaf area, because other definitions are rarely employed for this leaf type.
(2) The definition for conifer species measured using indirect optical instruments is HSA (Chen and Black 1992; Stenberg et al. 1994). The definition for herbaceous species in the understory was assumed to be projected leaf area.
(3) After standardizing the definition of LAI (see above), clumping correction was applied for LAI estimated by indirect optical methods assuming random foliage distribution (IR). The contribution made by woody elements to the interception of radiation was assumed to be small (Kucharik et al. 1997). For a clumped canopy, the LAI obtained from IR methods (effective leaf area index, LAIe) was converted to ‘true’ LAI by:
LAI = LAIe ×ge /We
where ge and We are within-shoot clumping index and element clumping index, respectively.
For flat broadleaves, ge is equal to 1.0. Clumping indices used for correcting LAIe were derived from the global database compiled by Pisek et al. (2011) which contained data from 63 sites worldwide, including most major plant functional types (PFTs) and ranging from tropical to boreal climatic zones. The global mean values of We and ge (0.85 and 1.52, respectively) for correcting LAIe were used. For understory, the foliage was assumed not to be clumped irrespective of PFT (i.e., ge and We = 1).
6. Data Access:
These data are available through the Oak Ridge National Laboratory (ORNL) Distributed Active Archive Center (DAAC).
Data Archive Center:
Contact for Data Center Access Information:
E-mail: uso@daac.ornl.gov
Telephone: +1 (865) 241-3952
7. References:
Cannell, M.G.R. 1982. World forest biomass and primary production data. pp 391. Academic Press, New York.
Chen, J.M., and T.A. Black. 1992. Defining leaf area index for non-flat leaves. Plant Cell and Environment, 15, 421-429.
Chen, J.M. and J. Cihlar. 1995. Plant canopy gap size analysis theory for improving optical measurements of leaf area index. Applied Optics, 34, 6211-6222.
Iio, A., K. Hikosaka, N.P.R. Anten,Y. Nakagawa, and A. Ito. 2014, Global dependence of field-observed leaf area index in woody species on climate: a systematic review. Global Ecology and Biogeography, 23: 274–285. DOI: 10.1111/geb.12133
Kucharik, C., J. Norman, L. Murdock, and S. Gower. 1997. Characterizing canopy nonrandomness with a multiband vegetation imager MVI. Journal of Geophysical Research, 102, 29455-29,473.
McCarthy, H.R., R. Oren, A.C. Finzi, and K.H. Johnsen. 2006. Canopy leaf area constrains [CO2]-induced enhancement of productivity and partitioning among aboveground carbon pools. Proceedings of the National Academy of Sciences USA, 103, 19356–19361.
Norby, R.J., E.H. DeLucia, B. Gielen, C. Calfapietra, C.P. Giardina, J.S., King, J. Ledford, H.R. McCarthy, D.J. Moore, and R.Ceulemans. 2005. Forest response to elevated CO2 is conserved across a broad range of productivity. Proceedings of the National Academy of Sciences USA, 102, 18052–18056 doi: 10.1073/pnas.0509478102.
Pisek, J., J.M. Chen, and T. Nilson. 2011. Estimation of vegetation clumping index using MODIS BRDF data. International Journal of Remote Sensing, 32, 2645-2657.
Reichle, D.E. 1981. Dynamic properties of forest ecosystems. pp 683. Cambridge University Press, Cambridge.
Scurlock, J.M.O., G.P. Asner, and S.T. Gower. 2001. Global leaf area index from field measurements, 1932-2000. Data set. Available on-line [http://daac.ornl.gov] from Oak Ridge National Laboratory Distributed Active Archive Center, Oak Ridge, Tennessee, U.S.A. doi:10.3334/ORNLDAAC/584.
Stenberg, P., S. Linder, H. Smolander, and J. Flower-Ellis. 1994. Performance of the LAI-2000 plant canopy analyzer in estimating leaf area index of some Scots pine stands. Tree Physiology, 14, 981-995.