Documentation Revision Date: 2023-08-24
Dataset Version: 1
Summary
This dataset provides one of the longest continuous records of global vegetation productivity. It has been widely used by the remote sensing community and has supported many scientific publications.
This dataset holds 82 files in NetCDF version 4 (.nc4) format.
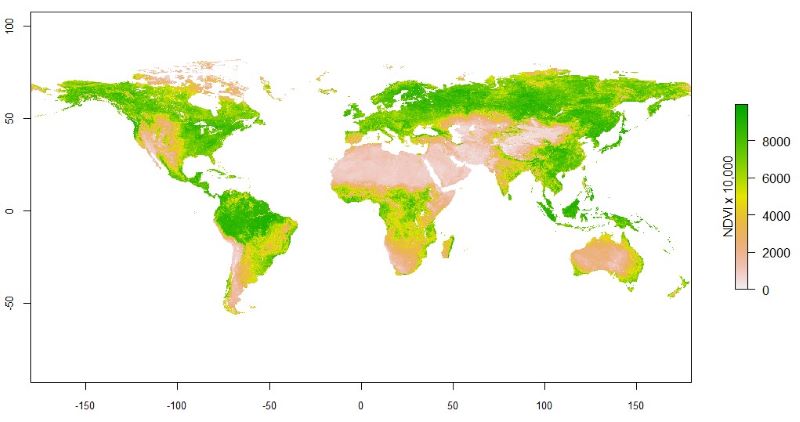
Figure 1. Global pattern of maximum normalized vegetation difference index (NDVI) estimated for late July 2021 from AVHRR Global Inventory Modeling and Mapping Studies-3rd Generation V1.2 (GIMMS-3G+) dataset. Source: ndvi3g_geo_v1_2_2021_0712.nc4.
Citation
Pinzon, J.E., E.W. Pak, C.J. Tucker, U.S. Bhatt, G.V. Frost, and M.J. Macander. 2023. Global Vegetation Greenness (NDVI) from AVHRR GIMMS-3G+, 1981-2022. ORNL DAAC, Oak Ridge, Tennessee, USA. https://doi.org/10.3334/ORNLDAAC/2187
Table of Contents
- Dataset Overview
- Data Characteristics
- Application and Derivation
- Quality Assessment
- Data Acquisition, Materials, and Methods
- Data Access
- References
Dataset Overview
This dataset holds the Global Inventory Modeling and Mapping Studies-3rd Generation V1.2 (GIMMS-3G+) data for the Normalized Difference Vegetation Index (NDVI). NDVI was based on corrected and calibrated measurements from Advanced Very High Resolution Radiometer (AVHRR) data with a spatial resolution of 0.0833 degree and global coverage for 1982 to 2022. Maximum NDVI values are reported within twice monthly compositing periods (two values per month). The dataset was assembled from different AVHRR sensors and accounts for various deleterious effects, such as calibration loss, orbital drift, and volcanic eruptions.
Project: Vegetation Collection
The ORNL DAAC compiles, archives, and distributes data on vegetation from local to global scales. Specific topic areas include: belowground vegetation characteristics and roots, vegetation biomass, fire and other disturbance, vegetation dynamics, land cover and land use change, vegetation characteristics, and NPP (Net Primary Production) data.
Related Publications
Pinzon, J.E., and C.J. Tucker. 2014. A non-stationary 1981–2012 AVHRR NDVI3g time series. Remote Sensing 6:6929-6960. https://doi.org/10.3390/rs6086929
Tucker, C.J., J.E. Pinzon, M.E. Brown, D.A. Slayback, E.W. Pak, R. Mahoney, E.F. Vermote, and N.E. Saleous. 2005. An extended AVHRR 8-km NDVI dataset compatible with MODIS and SPOT vegetation NDVI data. International Journal of Remote Sensing 26:4485-4498. https://doi.org/10.1080/01431160500168686
Acknowledgements
Support for the project has been provided by NASA's Goddard Space Flight Center (GSFC) and NASA's Arctic-Boreal Vulnerability Experiment (ABoVE) program (grant 80NSSC22K1256).
Data Characteristics
Spatial Coverage: Global
Spatial Resolution: 0.0833 degree
Temporal Coverage: 1982-01-01 to 2022-12-31
Temporal Coverage: Two estimates per month over 14-16 day compositing periods
Study Area: Latitudes and longitudes in decimal degrees
| Study Area | Westernmost Longitude | Easternmost Longitude | Northernmost Latitude | Southernmost Latitude |
|---|---|---|---|---|
| Global | -180.0 | 180.0 | 90.0 | -90.0 |
Data File Information
This dataset holds 80 files in NetCDF (.nc4) format. There are two files per year for 1982 to 2021. Each file holds data for a six month period with two estimates per month; each estimate covers a 14-to-16 day compositing period for the first half or second half of the month.
The file naming convention is ndvi3g_geo_[version]_[year]_[month1][month2].nc4. (e.g., ndvi3g_geo_v1_2_2021_0106.nc4), where
- version = alphanumeric version designation (e.g., "v1")
- year = 4-digit year
- month1 = 2-digit month at beginning of composite period ("01" = January or "07" = July)
- month2 = 2-digit month at end of composite period ("06 = June or "12" = December)
The data are projected into geographic coordinates (longitude, latitude) in WGS84 datum.
The nodata fill-value is -32768. Except for longitude, latitude coordinates, variables are in integer format.
Table 1. Data dictionary.
| Variable | Units | Description |
|---|---|---|
| time | days since 1982-01-01 | Middle day of each compositing time period |
| time_bnds | days since 1982-01-01 | Two values listing the beginning and ending days of the compositing time period |
| lon | degrees_east | Longitude of center of pixel in decimal degrees |
| lat | degrees_north | Latitude of center of pixel in decimal degrees |
| satellites | 1 | Number of satellite platforms contributing data to estimate |
| ndvi | 1 | Normalized Difference Vegetation Index (NDVI) [0 - 1.0] *10,000. Reported values are maximum NDVI during the composite time period. Valid range is [-0.03 to 1.0] *10,000. Values of -5000 indicate that NDVI could not computed for that pixel and time period |
| percentile | 1 | Percentile of NDVI value with an embedded quality flag. Value = percentile*10 + flag*2000. Percentile values [1-100]*10 represent the relative magnitude of NDVI for a pixel compared to the range of NDVI observed for that pixel over the 1982-2021 study period. Flag values: 0 = good value for NDVI with no apparent problems. 1 = NDVI from spline interpolation. 2 = NDVI from seasonal profile due to possible snow or cloud cover. 3 = missing value |
Application and Derivation
The Normalized Difference Vegetation Index (NDVI) derived from the Advanced Very High Resolution Radiometer (AVHRR) instruments has been crucial to study global vegetation dynamics and their spatio-temporal variation. The AVHRR dataset is a unique legacy dataset that possesses a long period of record (>40 years). The GIMMS-3g+ dataset enables analyses of vegetation dynamics over periods of time long enough to identify key drivers, including climatic drivers that are subject to low-frequency variation.
Quality Assessment
AVHRR observations were subject to a Bayesian calibration and correction procedure (Pinzon and Tucker, 2014).
A quality assurance flag is provided in the percentile variable to denote NDVI data from direct AVHRR observations with no apparent problems, estimated from spline interpolations, affected by snow or cloud cover and estimated from average seasonal profile, or missing due to low-quality AVHRR data.
Data Acquisition, Materials, and Methods
NDVI measurements were derived from daily observations from Advanced Very High Resolution Radiometer (AVHRR) instruments in the red and near-infrared wavelengths. The AVHRR instruments flew aboard polar-orbiting meteorological satellites managed by the National Oceanic and Atmospheric Association (NOAA, US) and Metop series satellites managed by European Organization for the Exploitation of Meteorological Satellites (EUMETSAT). AVHRR data were calibrated and corrected to reduce biases due to sensors, solar zenith angle, and certain atmospheric disturbances (e.g., erruption of Mt. Pinatubo); however atmospheric effects were not completely removed (Pinzon and Tucker, 2014).
The reported values are the maximum NDVI observed over 14-16 day composite sampling period. In general, the first period for each month covers day 1 to 15, and the second period covers day 16 to the end of the month.
Further details on methodology are available in Tucker et al. (2005) and Pinzon and Tucker (2014).
This version 1.1 includes three major fixes:
- Reprocessed Level 2 entire SeaWIFS mission for the land products to reduce artifacts in the data, particularly changes in calibration after 2006 that generates drops in NDVI lower values. OB.DAAC / Ocean Biology Processing group NASA/GSFC 616 (April 2016)
- Recovered NDVI negative values of snow-covered regions in winter Northern latitudes. In Version 0, these regions were masked with zero values, which created artifacts in phenology parameters.
- Adjusted profiles at coast lines and their respective time series when applying to missing values, similar to fix (2). This artifact was reported in Recuero et al. (2019).
Data Access
These data are available through the Oak Ridge National Laboratory (ORNL) Distributed Active Archive Center (DAAC).
Global Vegetation Greenness (NDVI) from AVHRR GIMMS-3G+, 1981-2022
Contact for Data Center Access Information:
- E-mail: uso@daac.ornl.gov
- Telephone: +1 (865) 241-3952
References
NASA Goddard Space Flight Center, Ocean Ecology Laboratory, Ocean Biology Processing Group. Sea-viewing Wide Field-of-view Sensor (SeaWiFS) Inherent Optical Properties Data; 2022 Reprocessing. NASA OB.DAAC, Greenbelt, Maryland, USA. https://doi.org/10.5067/ORBVIEW-2/SEAWIFS/L2/GAC/IOP/2022
Pinzon, J.E., and C.J. Tucker. 2014. A non-stationary 1981–2012 AVHRR NDVI3g time series. Remote Sensing 6:6929-6960. https://doi.org/10.3390/rs6086929
Recuero, L., J. Litago, J.E. Pinzón, M. Huesca, M.C. Moyano, and A. Palacios-Orueta. 2019. Mapping periodic patterns of global vegetation based on spectral analysis of NDVI time series. Remote Sensing 11:2497. https://doi.org/10.3390/rs11212497
Tucker, C.J., J.E. Pinzon, M.E. Brown, D.A. Slayback, E.W. Pak, R. Mahoney, E.F. Vermote, and N.E. Saleous. 2005. An extended AVHRR 8-km NDVI dataset compatible with MODIS and SPOT vegetation NDVI data. International Journal of Remote Sensing 26:4485-4498. https://doi.org/10.1080/01431160500168686