Documentation Revision Date: 2020-12-03
Dataset Version: 1
Summary
For deriving optimized LUE, FLUXNET data from the La Thuile FLUXNET synthesis database of 149 tower sites were used for model training and 54 tower sites from the more recent FLUXNET2015 global synthesis data record were used for independent model validation. The GIMMS3g FPAR data for grid cells collocated with the tower locations were temporally matched with the tower GPP records and optimized LUE for each site was estimated and then extrapolated to the global grid. GIMMS3g data were linearly interpolated to produce a continuous daily FPAR record for each 8 km global grid cell from 1982 to 2016 and used in the LUE model to produce the daily GPP estimates.
There is one data file in netCDF (*.nc4) format included with this dataset.
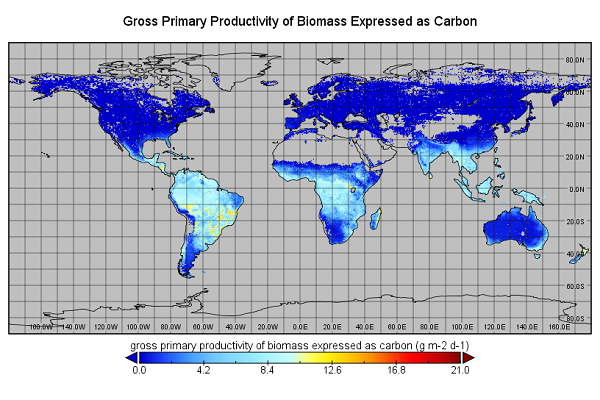
Figure 1. Global monthly gross primary productivity (GPP) of biomass for December 2016.
Citation
Madani, N., and N.C. Parazoo. 2020. Global Monthly GPP from an Improved Light Use Efficiency Model, 1982-2016. ORNL DAAC, Oak Ridge, Tennessee, USA. https://doi.org/10.3334/ORNLDAAC/1789
Table of Contents
- Dataset Overview
- Data Characteristics
- Application and Derivation
- Quality Assessment
- Data Acquisition, Materials, and Methods
- Data Access
- References
Dataset Overview
This dataset provides global monthly average gross primary productivity (GPP; g carbon/m2/d) modeled at 8 km spatial resolution for each of the 35 years from 1982-2016. GPP is based on the well-known Monteith light use efficiency (LUE) equation but was improved with optimized spatially and temporally explicit LUE values derived from selected FLUXNET tower site data. Optimized LUE was extrapolated to a consistent 8 km resolution global grid using multiple explanatory variables representing climatic, landscape, and vegetation factors influencing LUE and GPP. Global gridded long-term daily GPP was derived using the optimized LUE, Global Inventory Modeling and Mapping Studies (GIMMS3g) canopy fraction of photosynthetically active radiation (FPAR), and Modern-Era Retrospective analysis for Research and Applications, Version 2, (MERRA-2) meteorological information. These data will improve satellite-based estimation and understanding of GPP using a refined LUE model framework.
For deriving optimized LUE, FLUXNET data from the La Thuile FLUXNET synthesis database of 149 tower sites were used for model training and 54 tower sites from the more recent FLUXNET2015 global synthesis data record were used for independent model validation. The GIMMS3g FPAR data for grid cells collocated with the tower locations were temporally matched with the tower GPP records and optimized LUE for each site was estimated and then extrapolated to the global grid. GIMMS3g data were linearly interpolated to produce a continuous daily FPAR record for each 8 km global grid cell from 1982 to 2016 and used in the LUE model to produce the daily GPP estimates.
Related Publication
Madani, N., N.C. Parazoo, J.S. Kimball, A.P. Ballantyne, R.H Reichle, M. Maneta, S. Saatchi, P.I. Palmer, Z. Liu, T. Tagesson. 2020. Recent Amplified Global Gross Primary Productivity Due to Temperature Increase is offset by Reduced Productivity Due to Water Constraints. AGU Advances. 10.1029/2020AV000180
Madani, N, J.S. Kimball, and S.W. Running. 2017. Improving Global Gross Primary Productivity Estimates by Computing Optimum Light Use Efficiencies Using Flux Tower Data. JGR Biogeosciences, 122(11):2939-2951. https://doi.org/10.1002/2017JG004142
Acknowledgments
This work was supported by the Interdisciplinary Science Program (grant number 16-IDS16-0072).
Data Characteristics
Spatial Coverage: Global
Spatial Resolution: 0.083333333 deg (~8 km)
Temporal Coverage: 1982-01-01 to 2016-12-31
Temporal Resolution: Monthly average
Study Area: Latitude and longitude are given in decimal degrees.
| Sites | Westernmost Longitude | Easternmost Longitude | Northernmost Latitude | Southernmost Latitude |
|---|---|---|---|---|
| Global | -180 | 180 | 90 | -90 |
Data File Information
There is one data file with this dataset in netCDF (*.nc4) format: gross_primary_productivity_monthly_1982-2016.nc4.
Data File Details
missing data: -9999
CRS: EPSG:4326, proj4:+proj=longlat +ellps=WGS84 +datum=WGS84 +no_defs.
Table 1. Variable names and descriptions.
| Variable | Units | Description |
|---|---|---|
| GPP | g m-2 d-1 | Monthly average of gross primary productivity (GPP) of biomass for the years 1982-2016 expressed as carbon. |
Application and Derivation
The results of Madani et al. (2017) revealed large spatial variability in optimal LUE levels both within and among global biomes that are related to heterogeneous landscape and plant trait characteristics. LUEopt was defined across a global network of flux tower measurement sites representing major biome types and explained the observed LUEopt spatial variability using a set of predictor variables, including vegetation characteristics represented by a global land cover classification, satellite-based SIF observations, SLA from a global dataset of physical plant traits, and landscape characteristics represented by a digital terrain map. Global GPP was modeled using a light use efficiency (LUE) model and the new LUEopt map as a primary ancillary input. The approach used to derive the output LUEopt data can lead to better LUE model-based global GPP predictions and understanding.
Quality Assessment
Simulations to derive these data showed significant improvement over alternative GPP simulations derived using prescribed LUEmax constants for different biome types. The LUEopt modeled GPP also performed better than the LUEmax-GPP simulations for a set of independent global tower validation sites. Refer to Madani et al. (2017) for additional details.
Data Acquisition, Materials, and Methods
Global, long-term GPP data were created using GIMMS-3g FPAR and MERRA-2 meteorological information. GPP is based on the LUE concept but enhanced with optimized spatially and temporally explicit LUE values derived from FLUXNET tower data.
Flux Tower-based LUEopt Calculations
For flux tower-based LUEopt calculations, a global network of 149 tower sites from the La Thuile FLUXNET synthesis database (Baldocchi, 2008) and the more recent FLUXNET2015 (FLUXNET, 2015) global synthesis data record was used. Fifty-four tower sites from the FLUXNET2015 record were selected for model testing and the La Thuile tower data record was used for model training purposes. The tower eddy covariance CO2 flux measurement sites were selected for this on the basis of having at least one full year of gap-filled daily CO2 flux data and representing a broad range of global biomes.
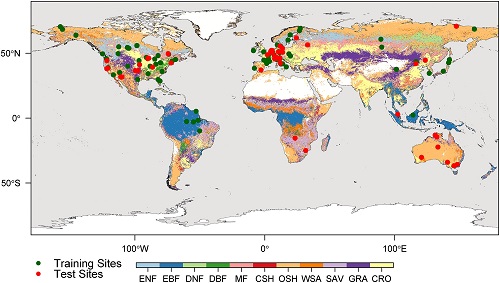
Figure 2. Location of global flux tower sites used for estimation of optimum light use efficiency (LUEopt). Tower sites are overlaid on a global land cover map (MODIS MCD12C1-Type2). The FLUXNET tower sites selected for this study include 95 training sites and 54 validation sites used for model LUEopt and GPP assessments. Source: Madani et al., 2017
The GIMMS3g bimonthly FPAR record (Zhu et al., 2013) and temporal linear interpolation of the bimonthly data were applied to produce a continuous daily FPAR record for each global grid cell over the 2000 to 2011 record. The FPAR data for grid cells collocated with selected tower site locations were temporally matched with the tower GPP records. LUEopt for each selected tower site was estimated by selecting the upper 98–99.5% bin of daily gap-filled GPP values throughout the available tower measurement years and using these values to represent the maximum daily GPP (GPPmax) from each tower site. It is assumed that at the upper bin of GPP, plant activity is not restricted by constraining climate factors. For all days with such criteria, LUE is defined as
 (1)
(1)
APAR is the product of FPAR defined from the GIMMS3g record and daily PAR, which is estimated as half of the global incoming shortwave solar radiation derived from the MERRA-2 global reanalysis (Bosilovich et al., 2015; Molod et al., 2015). For each of the tower sites, the tower-derived daily LUE observations were averaged falling in the upper GPP range (98–99.5%) from Equation 1 and these results were used to represent the LUEopt value of each site.
Extrapolating LUEopt from Point to Global Scale
Multiple explanatory variables derived from other ancillary data were used as proxies to represent potential landscape features and vegetation factors influencing LUEopt and GPP (Table 2).
Table 2. List of environmental variables chosen for extrapolating flux tower optimum light use efficiency (LUEopt) values over the global domain.
| Variable | Geophysical Data | Abbreviation | Source |
|---|---|---|---|
| Climate | Annual precipitation (mm) | Precip | Hijmans et al. (2005) |
| Annual temperature (°C) | Temp | ||
| Temperature of warmest quarter (°C) | Temp_WQ | ||
| Precipitation of warmest quarter (mm) | Precip_WQ | ||
| Average annual vapor pressure deficit (Pa) | VPD | Bosilovich et al. (2015) | |
| Average annual soil moisture (m3 m−3) | SM | ||
| Topography | Elevation (m) | DEM | Farr et al. (2007) |
| Topography wetness index | TWI | ||
| Plant traits | Specific leaf area (m2 kg−1) | SLA | Kattge et al. (2011); Madani et al. (2014) |
| Canopy height (m) | Height | ||
| Others | Solar-induced fluorescence (mW m−2 sr−1 nm−1) | SIF | Joiner et al. (2011, 2013) |
| Average annual fraction of photosynthetically active radiation | FPAR | Zhu et al. (2013) | |
| Land cover classification (MODIS MCD12C1-Type 2) | Land cover | Friedl et al. (2010) |
Variables used in the final linear mixed effect model for LUEopt extrapolation
The upper 95–98% quantile of SIF data were used as a proxy for LUEopt and SIFyield (emitted SIF per absorbed PAR). The nearest neighbor technique was used to resample all of the available data sets into a consistent 8 km resolution global grid as the GIMMS3g FPAR record. The Pearson correlation coefficient was used to select the variables with the highest predictive power and collinearity of less than 70% to build a linear mixed effect model.
For modeling LUEopt, the global tower sites were separated into two subsets for model training and testing purposes; the 95 tower training sites from the La Thuile record and testing using the 54 independent tower sites from the FLUXNET2015 database.
A limited number of tower sites were available for some land cover classes, and these classes were merged into coarser sets of needleleaf (evergreen needle leaf forest (ENF) + deciduous needle leaf forest (DNF)), shrubland (closed shrubland (CSH) + open shrubland (OSH)), and savanna (woody savannas (WSA) + savanna (SAV)) categories for regression analysis. All other classes were kept consistent with the underlying land cover map (Madani et al., 2017).
Modeling the Global Daily GPP
The bimonthly GIMMS3g FPAR data were linearly gap-filled to create a continuous global daily FPAR data record from 1982 to 2016. Meteorology data including daily minimum air temperature and incoming solar radiation were acquired from MERRA-2 global reanalysis (Bosilovich et al., 2015) and were used with the interpolated daily FPAR as primary LUE model inputs. The daily meteorology data were resampled from a native 0.5 × 0.65° spatial resolution to the same 8-km resolution global grid as the GIMMS3g FPAR inputs. The vapor pressure deficit was estimated using daily surface air temperature and dew point temperature, while daily GPP was modeled as
 (2)
(2)
where fVPD and fT represent dimensionless environmental constraint functions ranging between zero (fully constrained) and unity (no effect) that describe the reduction in LUE and GPP due to cold temperatures:
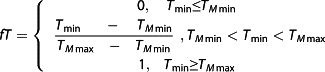 (3)
(3)
and excessive atmosphere moisture deficits:
 (4)
(4)
The Min and Max subscripts in equations 3 and 4 represent the minimum and maximum defined thresholds for minimum daily temperature (Tmin) and vapor pressure deficit (VPD) functions.
Refer to Madani et al. (2017) for additional information.
Data Access
These data are available through the Oak Ridge National Laboratory (ORNL) Distributed Active Archive Center (DAAC).
Global Monthly GPP from an Improved Light Use Efficiency Model, 1982-2016
Contact for Data Center Access Information:
- E-mail: uso@daac.ornl.gov
- Telephone: +1 (865) 241-3952
References
Baldocchi, D. 2008. Breathing of the terrestrial biosphere: Lessons learned from a global network of carbon dioxide flux measurement systems. Australian Journal of Botany, 56(1):1-26. https://doi.org/10.1071/BT07151
Bosilovich, M.G., R. Lucchesiand, and M. Suarez. 2015. MERRA-2: File Specification. GMAO Office Note No. 9 (Version 1.0) (p. 20,771). MD: Greenbelt.
Farr, T., P. Rosen, and E. Caro. 2007. The shuttle radar topography mission. Reviews of Geophysics, 45:RG2004. https://doi.org/10.1029/2005RG000183
FLUXNET. 2015. Release-Processing Pipeline. Fluxdata, The Data Portal Serving the FLUXNET Community. http://fluxnet.fluxdata.org/data/fluxnet2015-dataset/data-processing/
Friedl, M.A., D. Sulla-Menashe, B. Tan, A. Schneider, N. Ramankutty, A. Sibley, and X. Huang. 2010. MODIS Collection 5 global land cover: Algorithm refinements and characterization of new datasets. Remote Sensing of Environment, 114(1):168-182. https://doi.org/10.1016/j.rse.2009.08.016
Hijmans, R.J., S.E. Cameron, J.L. Parra, P.G. Jones, and A. Jarvis. 2005. Very high resolution interpolated climate surfaces for global land areas. International Journal of Climatology, 25(15):1965-1978. https://doi.org/10.1002/joc.1276
Joiner, J., L. Guanter, R. Lindstrot, M. Voigt, A.P. Vasilkov, E.M. Middleton, K.F. Huemmrich, Y. Yoshida, and C. Frankenberg. 2013. Global monitoring of terrestrial chlorophyll fluorescence from moderate-spectral-resolution near-infrared satellite measurements: methodology, simulations, and application to GOME-2. Atmospheric Measurement Techniques, 6:2803-2823. https://doi.org/10.5194/amt-6-2803-2013
Joiner, J., Y. Yoshida, A.P. Vasilkov, L.A. Corp, and E.M. Middleton. 2011. First observations of global and seasonal terrestrial chlorophyll fluorescence from space. Biogeosciences, 8(3):637-651. https://doi.org/10.5194/bg-8-637-2011
Kattge, J., S. Díaz, S. Lavorel, I.C. Prentice, P. Leadley, G. Bonisch, et al. 2011. TRY—A global database of plant traits. 2011. Global Change Biology, 17(9):2905-2935. https://doi.org/10.1111/j.1365-2486.2011.02451.x
Madani, N, J.S. Kimball, and S.W. Running. 2017. Improving Global Gross Primary Productivity Estimates by Computing Optimum Light Use Efficiencies Using Flux Tower Data. JGR Biogeosciences, 122(11):2939-2951. https://doi.org/10.1002/2017JG004142
Madani, N., J.S. Kimball, D.L.R. Affleck, J. Kattge, J. Graham, P.M. van Bodegom, P.B. Reich, and S.W. Running. 2014. Improving ecosystem productivity modeling through spatially explicit estimation of optimal light use efficiency. Journal of Geophysical Research: Biogeosciences, 119:1755-1769. https://doi.org/10.1002/2014JG002709
Zhu, Z., J. Bi, Y. Pan, S. Ganguly, A. Anav, L. Xu, A. Samanta, S. Piao, R.R. Nemani, and R.B. Myneni. 2013. Global data sets of vegetation leaf area index (LAI)3g and fraction of photosynthetically active radiation (FPAR)3g derived from Global Inventory Modeling and Mapping Studies (GIMMS) normalized difference vegetation index (NDVI3g) for the period 1981 to 2. Remote Sensing, 5(2):927-948. https://doi.org/10.3390/rs5020927