Documentation Revision Date: 2020-04-22
Dataset Version: 1
Summary
Aboveground living biomass carbon density includes carbon stored in living plant tissues located above the earth’s surface (stems, bark, branches, twigs). It does not include leaf litter or coarse woody debris that was once attached to living plants but have since been deposited and are no longer living. Belowground living biomass carbon density includes carbon stored in living plant tissues located below the earth’s surface (roots). This does not include dead and/or dislocated root tissue, nor does it include soil organic matter. Woody cover includes any vegetation whose biomass is primarily composed woody biomass (e.g. trees and shrubs). Herbaceous cover includes any vegetation whose biomass is primarily composed of leaf-like matter (e.g. grasses and many crops).
There are four data files in GeoTIFF (.tif) format with this dataset--maps of aboveground and belowground biomass carbon density and accumulated uncertainties.
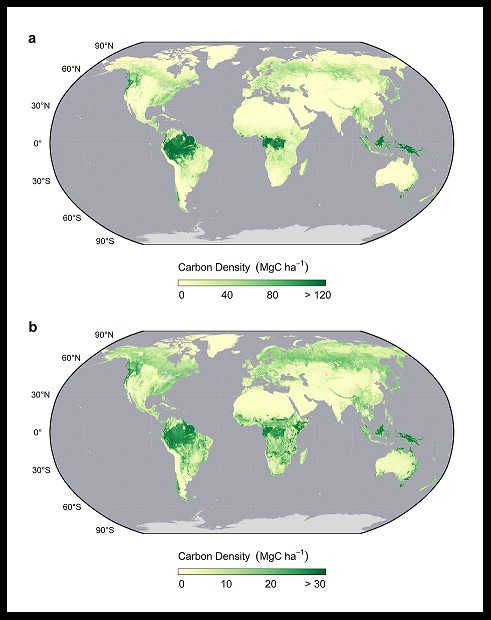
Figure 1. Global maps of above and belowground biomass carbon density. Upper figure is aboveground biomass carbon density and lower is belowground biomass carbon density. From Spawn et al. (In Review).
Citation
Spawn, S.A., and H.K. Gibbs. 2020. Global Aboveground and Belowground Biomass Carbon Density Maps for the Year 2010. ORNL DAAC, Oak Ridge, Tennessee, USA. https://doi.org/10.3334/ORNLDAAC/1763
Table of Contents
- Dataset Overview
- Data Characteristics
- Application and Derivation
- Quality Assessment
- Data Acquisition, Materials, and Methods
- Data Access
- References
Dataset Overview
This dataset provides temporally consistent and harmonized global maps of aboveground and belowground biomass carbon density for the year 2010 at a 300-m spatial resolution. The aboveground biomass map integrates land-cover specific, remotely sensed maps of woody, grassland, cropland, and tundra biomass. Input maps were amassed from the published literature and, where necessary, updated to cover the focal extent or time period. The belowground biomass map similarly integrates matching maps derived from each aboveground biomass map and land-cover specific empirical models. Aboveground and belowground maps were then integrated separately using ancillary maps of percent tree cover and landcover and a rule-based decision tree. Maps reporting the accumulated uncertainty of pixel-level estimates are also provided.
Aboveground living biomass carbon density includes carbon stored in living plant tissues located above the earth’s surface (stems, bark, branches, twigs). It does not include leaf litter or coarse woody debris that was once attached to living plants but have since been deposited and are no longer living. Belowground living biomass carbon density includes carbon stored in living plant tissues located below the earth’s surface (roots). This does not include dead and/or dislocated root tissue, nor does it include soil organic matter. Woody cover includes any vegetation whose biomass is primarily composed woody biomass (e.g. trees and shrubs). Herbaceous cover includes any vegetation whose biomass is primarily composed of leaf-like matter (e.g. grasses and many crops).
Related Publication:
Spawn, S.A., Sullivan, C.C., Lark, T.J. et al. Harmonized global maps of above and belowground biomass carbon density in the year 2010. Sci Data 7, 112 (2020). https://doi.org/10.1038/s41597-020-0444-4
Acknowledgement:
Funding for this project was generously provided by the David and Lucile Packard Foundation and the National Wildlife Federation.
Data Characteristics
Spatial Coverage: Global
Spatial Resolution: ~300 m (0.002777778 degree)
Temporal Coverage: 2010-01-01 to 2010-12-31
Temporal Resolution: Annual
Study Areas (All latitude and longitude given in decimal degrees)
| Sites | Westernmost Longitude | Easternmost Longitude | Northernmost Latitude | Southernmost Latitude |
|---|---|---|---|---|
| Global | -180 | 180 | 84 | -61.1 |
Data File Information
There are four data files in GeoTIFF (.tif) format with this dataset -- maps of aboveground and belowground biomass carbon density and accumulated uncertainties.
Table 1. File names and descriptions
| File name | Units | Description |
|---|---|---|
| aboveground_biomass_carbon_2010.tif | Mg C/ha | Aboveground living biomass carbon stock density of combined woody and herbaceous cover in 2010. This includes carbon stored in living plant tissues that are located above the earth’s surface (stems, bark, branches, twigs). This does not include leaf litter or coarse woody debris that were once attached to living plants but have since been deposited and are no longer living. |
| belowground_biomass_carbon_2010.tif | Mg C/ha | Belowground living biomass carbon stock density of combined woody and herbaceous cover in 2010. This includes carbon stored in living plant tissues that are located below the earth’s surface (roots). This does not include dead and/or dislocated root tissue, nor does it include soil organic matter. |
| aboveground_biomass_carbon_2010_uncertainty.tif | Mg C/ha | Uncertainty of estimated aboveground living biomass carbon density of combined woody and herbaceous cover in 2010. Uncertainty represents the cumulative standard error that has been propagated through the harmonization process using summation in quadrature. |
| belowground_biomass_carbon_2010_uncertainty.tif | Mg C/ha | Uncertainty of estimated belowground living biomass carbon density of combined woody and herbaceous cover in 2010. Uncertainty represents the cumulative standard error that has been propagated through the harmonization process using summation in quadrature. |
Properties of the GeoTIFFs
Bands: 1
Scaling: 0.1
Data units: Mg C/ha
Data type: UInt16
No data value: 65536
EPSG: 4326
Map units: degree
Resolution: ~300 m (0.002777778 degree)
Application and Derivation
Remotely sensed, biomass carbon density maps are widely used for myriad scientific and policy applications, but all remain limited in scope. They are often constrained to a single vegetation-type and rarely account for carbon stocks in belowground biomass. As such they may systematically overlook globally significant biomass carbon stocks. To date, no global product holistically derives and integrates temporally consistent remotely sensed estimates across different vegetation types at a scale appropriate for many modelling or decision-making applications.
These products are the first to temporally harmonize and integrate continental-to-global scale maps reporting vegetation-specific carbon density estimates. There are two separate maps: one reporting aboveground biomass carbon density and another reporting belowground biomass carbon density. Both uniquely represent biomass carbon in co-occurring woody and herbaceous vegetation in each grid cell. They were created using a novel method whereby we overlay vegetation-specific carbon density maps and proportionately allocate their estimates to each grid cell using ancillary maps of percent tree cover and landcover, and a rule-based decision tree. Also generated were accompanying uncertainty layers for both by propagating the error associated with each input layer, and the ancillary layers and models employed during the harmonization procedure (Spawn et al., In Review).
Quality Assessment
The maps with this dataset combine previously published maps of vegetation-specific aboveground biomass carbon density estimates, that were rigorously validated by their original producers. In cases where a map's spatial extent (i.e. tundra vegetation) or it's representative epoch did not meet the requirements (i.e. tundra vegetation, crops, grasses), the predictive model reported with each map was used to update its estimates accordingly using more expansive and/or contemporary satellite imagery, keeping track of introduced uncertainty.
Both woody biomass maps used to create our harmonized products were accompanied by pixel-level estimates of prediction uncertainty (standard error). For the remaining input maps that lacked such estimates, analogous uncertainty layers were generated by propagating the error of model coefficients or the relative root mean square error (RMSE) of prediction, as well as the temporal-variation associated with the imagery to which these models were applied, using summation in quadrature. When maps were subsequently integrated into a single holistic composite of total aboveground biomass carbon in coexisting woody and herbaceous vegetation types, the uncertainty of pixel-level predictions was similarly propagated using summation in quadrature such that the final uncertainty layer represents the cumulative uncertainty of pixel-level totals (Spawn et al., In Review).
Data Acquisition, Materials, and Methods
Aboveground Biomass
Continental-to-global scale aboveground biomass and carbon density maps were compiled from the published literature.
- Aboveground biomass of global trees was represented using the global map for 2010 of Santoro et al. (2018)
- Aboveground biomass estimates for African savannas, dry woodlands, and shrublands in 2010 were taken from Bouvet et al. (2018)
- Arctic tundra biomass estimates were derived by expanding the map of Berner et al. (2018) for the North Slope of Alaska to the circumpolar region using MODIS surface reflectance imagery circa 2010.
- Grassland aboveground biomass was mapped using a global model (Xia et al. 2014) using calibrated MODIS surface reflectance imagery circa 2010.
- Aboveground biomass for annual herbaceous crops was modeled as aboveground net primary productivity (NPP) from globally gridded crop yields in 2000 (Monfreda et al. 2008) using crop-specific parameters (Monfreda et al. 2008, Wolf et al. 2015), and calibrated to 2010 conditions using a time-series of MODIS derived NPP (Running et al. 2015).
Aboveground living biomass carbon density included carbon stored in living plant tissues located above the earth’s surface (stems, bark, branches, twigs). It does not include leaf litter or coarse woody debris that was once attached to living plants but have since been deposited and are no longer living. Belowground living biomass carbon density included carbon stored in living plant tissues located below the earth’s surface (roots). This does not include dead and/or dislocated root tissue, nor does it include soil organic matter. Woody cover included any vegetation whose biomass is primarily composed woody biomass (e.g. trees and shrubs). Herbaceous cover included any vegetation whose biomass is primarily composed of leaf-like matter (e.g. grasses and many crops).
In cases where these maps did not represent the epoch of interest (i.e. grasslands, tundra vegetation, croplands) or cover the necessary spatial extent (i.e. tundra vegetation), the model published with the original map was used to temporally update mapped estimates and/or extend them to the full focal extent. Grassland and tundra maps were updated by applying the underlying models to calibrated MODIS imagery circa 2010. The cropland biomass map was temporally updated using time-series of MODIS derived net primary productivity (Running et al., 2015). Finally, maps reporting biomass density rather than biomass carbon density were converted to units of carbon using biomass carbon concentrations reported by Martin et al. (2018). Maps were then aggregated to a 300 m spatial resolution as the area-weighted mean of contained grid cells (or, in the case of the cropland map, resampled using the bilinear method) to facilitate subsequent harmonization.
Belowground Biomass
Matching belowground biomass maps were then derived for each vegetation type.
- Belowground biomass of trees was modeled using a multiple regression model (Reich et al., 2014) that considers root-to-shoot covariance with aboveground biomass density, mean annual temperature, the stand’s regenerative origins (planted or natural), and the stand phylogeny (angiosperm or gymnosperm) and was applied spatially using ancillary maps of each covariate.
- The belowground biomass of woody shrublands and savannas were mapped separately using root-to-shoot ratios (Mokany et al., 2006).
- Tundra vegetation was modeled using a regression-based model considering root-to-shoot covariance with mean annual temperature (Wang et al., 2016).
- Grassland belowground biomass was mapped using root-to-shoot ratios (Mokany et al., 2006) specific to broad climatic regions (Kottek et al. 2006).
- Cropland belowground biomass was similarly mapped using crop-specific root-to-shoot ratios (Monfreda et al., 2008, Wolf et al., 2015)
Map Processing
Above and belowground biomass maps were then integrated into comprehensive composites, separately, using the same general approach. In each case, vegetation specific biomass carbon maps were overlaid, and their predictions allocated to each grid cell of the final product in proportion to the relative extent of woody and herbaceous cover in each cell as determined using ancillary maps of percent tree cover and landcover, and a rule-based decision tree. This ensures that the map’s estimates account for the biomass in both the primary and secondary vegetation cover of every grid cell and makes them more holistic than any other comparable map.
This general procedure was not used, though, in the tundra biome since the tundra vegetation map already accounts for the contributions of both woody and co-occurring herbaceous vegetation.
Throughout the entire harmonization process, the error from each input layer was tracked. Estimated uncertainty thus represents the accumulated uncertainty of each grid cell’s biomass estimate.
Data Access
These data are available through the Oak Ridge National Laboratory (ORNL) Distributed Active Archive Center (DAAC).
Global Aboveground and Belowground Biomass Carbon Density Maps for the Year 2010
Contact for Data Center Access Information:
- E-mail: uso@daac.ornl.gov
- Telephone: +1 (865) 241-3952
References
Berner, L. T., Jantz, P., Tape, K. D. & Goetz, S. J. Tundra plant above-ground biomass and shrub dominance mapped across the North Slope of Alaska. Environ. Res. Lett. 13, 035002 (2018). https://doi.org/10.1088/1748-9326/aaaa9a
Bouvet, A. et al. An above-ground biomass map of African savannahs and woodlands at 25m resolution derived from ALOS PALSAR. Remote Sens. Environ. 206, 156–173 (2018). https://doi.org/10.1016/j.rse.2017.12.030
Kottek, M., J. Grieser, C. Beck, B. Rudolf, & F. Rubel. World Map of the Köppen-Geiger climate classification updated. Meteorol. Z. 15, 259–263. (2006). doi:10.1127/0941-2948/2006/0130.
Martin, A.R., M. Doraisami, & S.C. Thomas. Global patterns in wood carbon concentration across the world’s trees and forests. Nat. Geosci. 11, 915 (2018). https://doi.org/10.1038/s41561-018-0246-x.
Mokany, K., R.J. Raison, A.S.& Prokushkin. Critical analysis of root: shoot ratios in terrestrial biomes. Glob. Change Biol. 12, 84–96 (2006). https://doi.org/10.1111/j.1365-2486.2005.001043.x.
Monfreda, C., N. Ramankutty, & J.A. Foley. Farming the planet: 2. Geographic distribution of crop areas, yields, physiological types, and net primary production in the year 2000. Glob. Biogeochem. Cycles 22, (2008). https://doi.org/10.1029/2007GB002947.
Reich, P. B. et al. Temperature drives global patterns in forest biomass distribution in leaves, stems, and roots. Proc. Natl. Acad. Sci. 111, 13721–13726 (2014) doi:10.1073/pnas.1216053111.
Running, S.W., Q. Mu,& M.Zhao. MOD17A3H MODIS/Terra Net Primary Production Yearly L4 Global 1km SIN Grid V055 [Data set]. NASA EOSDIS Land Process. DAAC (2015). https://doi.org/10.5067/MODIS/MOD17A3H.006.
Santoro, M. et al. GlobBiomass global above-ground biomass and growing stock volume datasets. (2018) doi:10.1594/PANGAEA.894711.
Spawn, S.A., Sullivan, C.C., Lark, T.J. et al. Harmonized global maps of above and belowground biomass carbon density in the year 2010. Sci Data 7, 112 (2020). https://doi.org/10.1038/s41597-020-0444-4
Wang, P., M.M.P.D. Hijmans, L. Mommer, J. vanRuijven, T.C. Maximov, and F. Berendse. Belowground plant biomass allocation in tundra ecosystems and its relationship with temperature. Environ. Res. Lett. 11, 055003 (2016). https://doi.org/10.1088/1748-9326/11/5/055003.
Wolf, J. T.O. West, Y. LePage, G.P. Kyle, X. Zhang, G.J. Collatz, and M.L. Imhoff. Biogenic carbon fluxes from global agricultural production and consumption. Glob. Biogeochem. Cycles 29, 2015GB005119 (2015). https://doi.org/10.1002/2015GB005119.
Xia, J. et al. Spatio-Temporal Patterns and Climate Variables Controlling of Biomass Carbon Stock of Global Grassland Ecosystems from 1982 to 2006. Remote Sens. 6, 1783–1802 (2014). https://doi.org/10.3390/rs6031783