A Global Database of Litterfall Mass and Litter Pool Carbon and Nutrients
Get Data
Revision Date: March 30, 2015
Summary:
Measurement data of aboveground litterfall and littermass and litter carbon, nitrogen, and nutrient concentrations were extracted from 685 original literature sources and compiled into a comprehensive database to support the analysis of global patterns of carbon and nutrients in litterfall and litter pools. Data are included from sources dating from 1827 to 1997.
The reported data include the literature reference, general site information (description, latitude, longitude, and elevation), site climate data (mean annual temperature and precipitation), site vegetation characteristics (management, stand age, ecosystem and vegetation-type codes), annual quantities of litterfall (by class, kg m-2 yr-1), litter pool mass (by class and litter layer, kg m-2), and concentrations of nitrogen (N), phosphorus (P), and base cations for the litterfall (g m-2 yr-1) and litter pool components (g m-2).
The investigators intent was to compile a comprehensive data set of individual direct field measurements as reported by researchers. While the primary emphasis was on acquiring C data, measurements of N, P, and base cations were also obtained, although the database is sparse for elements other than C and N.
Note that litterfall and litter pool masses (as dry matter) were not converted to carbon. This conversion fraction (~0.5 by mass) can vary and so the data compilers did not convert the reported measurements so that others using the database can choose appropriate conversion factors.
Each of the 1,497 records in the database represents a measurement site. Replicate measurements were averaged according to conventions described in Section 5 and recorded for each site in the database. The sites were at 575 different locations.
The database is provided in a single comma delimited (.csv) format file. A Shapefile with litterfall and littermass, and selected nutrient data is also provided. Companion files include the bibliographic sources for the data provided, in both ASCII text (.txt) file and as a .pdf file, and a .pdf file with the definitions for Olson Ecosystem, Holdridge Life Zone, and Matthews vegetation type codes.
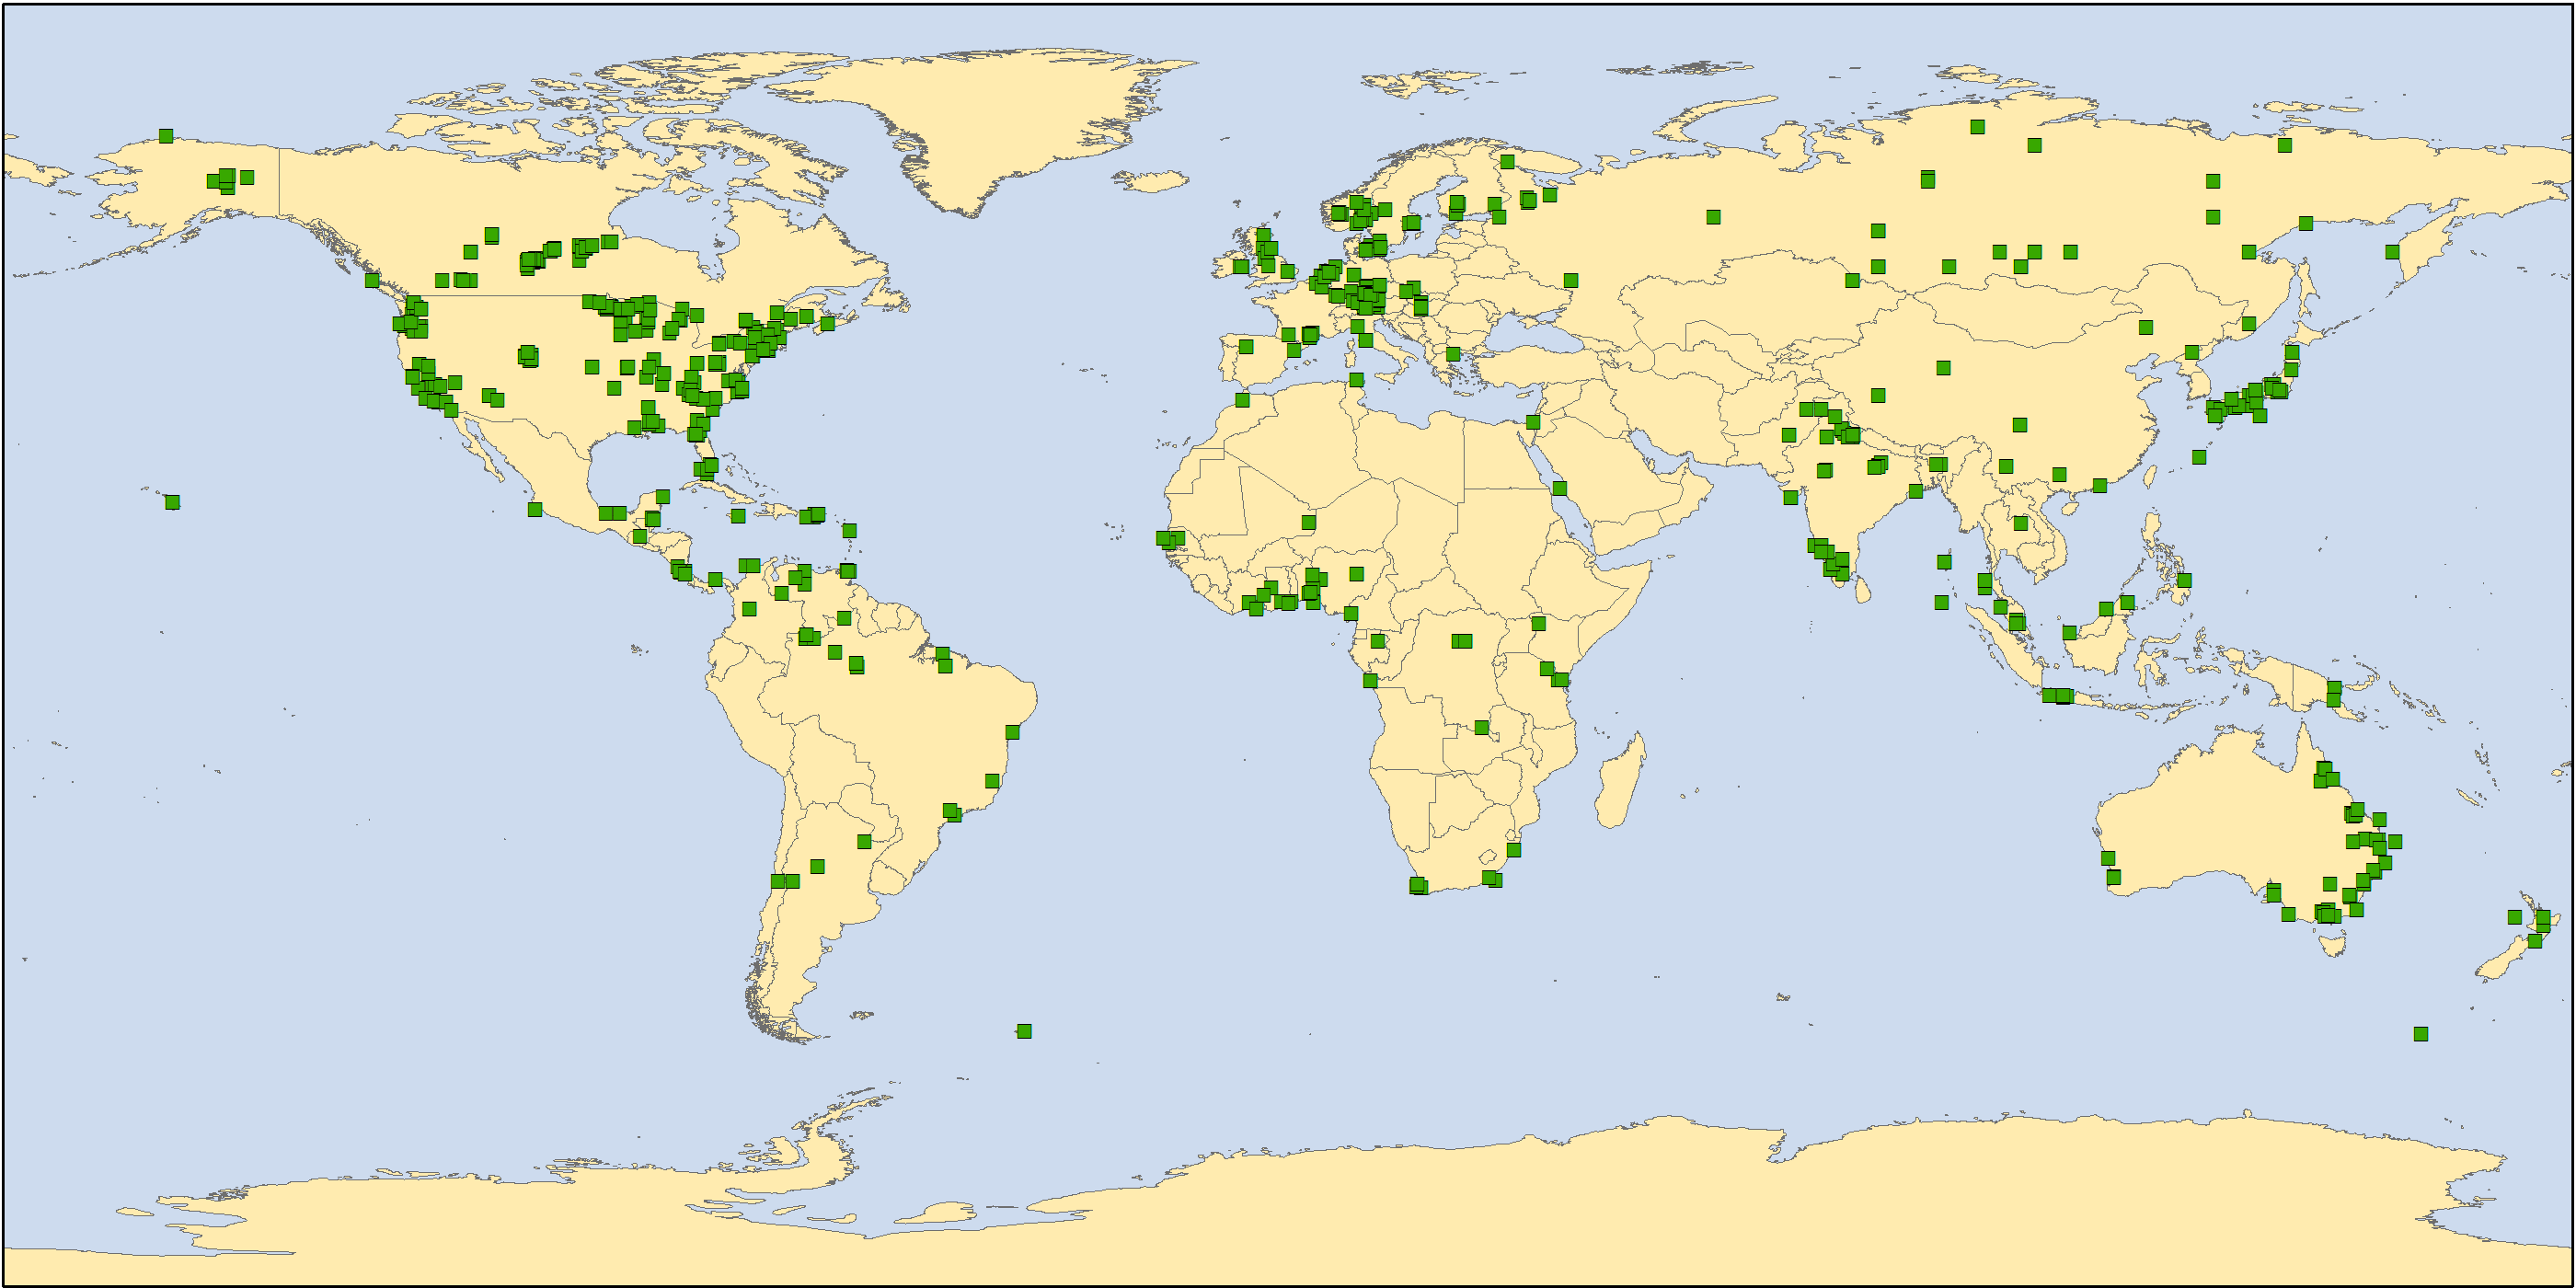
Figure 1. Global distribution of the 575 sites in the database.
Acknowledgments:
This data collection started with a sabbatical visit in 1987 by W.M. Post to Dr. Paul Zinke’s laboratory at the University of California, Berkeley. Dr. Zinke’s collection of reference materials and those in the UC Berkeley Forestry Library provided a wealth of worldwide data from forestry reports and international literature sources. Additional support for assembling more recently published data was supported by NASA with funding from the ORNL DAAC to Elizabeth Holland, James Sulzman, and Robbie Staufer working at NCAR. A large collection of Russian data was contributed by Olga Krankina. Data published after 1997 are not included in this database.
Data and Documentation Access:
Get Data: http://daac.ornl.gov/cgi-bin/dsviewer.pl?ds_id=1244
Companion Files:
1) The bibliographic sources for the data are provided in ASCII text format, Litterfall_source_bibliography.txt and as Litterfall_source_bibliography.pdf file.
2) The Litterfall_code_companion.pdf file provides the definitions for Olson Ecosystem, Holdridge Life Zone, and Matthews vegetation type codes.
Data Citation:
Cite this data set as follows:
Holland, E. A., W. M. Post, E. Matthews, J. Sulzman, R. Staufer, and O. Krankina. 2015. A Global Database of Litterfall Mass and Litter Pool Carbon and Nutrients. Data set. Available on-line [http://daac.ornl.gov] from Oak Ridge National Laboratory Distributed Active Archive Center, Oak Ridge, Tennessee, USA. http://dx.doi.org/10.3334/ORNLDAAC/1244
Previous Version Note: The metadata and documentation for this product were previously available from the ORNL DAAC as:
Holland, E. A., W. M. Post, E. Matthews, J. Sulzman, R. Staufer, and O. Krankina. 2005. Global Patterns of Litterfall and Litter Pool Carbon and Nutrients. Data set. Available on-line [http://daac.ornl.gov/] from Oak Ridge National Laboratory Distributed Active Archive Center, Oak Ridge, Tennessee, U.S.A.
Previously, the data were only available upon request from W.M. Post.
The ORNL DAAC reviewed the site and location data before posting the files on-line. One duplicate site and four locations were corrected (e.g., positive longitudes changed to negative). Documentation was updated to reflect the latest description of SITE_ID (formerly ID) and row uniqueness.
Table of Contents:
- 1 Data Set Overview
- 2 Data Characteristics
- 3 Applications and Derivation
- 4 Quality Assessment
- 5 Acquisition Materials and Methods
- 6 Data Access
- 7 References
1. Data Set Overview:
Measurement data of aboveground litterfall and littermass and litter carbon, nitrogen, and nutrient concentrations were extracted from 685 original literature sources and compiled into a comprehensive database to support the analysis of global patterns of carbon and nutrients in litterfall and litter pools. Data are included from sources dating from 1827 to 1997.
The reported data include the literature reference, general site information (description, latitude, longitude, and elevation), site climate data (mean annual temperature and precipitation), site vegetation characteristics (management, stand age, ecosystem and vegetation-type codes), annual quantities of litterfall (by class, kg m-2 yr-1), litter pool mass (by class and litter layer, kg m-2), and concentrations of nitrogen (N), phosphorus (P), and base cations for the litterfall (g m-2 yr-1) and litter pool components (g m-2).
Note that litterfall and litter pool masses (as dry matter) were not converted to carbon. This conversion fraction (~0.5 by mass) can vary and so the data compilers did not convert the reported measurements so that others using the data base can choose appropriate conversion factors.
The investigators intent was to compile a comprehensive data set of individual direct field measurements as reported by researchers. While the primary emphasis was on acquiring C data, measurements of N, P, and base cations were also obtained, although the database is sparse for elements other than C and N.
Each of the 1,497 records in the database represents a measurement site. Replicate measurements were averaged according to conventions described in Section 5 and recorded for each site in the database. The sites were at 575 different locations.
2. Data Characteristics:
Spatial Coverage
There is a generally global distribution of the 575 sites included in the database.
Temporal Coverage
The data are from published studies between 1827-01-01 and 1997-12-31
Site boundaries: (All latitude and longitude given in decimal degrees)
| Site (Region) | Westernmost Longitude | Easternmost Longitude | Northernmost Latitude | Southernmost Latitude |
|---|---|---|---|---|
| Global | -156.7 | 176.2 | 72.5 | -54.5 |
Data File Information
There is one comma separated (.csv) data file and one Shapefile provided with this data set. Missing numeric and text values are represented by -99.
File: Global_Litterfall.csv
What columns uniquely define a row?
- Note that SITE_ID alone does not uniquely define a data row. SITE_ID values are not unique.
- The combinations of (1) SITE_ID and REFERENCE1 or (2) SITE_ID with LATITUDE and LONGITUDE do uniquely identify a row.
The provided file is sorted by SITE_ID and REFERENCE1.
Why do some columns contain only missing values?
The investigators intent was to compile a comprehensive data set of individual direct field measurements as reported by researchers. While the primary emphasis was on acquiring C data, measurements of N, P, and other base cations were also sought, but not always obtained. The blank cells and columns indicate that the reference sources were reviewed for these measurements but no measurements were reported. Therefore, the database is sparse for elements other than C and N. The table below includes two columns that show the completeness of each reported data column.
File: Global_Litterfall.zip
When unzipped, this shapefile contains six files (*.shx, *.dbf, *.prj, *.sbn, *.sbx, and *.shp). Due to shape file volume constraints, the columns Reference and Reference2 were omitted and the sets of columns for Mn, Na, and K concentration were also omitted.
Parameters of the shapefile:
Geometry Type: Point
Geographic Coordinate System: GCS_WGS_1984
Datum: D_WGS_1984
Prime Meridian: Greenwich
Angular Unit: Degree
Extent-
North: 72
South: -54
East: 176
West: -157
Attributes are defined in the following description table.
Table 1. Data file description
| Column Number | Column Heading | Column Name | Units | Notes | Number of non-missing values. 1,497 records. | Percent completeness |
|---|---|---|---|---|---|---|
| Site Information Fields ( 0 – 15 ) | Missing data code: -99 | |||||
| 0 | SITE_ID | SITE_ID | 5-7 digit code | Digits 1-3 identify the source publication and digits 4-7 represent different sites for which measurements are reported. Sites defined as “0000” indicate that data are reported for only one site. SITE_ID values are not unique. | 1,497 | 100 |
| 1 | PLOTNAME | PLOTNAME | General description of the measurement location, such as country, state, and/or region. | 1,497 | 100 | |
| 2 | LATITUDE | LATITUDE | Decimal degrees | If exact longitude and latitude are not given in the data source, we used descriptions of the site, together with detailed maps, to estimate the longitude and latitude of the site. | 1,497 | 100 |
| 3 | LONGITUDE | LONGITUDE | Decimal degrees | If exact longitude and latitude are not given in the data source, we used descriptions of the site, together with detailed maps, to estimate the longitude and latitude of the site. | 1,497 | 100 |
| 4 | ELEVATION | ELEVATION | m | Elevation in meters as reported in the data source. | 1,497 | 100 |
| 5 | MEANTEMP | MEANTEMP | degrees C | Mean annual temperature was recorded if reported. Otherwise, we used nearest weather station data to estimate MAT for the site. | 1,497 | 100 |
| 6 | BIOTEMP | BIOTEMPERATURE | degrees C | Biotemperature is the annual mean unit-period temperature with substitution of zero for all temperature values below 0 degrees C and above 30 degrees C. | 55 | 3.7 |
| 7 | PRECIP | PRECIPITATION | mm | If precipitation was not reported, we used a climate atlas to estimate precipitation. | 1,497 | 100 |
| 8 | OLSON | OLSON CODE | Olson | Olson Ecosystem codes, 0-99. See code companion file for definitions. | 810 | 54.2 |
| 9 | LIFEZONE | LIFEZONE | numeric | Holdridge Life Zone Codes, 0-37. See code companion file for definitions. | 1,497 | 100 |
| 10 | MATTHEWS | MATTHEWS CODE | numeric | Matthews vegetation type code, 1-32. See code companion file for definitions. | 1,497 | 100 |
| 11 | VEGETATION | VEGETATION | text | Based on the source document, we recorded dominant species, lifeforms, physiognomic descriptions, environmental conditions. | 1494 | 99.8 |
| 12 | MANAGED | MANAGED CODE | text | Code: Yes (Y); No (N). A site was considered unmanaged if relatively undisturbed at the time measurements were made and managed if strongly influenced by humans. | 789 | 52.8 |
| 13 | AGE | PLOT AGE | years | If stand is not known to be disturbed then “mature” was assigned. | 925 | 61.8 |
| 14 | REFERENCE1 | REFERENCE1 | text | Short citation (Author, year, publication, volume, pages) of source publications. See Litterfall_source_bibliography companion file (In combination with SITE_ID, uniquely identifies a data row) | 1,497 | 100 |
| 15 | REFERENCE2 | REFERENCE2 | text | Short citation (Author, year, publication, volume, pages) of source publications. See Litterfall_source_bibliography companion file. | 188 | 12.6 |
| Column Number | Column Heading | Column Name | Number of non-missing values. 1,497 records | Percent completeness |
|---|---|---|---|---|
| Litter Data Fields ( 16 – 191 ) Missing data code: -99 | ||||
| Litterfall: Units are in kg m-2 yr-1 | ||||
| 16 | LFLLW | LEAF_FALL | 670 | 44.8 |
| 17 | SWFLLW | SMALL_WOOD_FALL | 401 | 26.8 |
| 18 | FINFLLW | LEAF_AND_SMALL_WOOD_FALL | 134 | |
| 19 | RPRFLLW | REPRODUCTIVE_FALL | 302 | 20.2 |
| 20 | LTRFLLW | TOTAL_FINE_LITTER_FALL | 650 | 43.5 |
| 21 | LWFLLW | LARGE_WOOD_FALL | 72 | 4.9 |
| Litter Pool Masses: Units are in kg m-2 | ||||
| 22 | LLEAFW | L_LEAF_WEIGHT | 83 | 5.6 |
| 2.7 | LSWW | L_SMALL_WOOD_WEIGHT | 39 | 2.7 |
| 24 | LFINW | L_FINE_WEIGHT | 1 | 0.1 |
| 25 | LRPRW | L_REPRODUCTIVE_WEIGHT | 38 | 2.6 |
| 26 | LLTRW | L_LITTER_WEIGHT | 66 | 4.5 |
| 27 | FLEAFW | F_AND_H_LEAF_WEIGHT | 51 | 3.5 |
| 28 | FSWW | F_AND_H_SMALL_WOOD_WEIGHT | 8 | 0.6 |
| 29 | FFINW | F_AND_H_FINE_WEIGHT | 26 | 1.8 |
| 30 | FRPRW | F_AND_H_REPRODUCTIVE_WEIGHT | 8 | 0.6 |
| 31 | FLTRW | F_AND_H_LITTER_WEIGHT | 94 | 6.3 |
| 32 | TLEAFW | TOTAL_LEAF_WEIGHT | 142 | 9.5 |
| 33 | TSWW | TOTAL_SMALL_WOOD_WEIGHT | 151 | 10.1 |
| 34 | TFINW | TOTAL_FINE_WEIGHT | 121 | 8.1 |
| 35 | TRPRW | TOTAL_REPRODUCTIVE_WEIGHT | 27 | 1.9 |
| 36 | TLTRW | TOTAL_LITTER_WEIGHT | 467 | 31.2 |
| 37 | LWW | LARGE_WOOD_WEIGHT | 164 | 11 |
| Litterfall N: Units are in g m-2 yr-1 | ||||
| 38 | LFLLN | LEAF_FALL_N | 222 | 14.9 |
| 39 | SWFLLN | SMALL_WOOD_FALL_N | 122 | 8.2 |
| 40 | FINFLLN | FINE_FALL_N | 36 | 2.5 |
| 41 | RPRFLLN | REPRODUCTIVE_FALL_N | 68 | 4.6 |
| 42 | LTRFLLN | LITTER_FALL_N | 335 | 22.4 |
| 43 | LWFLLN | LARGE_WOOD_FALL_N | 39 | 2.7 |
| Litter Pool N: Units are in g m-2 | ||||
| 44 | LLEAFN | L_LEAF_N | 4 | 0.3 |
| 45 | LSWN | L_SMALL_WOOD_N | 1 | 0.1 |
| 46 | LFINN | L_FINE_N | 2 | 0.2 |
| 47 | LRPRN | L_REPRODUCTIVE_N | 2 | 0.2 |
| 48 | LLTRN | L_LITTER_N | 43 | 2.9 |
| 49 | FLEAFN | F_AND_H_LEAF_N | 2 | 0.2 |
| 50 | FSWN | F_AND_H_SMALL_WOOD_N | 1 | 0.1 |
| 51 | FFINN | F_AND_H_FINE_N | 1 | 0.1 |
| 52 | FRPRN | F_AND_H_REPRODUCTIVE_N | 1 | 0.1 |
| 53 | FLTRN | F_AND_H_LITTER_N | 49 | 3.3 |
| 54 | TLEAFN | TOTAL_LEAF_N | 36 | 2.5 |
| 55 | TSWN | TOTAL_SMALL_WOOD_N | 28 | 1.9 |
| 56 | TFINN | TOTAL_FINE_N | 5 | 0.4 |
| 57 | TRPRN | TOTAL_REPRODUCTIVE_N | 21 | 1.5 |
| 58 | TLTRN | TOTAL_LITTER_N | 220 | 14.7 |
| 59 | LWN | LARGE_WOOD_N | 30 | 2.1 |
| Litterfall P: Units are in g m-2 yr-1 | ||||
| 60 | LFLLP | LEAF_FALL_P | 180 | 12.1 |
| 61 | SWFLLP | SMALL_WOOD_FALL_P | 98 | 6.6 |
| 62 | FINFLLP | FINE_FALL_P | 40 | 2.7 |
| 63 | RPRFLLP | REPRODUCTIVE_FALL_P | 59 | 4 |
| 64 | LTRFLLP | LITTER_FALL_P | 308 | 20.6 |
| 65 | LWFLLP | LARGE_WOOD_FALL_P | 21 | 1.5 |
| Litter Pool P: Units are in g m-2 | ||||
| 66 | LLEAFP | L_LEAF_P | 3 | 0.3 |
| 67 | LSWP | L_SMALL_WOOD_P | 1 | 0.1 |
| 68 | LFINP | L_FINE_P | 2 | 0.2 |
| 69 | LRPRP | L_REPRODUCTIVE_P | 2 | 0.2 |
| 70 | LLTRP | L_LITTER_P | 32 | 2.2 |
| 71 | FLEAFP | F_AND_H_LEAF_P | 2 | 0.2 |
| 72 | FSWP | F_AND_H_SMALL_WOOD_P | 1 | 0.1 |
| 73 | FFINP | F_AND_H_FINE_P | 1 | 0.1 |
| 74 | FRPRP | F_AND_H_REPRODUCTIVE_P | 1 | 0.1 |
| 75 | FLTRP | F_AND_H_LITTER_P | 39 | 2.7 |
| 76 | TLEAFP | TOTAL_LEAF_P | 72 | 4.9 |
| 77 | TSWP | TOTAL_SMALL_WOOD_P | 27 | 1.9 |
| 78 | TFINP | TOTAL_FINE_P | 4 | 0.3 |
| 79 | TRPRP | TOTAL_REPRODUCTIVE_P | 19 | 1.3 |
| 80 | TLTRP | TOTAL_LITTER_P | 175 | 11.7 |
| 81 | LWP | LARGE_WOOD_P | 31 | 2.1 |
| Litterfall Ca: Units are in g m-2 yr-1 | ||||
| 82 | LFLLCA | LEAF_FALL_CA | 153 | 10.3 |
| 83 | SWFLLCA | SMALL_WOOD_FALL_CA | 80 | 5.4 |
| 84 | FINFLLCA | FINE_FALL_CA | 36 | 2.5 |
| 85 | RPRFLLCA | REPRODUCTIVE_FALL_CA | 51 | 3.5 |
| 86 | LTRFLLCA | LITTER_FALL_CA | 282 | 18.9 |
| 87 | LWFLLCA | LARGE_WOOD_FALL_CA | 21 | 1.5 |
| Litter Pool Ca: Units are in g m-2 | ||||
| 88 | LLEAFCA | L_LEAF_CA | 2 | 0.2 |
| 89 | LSWCA | L_SMALL_WOOD_CA | 1 | 0.1 |
| 90 | LFINCA | L_FINE_CA | 2 | 0.2 |
| 91 | LRPRCA | L_REPRODUCTIVE_CA | 2 | 0.2 |
| 92 | LLTRCA | L_LITTER_CA | 37 | 2.5 |
| 93 | FLEAFCA | F_AND_H_LEAF_CA | 2 | 0.2 |
| 94 | FSWCA | F_AND_H_SMALL_WOOD_CA | 1 | 0.1 |
| 95 | FFINCA | F_AND_H_FINE_CA | 1 | 0.1 |
| 96 | FRPRCA | F_AND_H_REPRODUCTIVE_CA | 1 | 0.1 |
| 97 | FLTRCA | F_AND_H_LITTER_CA | 43 | 2.9 |
| 98 | TLEAFCA | TOTAL_LEAF_CA | 64 | 4.3 |
| 99 | TSWCA | TOTAL_SMALL_WOOD_CA | 20 | 1.4 |
| 100 | TFINCA | TOTAL_FINE_CA | 8 | 0.6 |
| 101 | TRPRCA | TOTAL_REPRODUCTIVE_CA | 19 | 1.3 |
| 102 | TLTRCA | TOTAL_LITTER_CA | 171 | 11.5 |
| 103 | LWCA | LARGE_WOOD_CA | 21 | 1.5 |
| Litterfall Mg: Units are in g m-2 yr-1 | ||||
| 104 | LFLLMG | LEAF_FALL_MG | 131 | 8.8 |
| 105 | SWFLLMG | SMALL_WOOD_FALL_MG | 66 | 4.5 |
| 106 | FINFLLMG | FINE_FALL_MG | 29 | 2 |
| 107 | RPRFLLMG | REPRODUCTIVE_FALL_MG | 45 | 3.1 |
| 108 | LTRFLLMG | LITTER_FALL_MG | 258 | 17.3 |
| 109 | LWFLLMG | LARGE_WOOD_FALL_MG | 21 | 1.5 |
| Litter Pool Mg: Units are in g m-2 | ||||
| 110 | LLEAFMG | L_LEAF_MG | 2 | 0.2 |
| 111 | LSWMG | L_SMALL_WOOD_MG | 1 | 0.1 |
| 112 | LFINMG | L_FINE_MG | 2 | 0.2 |
| 113 | LRPRMG | L_REPRODUCTIVE_MG | 2 | 0.2 |
| 114 | LLTRMG | L_LITTER_MG | 31 | 2.1 |
| 115 | FLEAFMG | F_AND_H_LEAF_MG | 2 | 0.2 |
| 116 | FSWMG | F_AND_H_SMALL_WOOD_MG | 1 | 0.1 |
| 117 | FFINMG | F_AND_H_FINE_MG | 1 | 0.1 |
| 118 | FRPRMG | F_AND_H_REPRODUCTIVE_MG | 1 | 0.1 |
| 119 | FLTRMG | F_AND_H_LITTER_MG | 38 | 2.6 |
| 120 | TLEAFMG | TOTAL_LEAF_MG | 63 | 4.3 |
| 121 | TSWMG | TOTAL_SMALL_WOOD_MG | 20 | 1.4 |
| 122 | TFINMG | TOTAL_FINE_MG | 8 | 0.6 |
| 123 | TRPRMG | TOTAL_REPRODUCTIVE_MG | 19 | 1.3 |
| 124 | TLTRMG | TOTAL_LITTER_MG | 141 | 9.5 |
| 125 | LWMG | LARGE_WOOD_MG | 20 | 1.4 |
| Litterfall K: Units are in g m-2 yr-1 | ||||
| 126 | LFLLK | LEAF_FALL_K | 145 | 9.7 |
| 127 | SWFLLK | SMALL_WOOD_FALL_K | 84 | 5.7 |
| 128 | FINFLLK | FINE_FALL_K | 37 | 2.5 |
| 129 | RPRFLLK | REPRODUCTIVE_FALL_K | 54 | 3.7 |
| 130 | LTRFLLK | LITTER_FALL_K | 283 | 19 |
| 131 | LWFLLK | LARGE_WOOD_FALL_K | 21 | 1.5 |
| Litter Pool K: Units are in g m-2 | ||||
| 132 | LLEAFK | L_LEAF_K | 4 | 0.3 |
| 133 | LSWK | L_SMALL_WOOD_K | 1 | 0.1 |
| 134 | LFINK | L_FINE_K | 2 | 0.2 |
| 135 | LRPRK | L_REPRODUCTIVE_K | 2 | 0.2 |
| 136 | LLTRK | L_LITTER_K | 28 | 1.9 |
| 137 | FLEAFK | F_AND_H_LEAF_K | 2 | 0.2 |
| 138 | FSWK | F_AND_H_SMALL_WOOD_K | 1 | 0.1 |
| 139 | FFINK | F_AND_H_FINE_K | 1 | 0.1 |
| 140 | FRPRK | F_AND_H_REPRODUCTIVE_K | 1 | 0.1 |
| 141 | FLTRK | F_AND_H_LITTER_K | 35 | 2.4 |
| 142 | TLEAFK | TOTAL_LEAF_K | 63 | 4.3 |
| 143 | TSWK | TOTAL_SMALL_WOOD_K | 20 | 1.4 |
| 144 | TFINK | TOTAL_FINE_K | 8 | 0.6 |
| 145 | TRPRK | TOTAL_REPRODUCTIVE_K | 19 | 1.3 |
| 146 | TLTRK | TOTAL_LITTER_K | 160 | 10.7 |
| 147 | LWK | LARGE_WOOD_K | 24 | 1.7 |
| Litterfall Na: Units are in g m-2 yr-1 | ||||
| 148 | LFLLNA | LEAF_FALL_NA | 42 | 2.9 |
| 149 | SWFLLNA | SMALL_WOOD_FALL_NA | 22 | 1.5 |
| 150 | FINFLLNA | FINE_FALL_NA | 11 | 0.8 |
| 151 | RPRFLLNA | REPRODUCTIVE_FALL_NA | 12 | 0.9 |
| 152 | LTRFLLNA | LITTER_FALL_NA | 75 | 5.1 |
| 153 | LWFLLNA | LARGE_WOOD_FALL_NA | 9 | 0.7 |
| Litter Pool Na: Units are in g m-2 | ||||
| 154 | LLEAFNA | L_LEAF_NA | 1 | 0.1 |
| 155 | LSWNA | L_SMALL_WOOD_NA | 1 | 0.1 |
| 156 | LFINNA | L_FINE_NA | 2 | 0.2 |
| 157 | LRPRNA | L_REPRODUCTIVE_NA | 2 | 0.2 |
| 158 | LLTRNA | L_LITTER_NA | 12 | 0.9 |
| 159 | FLEAFNA | F_AND_H_LEAF_NA | 1 | 0.1 |
| 160 | FSWNA | F_AND_H_SMALL_WOOD_NA | 1 | 0.1 |
| 161 | FFINNA | F_AND_H_FINE_NA | 1 | 0.1 |
| 162 | FRPRNA | F_AND_H_REPRODUCTIVE_NA | 1 | 0.1 |
| 163 | FLTRNA | F_AND_H_LITTER_NA | 11 | 0.8 |
| 164 | TLEAFNA | TOTAL_LEAF_NA | 38 | 2.6 |
| 165 | TSWNA | TOTAL_SMALL_WOOD_NA | 2 | 0.2 |
| 166 | TFINNA | TOTAL_FINE_NA | 5 | 0.4 |
| 167 | TRPRNA | TOTAL_REPRODUCTIVE_NA | 1 | 0.1 |
| 168 | TLTRNA | TOTAL_LITTER_NA | 19 | 1.3 |
| 169 | LWNA | LARGE_WOOD_NA | 2 | 0.2 |
| Litterfall Mn: Units are in g m-2 yr-1 | ||||
| 170 | LFLLMN | LEAF_FALL_MN | 2 | 0.2 |
| 171 | SWFLLMN | SMALL_WOOD_FALL_MN | 2 | 0.2 |
| 172 | FINFLLMN | FINE_FALL_MN | 2 | 0.2 |
| 173 | RPRFLLMN | REPRODUCTIVE_FALL_MN | 0 | 0 |
| 174 | LTRFLLMN | LITTER_FALL_MN | 19 | 1.3 |
| 175 | LWFLLMN | LARGE_WOOD_FALL_MN | 0 | 0 |
| Litter Pool Mn: Units are in g m-2 | ||||
| 176 | LLEAFMN | L_LEAF_MN | 0 | 0 |
| 177 | LSWMN | L_SMALL_WOOD_MN | 0 | 0 |
| 178 | LFINMN | L_FINE_MN | 0 | 0 |
| 179 | LRPRMN | L_REPRODUCTIVE_MN | 0 | 0 |
| 180 | LLTRMN | L_LITTER_MN | 0 | 0 |
| 181 | FLEAFMN | F_AND_H_LEAF_MN | 0 | 0 |
| 182 | FSWMN | F_AND_H_SMALL_WOOD_MN | 0 | 0 |
| 183 | FFINMN | F_AND_H_FINE_MN | 0 | 0 |
| 184 | FRPRMN | F_AND_H_REPRODUCTIVE_MN | 0 | 0 |
| 185 | FLTRMN | F_AND_H_LITTER_MN | 0 | 0 |
| 186 | TLEAFMN | TOTAL_LEAF_MN | 1 | 0.1 |
| 187 | TSWMN | TOTAL_SMALL_WOOD_MN | 0 | 0 |
| 188 | TFINMN | TOTAL_FINE_MN | 0 | 0 |
| 189 | TRPRMN | TOTAL_REPRODUCTIVE_MN | 0 | 0 |
| 190 | TLTRMN | TOTAL_LITTER_MN | 0 | 0 |
| 191 | LWMN | LARGE_WOOD_MN | 0 | 0 |
3. Data Application and Derivation:
These data can be used to support the analysis of global patterns of carbon and nutrients in litterfall and litter pools of carbon and nutrients.
4. Quality Assessment:
Data sources did not always divide litterfall into the same categories. To accommodate various reporting practices a hierarchy of six categories was developed. Leaf, small wood, reproductive, and large wood were chosen as nominal categories. In addition, “leaf+small wood” and “total fine” are provided for those studies that did not subdivide the component fractions (Table 2, below).
Different investigators applied different definitions of small wood. The cutoff between small and large wood ranges from 2 mm to 5 cm in diameter. Small wood is defined as <5 mm when possible. Otherwise the investigators’ definition (sometimes unstated) was used. As a result, the size of material considered to be small wood varies among the data sources.
5. Data Acquisition Materials and Methods:
Literature Review:
Investigators exclusively used literature sources reporting primary measurements of litterfall and littermass. The litter database was developed from about 685 original documents. Data was extracted from published and unpublished documents in the categories of journal articles, books, edited books, technical reports, and theses with publication dates ranging from 1867 to 1997. A complementary bibliographic data set comprising every document used in the compilation was created.
These collections were greatly aided by the reviews of Bray and Gorham (1964), Hutson and Veitch (1985), O’Neill and DeAngelis (1981), Proctor (1983), Vitousek (1984), and Vogt et al. (1986), A first assessment of the utility and thoroughness of our collection took place at a working group meeting hosted by the Max Planck Institute for Biogeochemistry.
Attention was paid to getting relatively complete representation of sites across ecosystem type, climatic regime, and global spatial distribution. Carbon data was of primary concern but measurements for other nutrients were also obtained and include N, P, magnesium (Mg), calcium (Ca), potassium (K), sodium (Na), and manganese (Mn). The data set remains sparse for elements other than C and N. When possible, compositional information (leaf, small wood, reproductive, coarse wood) was retained. Turnover times and decay rates were able to be estimated using this information.
Guidelines for Extracting and Reporting Data:
With such a wide-ranging collection of source literature, deriving a consistent set of guidelines for extracting the data proved difficult. Our approach was to develop guidelines and to include notes with the measurements to increase the probability that the details would be clear about how the primary data was handled. In summary, the reference, site information, and measurements of carbon and nutrients or litter fall and litter pool components were recorded. The measurements were reported in many different units and converted into kg m-2 for dry mass, and into g m-2 for N, P, and nutrients.
Note that dry matter was not converted to carbon. This conversion fraction (~0.5 by mass) can vary and so the reported measurements were not converted so that others using the database could choose appropriate conversion factors.
Each record in the database represents a site. The intention was to compile a comprehensive data set of individual direct field measurements reported by researchers. Most often site averages from replicate research plots were reported in the literature source. However, reported measurements were averaged under the following two circumstances. (1) replicate measurements obtained from a series of plots or litterfall traps at a single site were averaged when the plots were established to characterize spatial variability within a relatively uniform cover type. (2) measurements obtained in consecutive years at a single site were averaged when these measurements were designed to capture interannual variability of a relatively uniform cover type. The averages were recorded in the database. If several measurements were reported, even if for the same litter feature (like leaf litter pool or coarse wood pool), but otherwise distinguished as different by the author (e.g., along an elevational gradient, chronosequence, or completely unrelated in space), these measurements were treated as representing different sites. If several measurements were made during the year to account for seasonal variation then we summed litterfall measurements and reported an annual total and average litter pool measures and reported an annual average. In most cases only a single measurement period is reported. In the case of litterfall this is most often at the beginning of the dormant period when most, but not all, the litterfall occurs. For littermass, one-time measurements are problematic in ecosystems with large seasonal variation in the amount of littermass. If measurements are not taken in the same season then unintended variation is introduced. Often, littermass is measured when it is maximal, at the beginning of the dormant season. Seasonal variation was not adjusted when one time measurements were reported.
Exclusions and Exceptions:
For every source document, the site description, method, and results were carefully reviewed. If a study site was not described well enough to locate within 0.5 degree latitude or longitude, measurements from the source were not used. Data were also omitted if litter fall or litter pools were not reported as oven-dry weight or if units were indecipherable. The only exception made to this dry-weight standard was for standing dead mass since this material is extremely difficult to harvest and dry. Often the weight of standing dead material is estimated using a volume estimate which is already converted to dry weight. The presence or absence of ash, an estimate of non-organic matter in litter and frequently reported with dry mass measurements, was not a criterion used to include or exclude measurements. However, if ash was reported separately from dry mass, the ash weight was subtracted and ash free dry weight was reported.
General Description of Litterfall and Littermass Data Categories
Litterfall:
In nearly every data source only aboveground litterfall production was reported. This database is therefore limited to aboveground litterfall. All reported measurements were converted to weight per unit area and totaled, when appropriate, to year values. For litterfall dry weight we report kg m-2 yr-1. For nutrients we use g m-2 yr-1.
Litterfall may be divided into many categories. Data sources did not always divide litterfall into the same categories. To accommodate various reporting practices we developed a hierarchy of 6 categories. We chose leaf, small wood, reproductive, and large wood as nominal categories. We also provide “leaf+small wood” and “total fine” for those studies that did not subdivide the component fractions (Table 2).
Table 2. Hierarchy of litterfall and littermass categories for plant tissue category used in the database.
| Lumped Categories | Nominal Categories | Split Categories | |
|---|---|---|---|
| Total fine | Leaf + Small wood | Leaf | Blade |
| Petiole | |||
| Bud scales | |||
| Small wood | Twig | ||
| Small branch | |||
| Bark | |||
| Reproductive | Reproductive | Flower | |
| Pollen | |||
| Fruit (seed, fleshy part, husk, cone, etc.) | |||
| Large wood | Large wood | Large branch (fallen) | |
| Bole (fallen) | |||
| Standing dead | |||
| Not included | Not included | Roots (fine, small, large) | |
When possible reported measurements were either lumped or split to fit our nominal categories. If this was not possible the information was recorded in the appropriate lumped categories. In many cases, particularly for reproductive and large wood, not all categories of litterfall were reported. In these cases the corresponding nominal category and any lumped categories that contain this nominal category were marked missing. Different investigators applied different definitions of small wood. The cutoff between small and large wood ranges from 2 mm to 5 cm in diameter. Small wood was defined as <5 mm when possible. Otherwise the investigators’ (sometimes unstated) definition was used. As a result, the size of material considered to be small wood varies among the data sources.
Littermass:
Littermass measurements reported were converted to weight per unit area. Littermass dry weight is reported as kg m-2. Littermass nutrients is reported as g m-2.
Littermass measurements were divided into categories based on types of plant tissues in the same fashion as litterfall described above.
Littermass pools are often divided into temporal categories based on the degree of decomposition of the constituent materials. These are frequently reported separately because of their differences in nutrient content and importance in nutrient cycling (Aber et al. 1978). These different littermass pools form vertical layers with the most decomposed layer next to the soil surface and the freshest material on the top. The surface or L-layer consists of freshly fallen material that is intact and relatively undecomposed. The next layer down is called the fermentation or F-layer and is largely fragmented, colonized by microbial and fungal decomposers, but still recognizable as to the category of plant tissue. The third layer, in contact with the mineral soil surface is considerably transformed, physically and chemically. This layer is referred to as the humification or H-layer and may or may not be easily distinguished from the surface mineral soil layer. The L, F and H layers are alternatively referred to as the Oa, Oe and Oi layers respectively. In practice it is difficult to objectively distinguish the F and H layers so they are often combined into a F+H layer. If the investigator distinguished separate littermass layers the data were recorded separately into L and F+H categories. If these layers were not distinguished the littermass data were entered as Total category for each plant tissue category (see Table 3).
Table 3. Hierarchy of littermass categories for decomposition category used in the database.
| Lumped Categories | Nominal Categories | Split Categories | |
|---|---|---|---|
| Total litter | L layer | L layer | Oa layer |
| F+H layer | F layer | Oe layer | |
| H layer | Oi layer | ||
6. Data Access:
These data are available through the Oak Ridge National Laboratory (ORNL) Distributed Active Archive Center (DAAC).
Data Archive Center:
Contact for Data Center Access Information:
E-mail: uso@daac.ornl.gov
Telephone: +1 (865) 241-3952
7. References:
Aber, J.D., D.B. Botkin, and J.M. Melillo 1978. Predicting the effects of different harvesting regimes on forest floor dynamics in northern hardwoods. Can. J. For. Res. 8:306-315.
Bray, J.R. and E. Gorham 1964. Litter production in forests of the world. Advances in Ecological Research 2:101-157.
Hutson, B.R., and L. G. Veitch. 1985. Relationships between litterfall rate, litter mass and decomposition rate in Eucalyptus forests in southeastern Australia. Australian Journal of Ecology 10.4: 443-450.
O’Neill, R.V. and D.L. DeAngelis 1981. Comparative productivity and biomass relations of forest ecosystems. Dynamic Properties of Forest Ecosystems, 411-449.
Proctor, J. 1983. Tropical forest litterfall. I. Problems of data comparison. Special publications series of the British Ecological Society. Vitousek PM. 1984. Litterfall, nutrient cycling and nutrient limitation n tropical forests. Ecology 65:285-298.
Vitousek PM. 1984. Litterfall, nutrient cycling and nutrient limitation n tropical forests. Ecology 65:285-298.
Vogt, K.A., C.C. Grier, and D.J. Vogt 1986. Production, Turnover, and Nutrient Dynamics of Above- and Belowground Detritus of World Forests. Advances in Ecological Research 15:303-377.
The bibliographic sources for the data are provided as a companion file in ASCII text format, Litterfall_source_bibliography.txt.