Documentation Revision Date: 2018-07-14
Data Set Version: 1.2
Summary
This LiDAR based vegetation canopy dataset incorporates three-dimensional canopy structure, yielding information not available in two-dimensional images of the landscape provided by most of the traditional multi-spectral remote sensing platforms. These three-dimensional measurements provide a better representation of vegetation structure and distribution within the diverse ecosystem of the GSMNP.
This dataset includes four GeoTIFF files and three supplementary text files.
Support Acknowledgement:
This research was partially sponsored by the U.S. Department of Agriculture, U.S. Forest Service, Eastern Forest Environmental Threat Assessment Center. Additional support was provided by the Biogeochemistry Feedbacks Scientific Focus Area, which is sponsored by the Regional and Global Climate Modeling Program in the Climate and Environmental Sciences Division of the Biological and Environmental Research Program in the U.S. Department of Energy Office of Science.
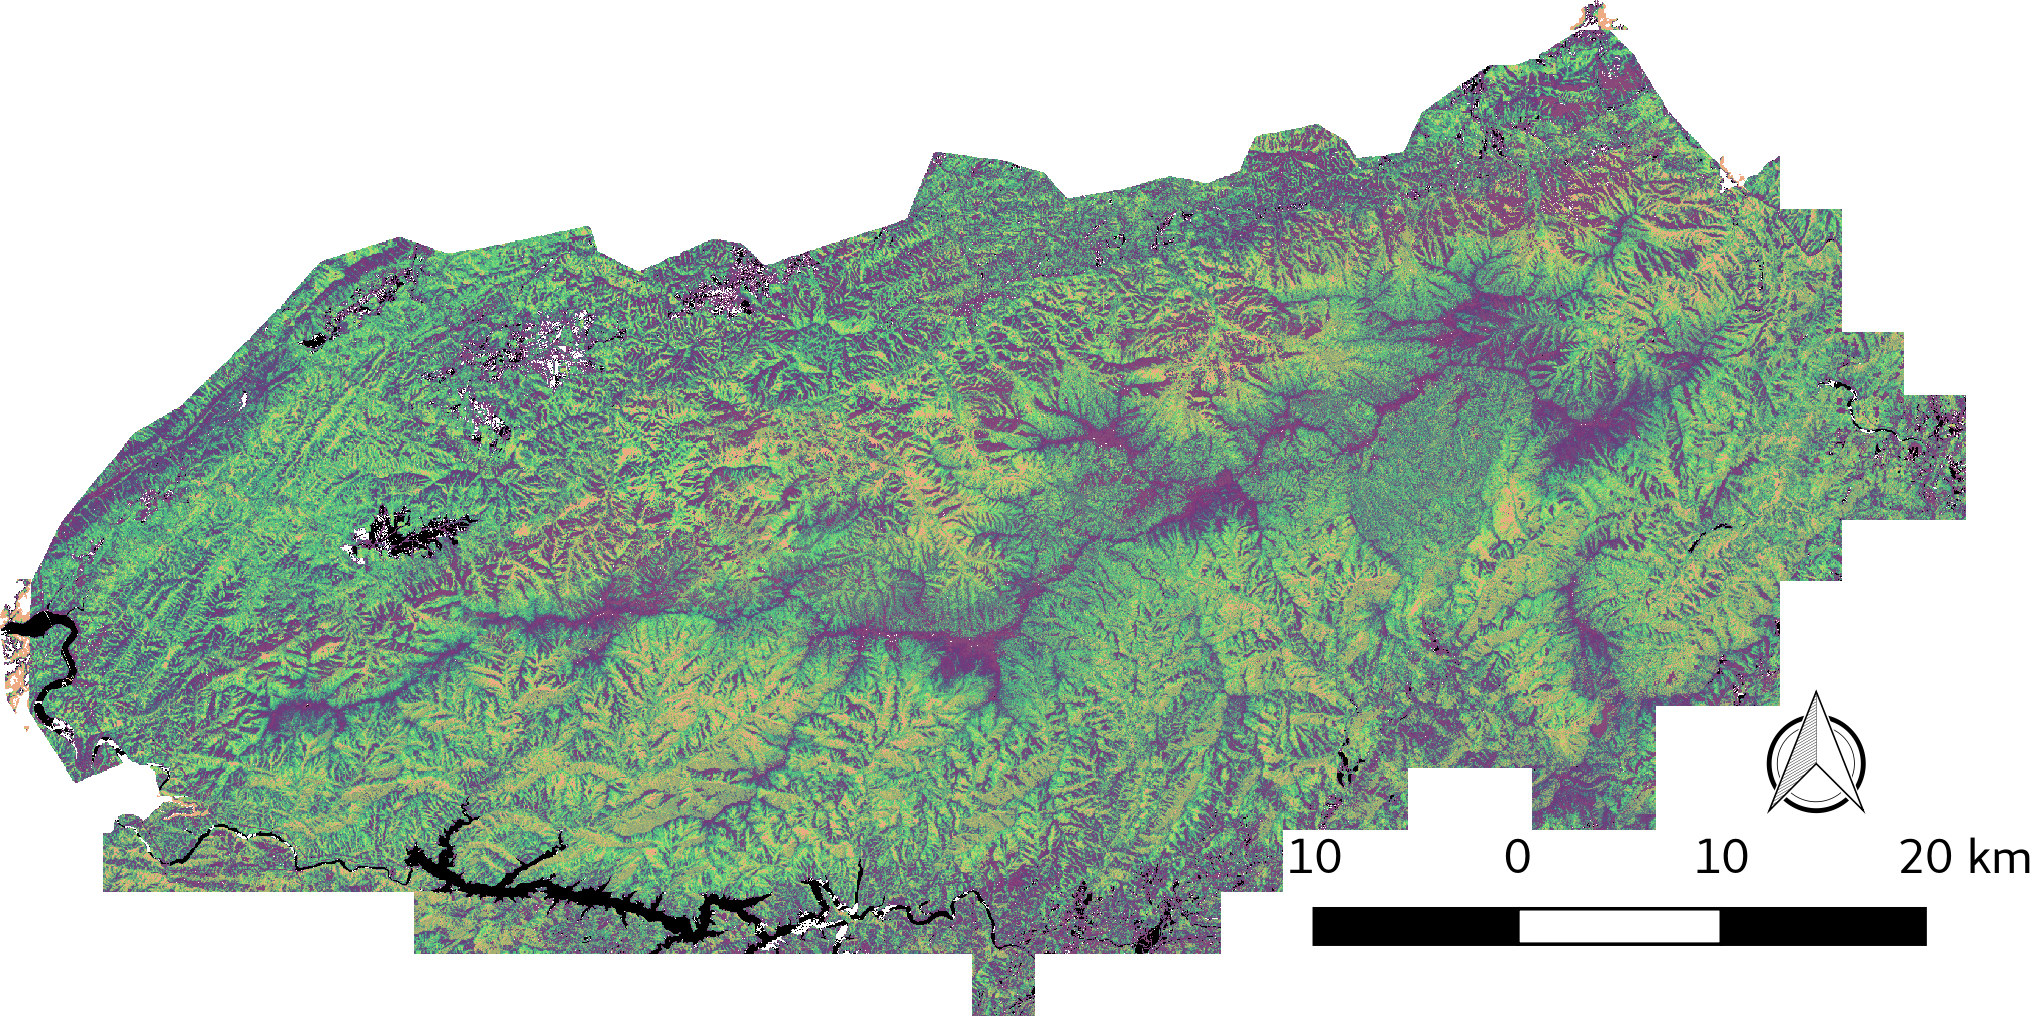
Figure 1. 30 unique vegetation canopy structure classes identified for Great Smoky Mountain National Park
Citation
Kumar, J., J. Weiner, W.W. Hargrove, S.P. Norman, F.M. Hoffman, and D. Newcomb. 2018. LiDAR-derived Vegetation Canopy Structure, Great Smoky Mountains National Park, 2011. ORNL DAAC, Oak Ridge, Tennessee, USA. https://doi.org/10.3334/ORNLDAAC/1286
Table of Contents
- Data Set Overview
- Data Characteristics
- Application and Derivation
- Quality Assessment
- Data Acquisition, Materials, and Methods
- Data Access
- References
- Data Set Revisions
Data Set Overview
This dataset provides multiple-return LiDAR-derived vegetation canopy structure at 30-meter spatial resolution for the Great Smoky Mountains National Park (GSMNP). Canopy characteristics were analyzed using high resolution three-dimensional point cloud measurements gathered between February-April 2011 for Tennessee and during March-April 2005 for North Carolina sections of the park. Vegetation types were mapped by grouping areas of similar canopy structure. The map was compared and validated against existing vegetation maps for the Park.
This LiDAR based vegetation canopy dataset incorporates three-dimensional canopy structure, yielding information not available in two-dimensional images of the landscape provided by most of the traditional multi-spectral remote sensing platforms. These three-dimensional measurements provide a better representation of vegetation structure and distribution within the diverse ecosystem of the GSMNP.
LiDAR point clouds were aggregated into a 30- by 30-meter horizontal grid and split into 1-meter vertical bins from the ground surface to a maximum height of 75 meters. Point density within each bin was used to characterize vertical structure of the vegetation canopy as a percentage of total points in each 30-meter grid cell. Cluster analysis identified 30 distinct canopy structure classes representing 8 traditional vegetation classes for GSMNP. Data processing is described in Kumar et al. (2015). This dataset includes geotiffs (4) depicting LiDAR-derived canopy structure classes, vegetation classes mapped to LiDAR-derived canopy structure classes, LiDAR-derived canopy structure classes mapped to vegetation classes, and maximum canopy height map for the GSMNP.
Version 2 of this dataset presents an updated characterization of vegetation canopy structure in GSMNP expanded to cover the entire park across Tennessee and North Carolina.
Data Characteristics
Spatial Coverage: Great Smoky Mountains National Park in Tennessee and North Carolina
Spatial Resolution: 30-meter
Temporal Coverage: This dataset was produced from LiDAR point cloud data gathered between February-April 2011 for Tennessee and during March-April 2005 for North Carolina sections of the park.
Temporal Resolution: The dataset is representative of vegetation canopy structure within GSMNP at the times of the airborne LiDAR campaigns.
Study Area: (These coordinates are the approximate locations of the study sites and may not match the extent of the data files. All latitude and longitude are given in decimal degrees.)
| Site | Northern Extent | Western Extent | Eastern Extent | Southern Extent |
|---|---|---|---|---|
| GSMNP | 35.866 | -84.051 | -82.960 | 35.376 |
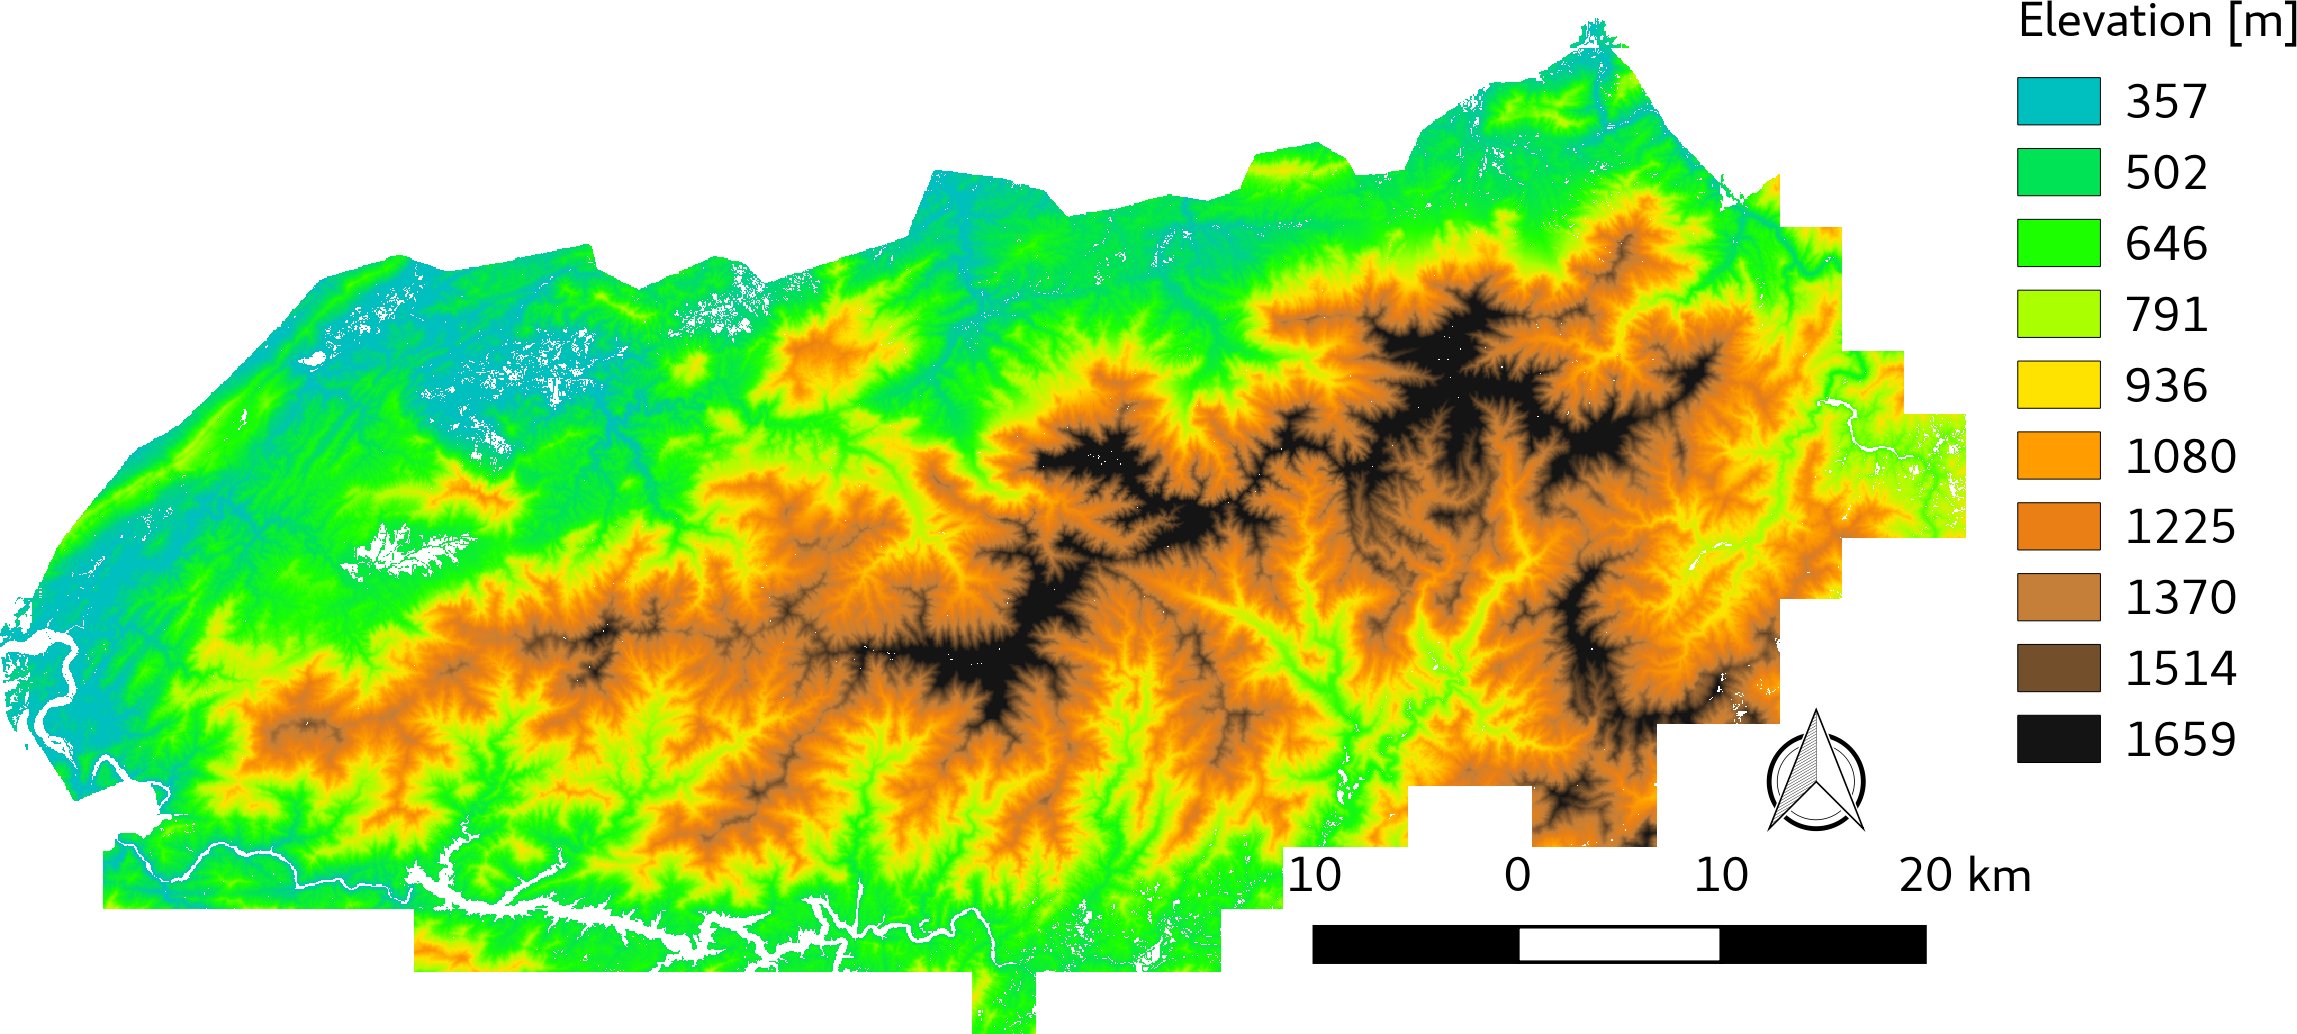
Figure 2: Digital elevation model for the study area (3-meter resolution).
The GSMNP covers an approximately 2,224 square kilometer (816 square mile) area of complex topography, with elevations ranging from 267 to 2,025 meters above mean sea level on the border between the states of Tennessee and North Carolina. GSMNP is ecologically rich and diverse, consisting of about 1,600 species of flowering plants, including 100 native tree species and over 100 native shrub species. The distribution of vegetation in the park is strongly influenced by topography, moisture, and other environmental gradients.
Data File Information
This dataset is comprised of 4 single-band GeoTIFFs accompanied by 3 companion text files.
Data Properties
No Data Value: 255
Projection: EPSG:26917
Data File Extents
| Filename | North Latitude | South Latitude | East Longitude | West Longitude |
|---|---|---|---|---|
| gsmnp_canopy_structure_classes_k30.tif | 35.865273 | 35.37665 | -82.961504 | -84.050734 |
| gsmnp_canopy_structure_classes_k30.reclassed.tif | 35.831601 | 35.487783 | -83.095437 | -84.035931 |
| GRSM_VegInventory_30m.reclassed.tif | 35.775216 | 35.433051 | -83.031695 | -84.008943 |
| gsmnp_95percentile_height.tif | 35.865273 | 35.37665 | -82.961504 | -84.050734 |
Data File Descriptions
| Filename | Description |
|---|---|
| gsmnp_canopy_structure_classes_k30.tif |
This GeoTIFF contains LiDAR-derived vegetation canopy structure based on 30 unique vegetation classes. Companion file: vegetation_canopy_structures_k30.txt contains the vertical canopy structures that define each of these classes. Note that each row in the file represents a LiDAR-derived canopy structure and each column a 1-meter vertical bin of average point densities per square meter for each canopy structure. |
| GRSM_VegInventory_30m.reclassed.tif |
This GeoTIFF contains GRSM vegetation inventory (Madden 2014) remapped to the LiDAR-based canopy structure classes. Companion file: translation_table_GRSMvegmap-k30.txt contains the translation table. |
| gsmnp_canopy_structure_classes_k30.reclassed.tif |
This GeoTIFF contains the LiDAR-based canopy structure classes remapped to GRSM vegetation inventory (Madden 2014). Companion file: translation_table_k30-GRSMvegmap.txt contains the translation table. |
| gsmnp_95percentile_height.tif |
This GeoTIFF contains the canopy height, which contains the 95th percent LiDAR return points, within the 30 m pixel. It represents the approximate maximum canopy height, while filtering for anomalous high points often encountered in the point cloud. Note: See Madden (2014) for additional information regarding CEGL codes and classes. |
Table 1: Mapcurves (Hargrove et al. 2006) based translation between LiDAR-derived canopy structure and traditional GRSM vegetation inventory classes
Note: Mapcurves identifies the single vegetation type having the best fit in terms of spatial overlap with the LiDAR canopy structure clusters, though clusters are likely to overlap with many vegetation types. The table shows the single vegetation category exhibiting the largest spatial co-registration.
For instance, the Chestnut oak vegetation type, which accounts for 43% of the mapped area, corresponds with 12 different profile types, perhaps reflecting differences in both forest age and compositional differences.
| Canopy structure | GSMNP Vegetation Descriptor |
|---|---|
| 0 | Water |
| 1 | Montane cove forests |
| 2 | Northern hardwood/acid hardwood forests |
| 3 | Northern hardwood/acid hardwood forests |
| 4 | Northern hardwood/acid hardwood forests |
| 5 | Montane cove forests |
| 6 | Northern hardwood/acid hardwood forests |
| 7 | Northern hardwood/acid hardwood forests |
| 8 | Chestnut oak forests |
| 9 | Montane oak-hickory forests |
| 10 | Northern hardwood/acid hardwood forests |
| 11 | Ericaceous shrubs |
| 12 | Northern hardwood/acid hardwood forests |
| 13 | Chestnut oak forests |
| 14 | Montane cove forests |
| 15 | Montane oak-hickory forests |
| 16 | Montane cove forests |
| 17 | Chestnut oak forests |
| 18 | Chestnut oak forests |
| 19 | Montane cove forests |
| 20 | Chestnut oak forests |
| 21 | Montane oak-hickory forests |
| 22 | Chestnut oak forests |
| 23 | Northern hardwood/acid hardwood forests |
| 24 | Montane oak-hickory forests |
| 25 | Northern hardwood/acid hardwood forests |
| 26 | Montane cove forests |
| 27 | Montane oak-hickory forests |
| 28 | Northern hardwood/acid hardwood forests |
| 29 | Chestnut oak forests |
| 30 | Chestnut oak forests |
Application and Derivation
This dataset was produced to identify and characterize the three-dimensional structure and spatial distribution of vegetation canopies. Vegetation canopy structure is a critically important habitat characteristic for many threatened and endangered birds and other animal species. Species composition in the GSMNP is in a state of transition due to various environmental stressors like fires, hemlock death due to the wooly adelgid, and other factors. This dataset provides forest and wildlife managers with critically important information for resource management and conservation planning.
Quality Assessment
Case studies were conducted to verify the LiDAR based canopy structures against the best available maps of vegetation in GSMNP (Madden, 2014). Cades Cove consists of woodlots interspersed within regularly mowed and burned fields to mimic a 19th century agrarian settlement. Vegetation maps produced by Madden (2014) identify this region as "Successional or modified vegetation," in correspondence with the low height vegetation class identified through the LiDAR-based analysis. Additional validation was performed at a number of "Citizen Science" phenology plots maintained by the Great Smoky Mountains Institute at Tremont (GSMIT), an area surrounded by "Montane Cove" and "Hemlock" forest, which further indicated agreement between the LiDAR canopy structures and vegetation class.
Data Acquisition, Materials, and Methods
This dataset provides multiple-return LiDAR-derived vegetation canopy structure and their spatial distribution at 30-meter spatial resolution for the Great Smoky Mountains National Park (GSMNP). This LiDAR based vegetation canopy dataset incorporates three-dimensional canopy structure, yielding information not available in two-dimensional images of the landscape provided by most of the traditional multi-spectral remote sensing platforms. These three-dimensional measurements provide a better representation of vegetation structure and distribution within the diverse ecosystem of the GSMNP. The map was compared and validated against existing vegetation maps for the Park.
The airborne LiDAR survey for Tennessee section of the park was conducted during February - April 2011 by The Center for Remote Sensing and Mapping Science at the University of Georgia and Photo Science, Inc. under a U.S. Geological Survey-funded program. The survey covered the roughly 1,400 sq. km (540 sq. miles) area of the Tennessee portion of the GSMNP and Foothills Parkway. Data were calibrated and LiDAR points categorized as unclassified, ground, noise, or overlap. Datasets were split into 1,500 by 1,500-meter adjacent, non-overlapping tiles. Airborne LiDAR for North Carolina section of the GSMNP was acquired during March-April 2005 by the North Carolina Flood Plain Mapping Program. The tiled datasets in "las" format used in this study were obtained from the National Park Service.
LiDAR point clouds were aggregated into a 30- by 30-meter horizontal grid and split into 1-meter vertical bins from the ground surface to a maximum height of 75 meters. Point density within each bin was used to characterize vertical structure of the vegetation canopy as a percentage of total points in each 30-meter grid cell. Cluster analysis identified 30 distinct canopy structure classes representing 8 traditional vegetation classes for GSMNP. Data processing is described in Kumar et al. (2015).
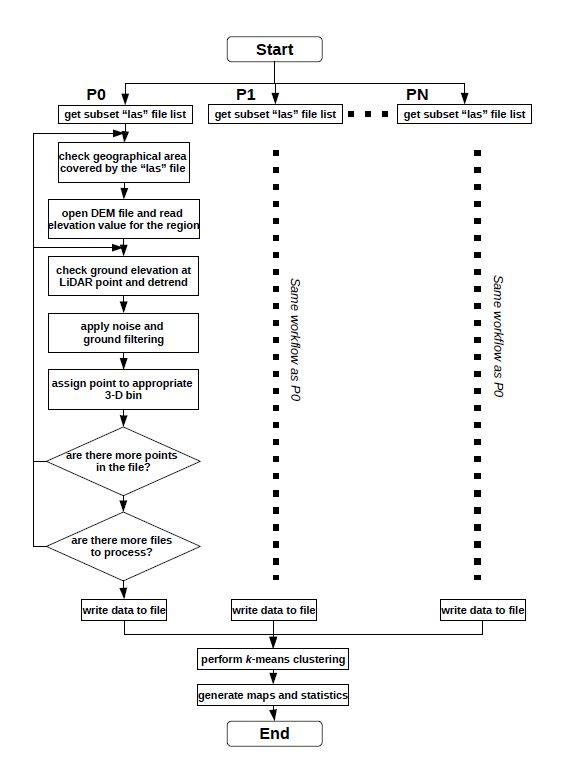
Figure 3: Computational workflow for the analysis.
The raw LiDAR point cloud data was filtered to remove points at anomalously high and low elevations and points corresponding to low height vegetation within 1 meter of ground level. Grid cells where 95% or more LiDAR return points were within 1 meter of the ground surface were identified and classified as low lying elevation.
A k-means clustering algorithm was used to cluster the gridded point cloud into groups containing locations with similar vertical canopy structure. k-means clustering groups data by iteratively assigning pixels to the nearest centroid and repositioning clusters based on the mean euclidean distance of each assigned pixel to all centroids until fewer than 0.05% changed cluster assignments. The high volume of LiDAR data used to produce this dataset was analyzed using a parallel version of the k-means algorithm (Kumar et al., 2011) to accelerate convergence, handle empty cluster cases, and obtain initial centroids through a scalable implementation of the triangular equality based acceleration method (Hartigan 1975).
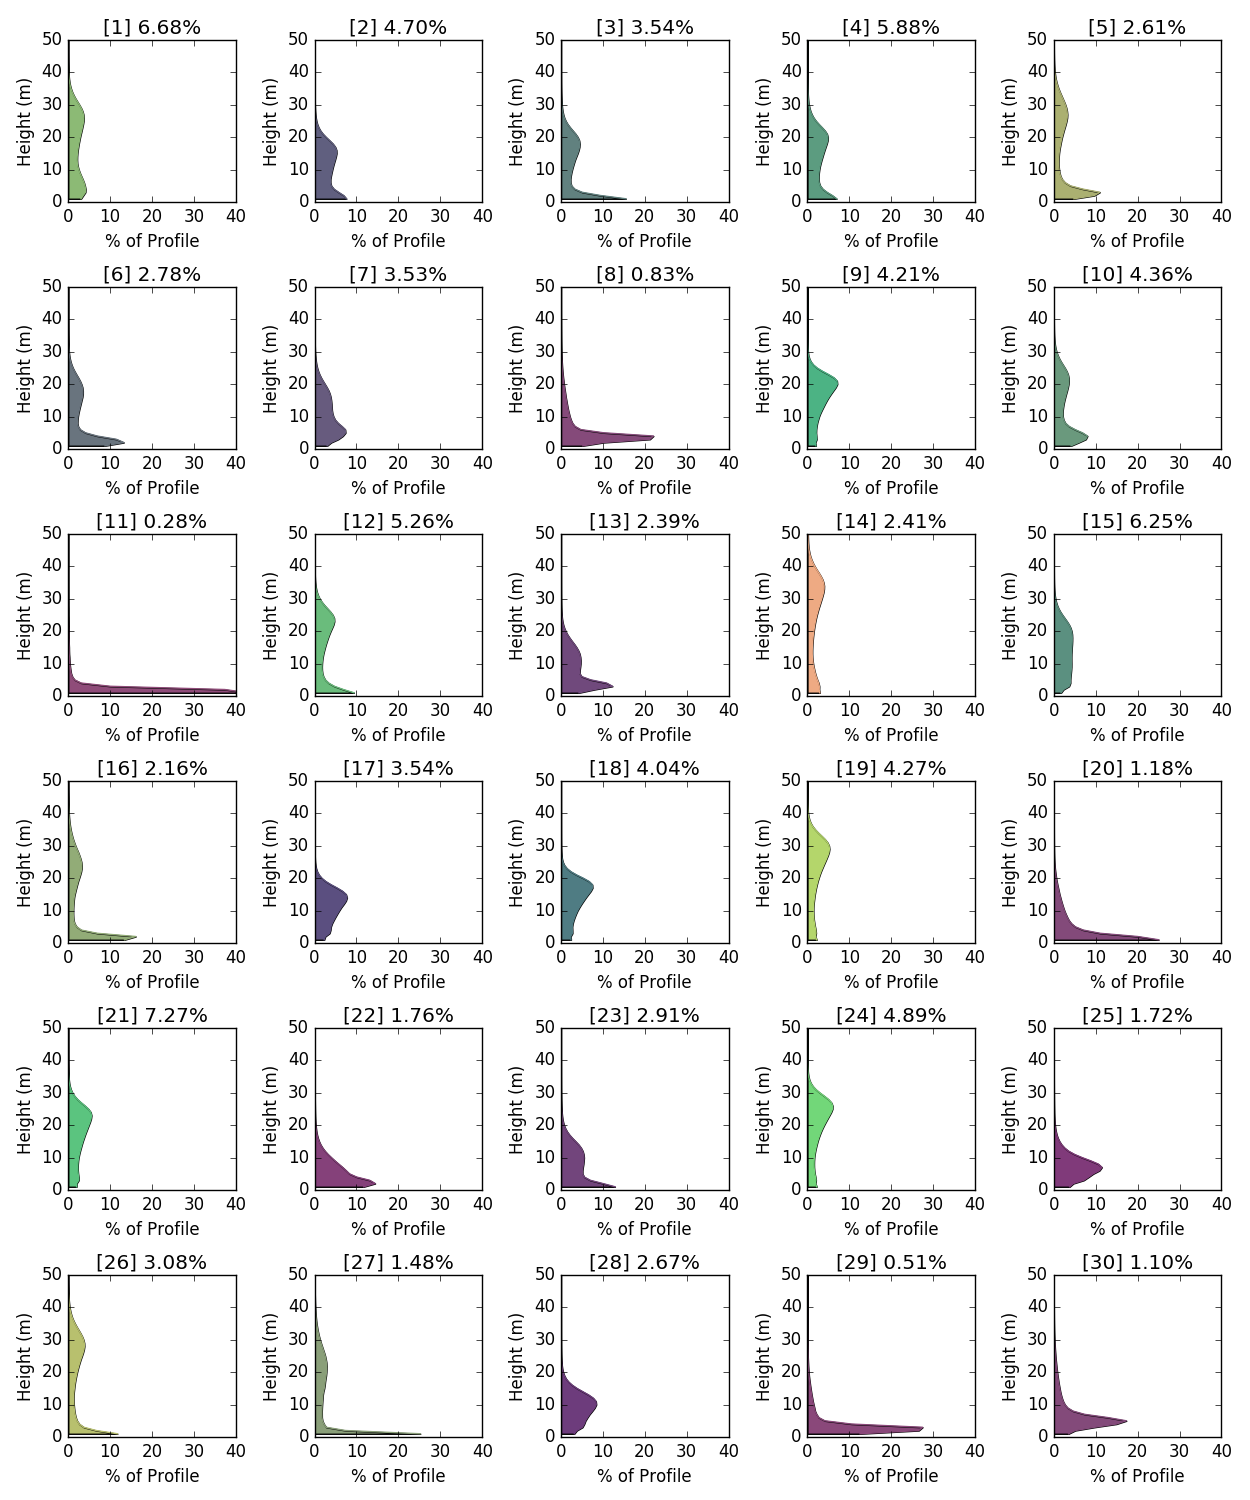
Figure 4: Representative vegetation canopy structures that define the 30 unique canopy structure classes.
Mapcurves (Hargrove et al., 2006) algorithm was used to identify the best translation table between LiDAR clusters and vegetation types. Mapcurves identifies the single vegetation type having the best fit in terms of spatial overlap with each LiDAR cluster.
Data Access
These data are available through the Oak Ridge National Laboratory (ORNL) Distributed Active Archive Center (DAAC).
LiDAR-derived Vegetation Canopy Structure, Great Smoky Mountains National Park, 2011
Contact for Data Center Access Information:
- E-mail: uso@daac.ornl.gov
- Telephone: +1 (865) 241-3952
References
Hargrove W. W., F. M. Hoffman, and P. F. Hessburg, “Mapcurves: A quantitative method for comparing categorical maps,” J. Geograph. Syst., vol. 8, no. 2, pp. 187–208, Jul. 2006.
Hartigan J.A., Clustering Algorithms. John Wiley & Sons, 1975.
Kumar J., R. T. Mills, F. M. Hoffman, and W. W. Hargrove, “Parallel k-means clustering for quantitative ecoregion delineation using large data sets,” in Proceedings of the International Conference on Computational Science (ICCS 2011), ser. Procedia Comput. Sci., M. Sato, S. Matsuoka, P. M. Sloot, G. D. van Albada, and J. Dongarra, Eds., vol. 4. Amsterdam: Elsevier, Jun. 2011, pp. 1602–1611.
Kumar, J., J. Weiner, W.W. Hargrove, S.P. Norman, F.M. Hoffman, and D. Newcomb, 2015. Characterization and classification of vegetation canopy structure and distribution within the Great Smoky Mountains National Park using LiDAR. Proc. Intern. Conf. Data Mining (ICDM 2015)
Madden M., “Overstory Vegetation at Great Smoky Mountains National Park, Tennessee and North Carolina, Reference Code: 1047498,” 2014. [Online]. Available: https://irma.nps.gov/App/ Reference/Profile/1047498
Data Set Revisions
Revision 1.1 - 01/31/2018 - The revised version of this dataset presents an updated characterization of vegetation canopy structure in the GSMNP expanded to cover the entire park across Tennessee and North Carolina. This new release also includes a new maximum canopy height product for the GSMNP.
- This revised version of the data covers approximately 2,114 square kilometers (816.28 square miles) of the GSMNP.
- The previous version covered approximately 1,400 square kilometers (540 square miles) of the Tennessee part of the GSMNP.
Revision 1.2 - 07/14/2018- This updated version replaces all the *.tif files in the collection to address inconsistencies between the *.tif files and data description figures/tables that were erroneously introduced in Revision 1.1. Maximum canopy height data was not affected.