Documentation Revision Date: 2018-02-22
Data Set Version: 1
Summary
Eight of the 50 x 50-m plots were located in primary forests, eight were in primary forest subject to reduced-impact selective logging (PFL) between 1999 and 2003, and 14 plots were in secondary forest (SF) with different age and disturbance histories. All trees were identified as to their species or genus (when species was uncertain) level. Measurements were taken for each living tree 5-cm or greater in diameter in early successional stands and 10-cm or greater in all other stands. DBH was recorded to the nearest 0.1 cm, height to the base of the live crown and total height were estimated visually to the nearest 0.5-m, and crown depth was calculated as the difference between total height and base to the live crown. For a 12.5-m × 50-m subplot extending along the major axis of the GLAS footprint, crown radius was measured in two orthogonal directions by projecting the edge of the crown to the ground and recording its horizontal distance to the trunk to the nearest 0.1 m using a tape measure.
There is one data file in comma-separated format (.csv) with this dataset that contains the biometric and tree inventory data. There is also one file in shapefile (.shp) format with plot location information. This file is also provided as a companion file in .kmz format for viewing in Google Earth.
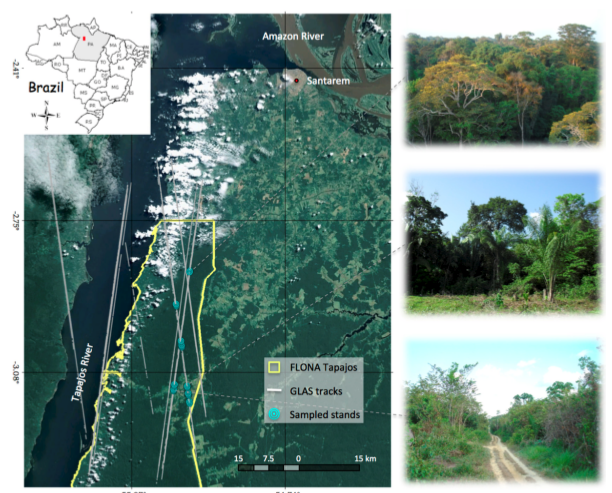
Figure 1. Geographical location of the Tapajos National Forest, PA, Brazil, outlined in yellow. The gray lines are GLAS tracks from 2003 to 2009 and the blue circles are the plots sampled. The pictures on the right illustrate three of the stands where plots were located (Goncalves et al., 2017).
Citation
Goncalves, F.G., R.N. Treuhaft, J.R. Dos santos, P. Graca, A. Almeida, and B.E. Law. 2018. Tree Inventory and Biometry Measurements, Tapajos National Forest, Para, Brazil, 2010. ORNL DAAC, Oak Ridge, Tennessee, USA. https://doi.org/10.3334/ORNLDAAC/1552
Table of Contents
- Data Set Overview
- Data Characteristics
- Application and Derivation
- Quality Assessment
- Data Acquisition, Materials, and Methods
- Data Access
- References
Data Set Overview
This dataset provides tree inventory, tree height, diameter at breast height (DBH), and estimated crown measurements from 30 plots located in the Tapajos National Forest, Para, Brazil collected in September 2010. The plots were located in primary forest, primary forest subject to reduced-impact selective logging (PFL) between 1999 and 2003, and secondary forest (SF) with different age and disturbance histories. Plots were centered on GLAS (the Geoscience Laser Altimeter System) LiDAR instrument footprints selected along two sensor acquisition tracks spanning a wide range in vertical structure and aboveground biomass.
Eight of the 50 x 50-m plots were located in primary forests, eight were in primary forest subject to reduced-impact selective logging (PFL) between 1999 and 2003, and 14 plots were in secondary forest (SF) with different age and disturbance histories. All trees were identified as to their species or genus (when species was uncertain) level. Measurements were taken for each living tree 5-cm or greater in diameter in early successional stands and 10-cm or greater in all other stands. DBH was recorded to the nearest 0.1 cm, height to the base of the live crown and total height were estimated visually to the nearest 0.5-m and calibrated with a laser rangefinder, as described by Gonçalves (2014), and crown depth was calculated as the difference between total height and base to the live crown. For a 12.5-m × 50-m subplot extending along the major axis of the GLAS footprint, crown radius was measured in two orthogonal directions by projecting the edge of the crown to the ground and recording its horizontal distance to the trunk to the nearest 0.1 m using a tape measure.
The Tapajos National Forest is located along highway BR-163, approximately 50 km south of the city of Santarem, Pará, in the central Brazilian Amazon.
Related Publication:
Goncalves, F., R. Treuhaft, B. Law, A. Almeida, W. Walker, A. Baccini, J. Roberto dos Santos, and P. Graca. 2017. Estimating Aboveground Biomass in Tropical Forests: Field Methods and Error Analysis for the Calibration of Remote Sensing Observations. Remote Sens. 2017, 9, 47; http://dx.doi.org/10.3390/rs9010047
Data Characteristics
Spatial Coverage: Tapajos National Forest, Para, Brazil
Spatial Resolution: 50 x 50 m plot
Temporal Coverage: 2010-08-31 to 2010-09-16
Temporal Resolution: One-time sampling
Study Area (All latitude and longitude given in decimal degrees)
| Site | Westernmost Longitude | Easternmost Longitude | Northernmost Latitude | Southernmost Latitude |
|---|---|---|---|---|
| Tapajos National Forest, Para, Brazil | -54.9857 | -54.9488 | -2.8603 | -3.1529 |
Study Plots: Locations of the 30 study plots in the Tapajos National Forest, Para, Brazil. Coordinates are the centroid of the respective 50 x 50 m plot.
| Plot | Longitude | Latitude | Elevation (m) |
|---|---|---|---|
| 1 | -54.953095 | -3.130912 | 90.9 |
| 2 | -54.952725 | -3.133013 | 102.4 |
| 3 | -54.952627 | -3.133861 | 106.2 |
| 4 | -54.967090 | -3.027957 | 144.9 |
| 5 | -54.966862 | -3.029513 | 138.9 |
| 6 | -54.967549 | -3.024846 | 162.5 |
| 7 | -54.968220 | -3.020171 | 161.9 |
| 8 | -54.979361 | -2.937596 | 178.7 |
| 9 | -54.979570 | -2.936039 | 182.8 |
| 10 | -54.979781 | -2.934482 | 182 |
| 11 | -54.979154 | -2.939156 | 175.7 |
| 12 | -54.967318 | -3.026402 | 149.4 |
| 13 | -54.968581 | -3.017016 | 159.9 |
| 14 | -54.952407 | -3.135418 | 110 |
| 15 | -54.968882 | -3.015529 | 162.8 |
| 16 | -54.950032 | -3.152583 | 106.6 |
| 17 | -54.950426 | -3.149415 | 95.2 |
| 18 | -54.955232 | -3.115119 | 91.5 |
| 19 | -54.955037 | -3.116719 | 97.4 |
| 20 | -54.955014 | -3.118327 | 111.8 |
| 21 | -54.983555 | -3.112966 | 94.2 |
| 22 | -54.983762 | -3.114550 | 97.4 |
| 23 | -54.983340 | -3.111408 | 95.8 |
| 24 | -54.985405 | -3.125354 | 95.5 |
| 25 | -54.985105 | -3.123851 | 92.7 |
| 26 | -54.984877 | -3.122297 | 96 |
| 27 | -54.949660 | -2.865231 | 176.2 |
| 28 | -54.949474 | -2.863790 | 175.9 |
| 29 | -54.949029 | -2.860537 | 177.7 |
| 30 | -54.949234 | -2.862164 | 173.3 |
Data File Information
This dataset includes one data file in comma-separated (.csv) format and one shapefile (.shp). The shapefile data are also provided in .kmz format for viewing in Google Earth (forest_inventory_tapajos.kmz).
Table 1. Data files and descriptions
| File name | Description |
|---|---|
| Tapajos_inventory_data_2010.csv | A file in comma-separated (.csv) format with the inventory and biometric measurements |
| forest_inventory_tapajos.zip | When unzipped, this file contains a shapefile (.shp) with the plot locations. The data are also provided in .kmz format for viewing in Google Earth |
Table 2. Variables in the data file Tapajos_inventory_data_2010.csv. See Figure 2 for description of local x-y coordinate system.
Missing or data not provided are reported as -9999.
| Column name | Units | Description |
|---|---|---|
| plot | Plot number | |
| type | SF=secondary; SLF=selectively logged; PF=primary | |
| origin | Plot corner which serves as the origin for the local cartesian system. NE or SW. See Figure 2. | |
| tree | Tree identification number | |
| family | Scientific family to which the tree belongs | |
| genus | Genus to which the tree belongs | |
| scientific_name | Full scientific name for the tree Genus species | |
| common_name | Local common name | |
| density_wood | g cm-3 | Wood density (literature values) |
| dbh | cm | Diameter at breast height measured at 1.3 meters above the ground |
| ht_crown_base | m | Height to the base of crown |
| ht_total | m | Total tree height |
| depth_crown | m | Crown depth |
| stem_x | m | Tree stem location along the x coordinate |
| stem_y | m | Tree stem location along the y coordinate |
| crown_radius_x0 | m | Crown radius measured from the crown edge closest to the plot origin to the stem along the x coordinate |
| crown_radius_x50 | m | Crown radius measured from the stem to the edge furthest away from the plot origin along the x coordinate |
| crown_radius_y0 | m | Crown radius measured from the crown edge closest to the plot origin to the stem along the y coordinate |
| crown_radius_y50 | m | Crown radius measured from the stem to the edge furthest away from the plot origin along the y coordinate |
| ht_crown_max_x0 | m | Height to the maximum crown width at the edge of the crown closest to the plot origin along the x coordinate |
| ht_crown_max_x50 | m | Height to the maximum crown width at the edge of the crown farthest from the plot origin along the x coordinate |
| ht_crown_max_y0 | m | Height to the maximum crown width at the edge of the crown closest to the plot origin along the y coordinate |
| ht_crown_max_y50 | m | Height to the maximum crown width at the edge of the crown farthest from the plot origin along the y coordinate |
| shape_coeff_crown_x0 | unitless | Shape coefficient for the crown above the maximum crown radius estimated at the crown edge closest to the plot origin along the x coordinate |
| shape_coeff_crown_x50 | unitless | Shape coefficient for the crown above the maximum crown radius estimated at the crown edge furthest from the plot origin along the x coordinate |
| shape_coeff_crown_y0 | unitless | Shape coefficient for the crown above the maximum crown radius estimated at the crown edge closest to the plot origin along the y coordinate |
| shape_coeff_crown_y50 | unitless | Shape coefficient for the crown above the maximum crown radius estimated at the crown edge furthest from the plot origin along the y coordinate |
| shape_coeff_crown_below_x0 | unitless | Shape coefficient for the crown below the maximum crown radius estimated at the crown edge closest to the plot origin along the x coordinate |
| shape_coeff_crown_below_x50 | unitless | Shape coefficient for the crown below the maximum crown radius estimated at the crown edge furthest from the plot origin along the x coordinate |
| shape_coeff_crown_below_y0 | unitless | Shape coefficient for the crown below the maximum crown radius estimated at the crown edge closest to the plot origin along the y coordinate |
| shape_coeff_crown_below_y50 | unitless | Shape coefficient for the crown below the maximum crown radius estimated at the crown edge furthest from the plot origin along the y coordinate |
Shapefile properties
Table 3. Attributes in the shapefile forest_inventory_tapajos.shp
| Attribute | Description |
|---|---|
| plot | Plot ID |
| elev_m | Elevation in meters |
| area_ha | Area in hectares |
The shapefile is also provided as a companion file in .kmz format for viewing in Google Earth (forest_inventory_tapajos.kmz)
Application and Derivation
These data could be useful to climate change studies as well as forest management and deforestation-reforestation studies.
Quality Assessment
Uncertainties resulting from differences in repeated measurements of DBH, height to the base of the live crown, total height,08 crown depth, and crown radius were determined. DBH was the most precisely measured quantity, with a RMSD of less than 2%. Repeated measurements of height were typically within 1 m of each other (RMSD = 15%–18%), with approximately half of the height to the base of the live crown, and a quarter of the total height observations showing identical repeated measurements. Crown depth and crown radius measurements showed considerably less agreement (RMSD of 31 and 26%, respectively). However, with the exception of DBH, there was no evidence of a systematic difference between first and second measurements. For DBH, the data suggested that the second measurement produced values that were lower to a statistically significant degree when compared to the first measurement, although the estimated median difference of less than 0.1 cm has no practical significance. There is considerable discussion of uncertainties in Goncalves et al. (2017).
There was no evidence that absolute differences between repeated measurements (both the mean and the rate of change) varied with forest type, after accounting for differences in the magnitude of the measurements.
Table 4. Summary statistics of differences between repeated measurements of DBH, height to the base of the live crown, total height, crown depth, and crown radius for trees sampled at Tapajos. Statistics include total error (RMSD), systematic error (mean), and random error (SD), in both absolute and relative terms. The number of observations was 104, except for cr (n = 144) (Goncalves et al., 2017).
|
Attribute |
Range |
Differences |
|||||
|
RMSD |
Mean |
SD |
% That Is: | ||||
| 0 | ≤10% | ≤25% | |||||
| DBH | 5.5-110.5 | 0.8 (1.8%) | 0.1 (0.5%) | 0.8 (1.8%) | 23.1 | 100 | 100 |
| Crown Depth | 1-20.0 | 1.8 (30.7%) | -0.3 (-4.8%) | 1.8 (30.5%) | 32.7 | 33.7 | 71.2 |
| Height to Base of Crown | 1.5-31 | 1.8 (17.7%) | 0.1 (0.5%) | 1.8 (17.7%) | 47.1 | 54.8 | 83.7 |
| Total Height | 5.0-40.0 | 2.3 (15.2%) | -0.2 (-1,7%) | 2.3 (15.2%) | 24 | 53.8 | 93.3 |
| Crown Radius | 0.7-8.0 | 0.8 (25.7%) | 0 | 0.8 (25.8%) | 11.8 | 37.5 | 68.8 |
Data Acquisition, Materials, and Methods
Study Site
The Tapajos National Forest is located along highway BR-163, approximately 50 km south of the city of Santarrem Para, in the central Brazilian Amazon. The climate is tropical monsoon, with a mean annual temperature of 25 degrees C and annual precipitation of 1,909 mm, with a 5-month dry season (<100 mm month) between July and November.
The vegetation is dense, upland, tropical moist forest. Common genera among 193 tree species sampled in this study include Psychotria (Rubiaceae), Protium (Burseraceae), Otoba (Myristicaceae), Eschweilera (Lecythidaceae), Pouteria (Sapotaceae), and Rinorea (Violaceae) in primary forests, and Cecropia (Urticaceae), Banara (Salicaceae), and Inga (Fabaceae) in secondary forests. The soils are nutrient-poor oxisols and ultisols, with low pH, organic matter, and cation exchange capacity, and a high concentration of aluminum oxides. Our sample sites were situated on a relatively flat plateau, with the elevation ranging from approximately 80 to 180 m (Goncalves et al., 2017).
Field Data
Field data were collected in September 2010 in 30 0.25-ha plots (50 x 50-m). Of the 30 plots, eight were primary forest (PF), eight were primary forest subject to reduced-impact selective logging (PFL) between 1999 and 2003, and 14 were secondary forest (SF) with different age and disturbance histories. Plots were centered on Geoscience Laser Altimeter System (GLAS) LiDAR instrument footprints selected along two sensor acquisition tracks, spanning a wide range in vertical structure and aboveground biomass. The GLAS instrument that was aboard the NASA Ice, Cloud, and land Elevation (ICESat) satellite. Individual plot centers were located on the ground using a total station and the Differential Global Positioning System (DGPS).
Field biometric measurements included diameter at breast height (DBH) measured with a diameter tape at 1.3 m and recorded to the nearest 0.1 cm; height to the base of the live crown (HC) and total height (HT), estimated visually by experienced members of the field crew to the nearest 0.5 m and crown depth (CD), calculated as the difference between HT and HC. Measurements were taken for each living tree 5-cm or greater in diameter in early successional stands and 10 cm or greater in all other stands.
For a 12.5-m x 50-m subplot extending along the major axis of the GLAS footprint, crown radius (CR) was measured in two orthogonal directions by projecting the edge of the crown to the ground and recording its horizontal distance to the trunk to the nearest 0.1 m using a tape measure (Goncalves et al., 2017). All trees were identified as to their species or genus (when species was uncertain) level and assigned a wood density value (r, oven-dry weight over green volume) derived from the literature (Chave et al., 2006; Reyes et al., 1992).
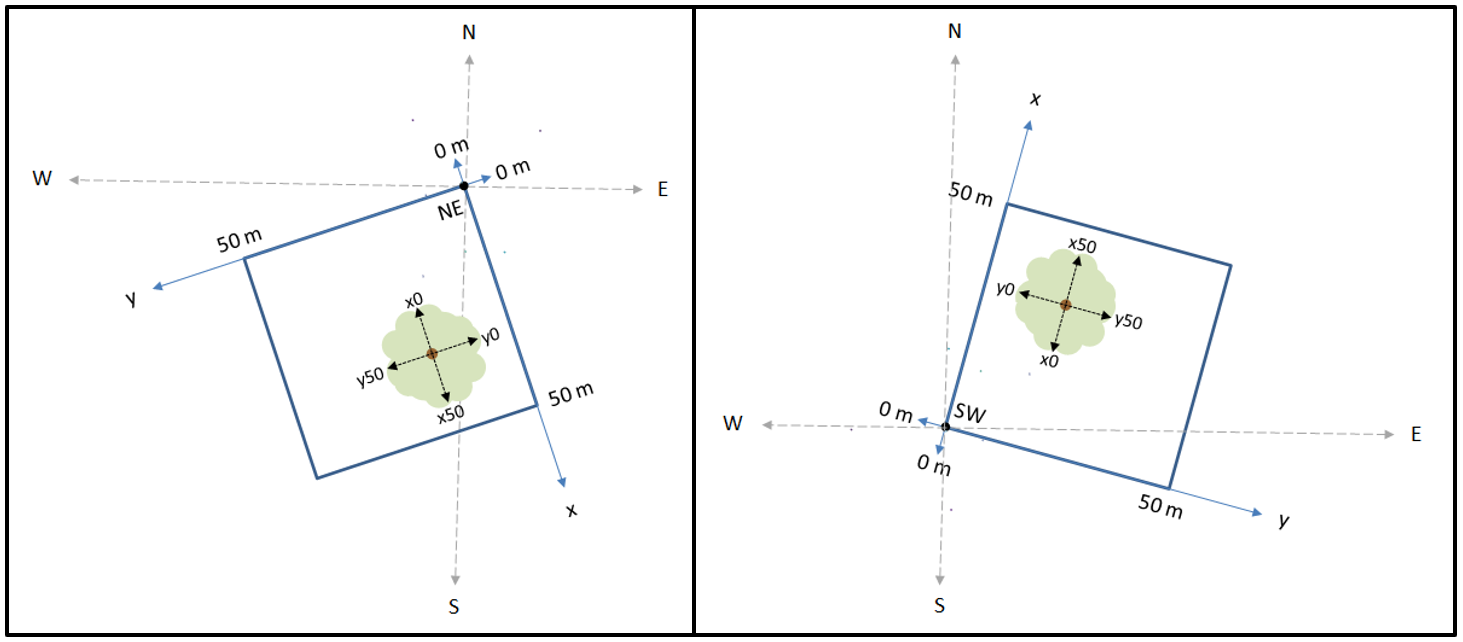
Figure 2. Study plot diagrams showing origins, NE or SW, for the local cartesian system. Tree stem locations, crown measurements, and crown coefficients are reported relative to this local x-y coordinate system.
Data Access
These data are available through the Oak Ridge National Laboratory (ORNL) Distributed Active Archive Center (DAAC).
Tree Inventory and Biometry Measurements, Tapajos National Forest, Para, Brazil, 2010
Contact for Data Center Access Information:
- E-mail: uso@daac.ornl.gov
- Telephone: +1 (865) 241-3952
References
Chave, J.; H.C. Muller-Landau,T.R. Baker, T.A. Easdale, H. ter Steege, and C.O. Webb. Regional and phylogenetic variation of wood density across 2456 neotropical tree species. Ecol. Appl. 2006, 16, 2356–2367. http://doi.org/10.1890/1051-0761(2006)016[2356:RAPVOW]2.0.CO;2
Goncalves, F., R. Treuhaft, B. Law, A. Almeida, W. Walker, A. Baccini, J. Roberto dos Santos, and P. Graca. 2017. Estimating Aboveground Biomass in Tropical Forests: Field Methods and Error Analysis for the Calibration of Remote Sensing Observations. Remote Sens. 2017, 9, 47; http://dx.doi.org/10.3390/rs9010047.
Gonçalves, F.G. Vertical Structure and Aboveground Biomass of Tropical Forests from Lidar Remote Sensing. Ph.D. Thesis, Oregon State University, Corvallis, OR, USA, November 2014.
Reyes, G., S. Brown, J. Chapman, J., and A. Lugo. Wood Densities of Tropical Tree Species; General Technical Report (GTR) SO-88; USDA Forest Service, Southern Forest Experiment Station, Institute of Tropical Forestry: New Orleans, LA, USA, February 1992. 39.