Documentation Revision Date: 2018-12-20
Data Set Version: 1
Summary
There are two data files with this dataset; one file of survey data in comma-separated format (.csv) and one compressed shapefile (.zip) with measurement plot locations. The plot locations are also provided as a companion file in .kmz format for viewing in Google Earth.
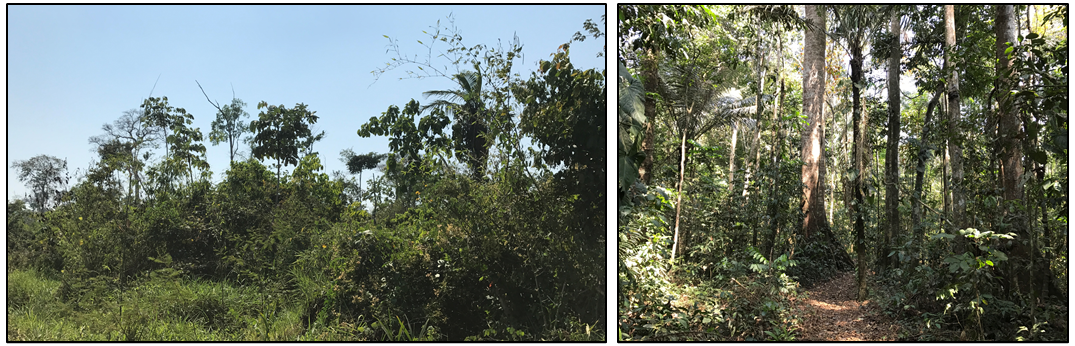
Figure 1. Photos taken in 2017 of Bonal measurement area (Area A, Transect 8, burned 2005) and Catuaba area (Area B, unburned). Photos courtesy of I. Numata.
Citation
Numata, I., S.S. da Silva, and M.A. Cochrane. 2018. Forest Inventories and DBH at Burned and Unburned Forest Sites, Acre, Brazil, 2017. ORNL DAAC, Oak Ridge, Tennessee, USA. https://doi.org/10.3334/ORNLDAAC/1654
Table of Contents
- Data Set Overview
- Data Characteristics
- Application and Derivation
- Quality Assessment
- Data Acquisition, Materials, and Methods
- Data Access
- References
Data Set Overview
This data set provides measurements of diameter at breast height (DBH) and species identification at four forest sites in the eastern side of Acre, Brazil including Bonal (A), Catuaba (B), Humaita (C) and Transacreana (D). The inventory locations include forests burned in 2005 and 2010 and nearby unburned areas. Inventory surveys were conducted in October and December 2017.
Related Data Sets:
Numata, I., M.A. Cochrane, J. Kjaersgaard, and S.S. da Silva. 2018. Forest Inventories at Burned and Unburned Tropical Forest Sites, Acre, Brazil, 2014. ORNL DAAC, Oak Ridge, Tennessee, USA. https://doi.org/10.3334/ORNLDAAC/1563
Acknowledgements:
This work was supported by the NASA Terrestrial Ecology program, Grant number: NNX14AD56G
Data Characteristics
Spatial Coverage: Four sites in Eastern Acre, Brazil
Spatial Resolution: Multiple points
Temporal Coverage: Surveys were conducted in October and December 2017
Temporal Resolution: One time sampling
Study Area (coordinates in decimal degrees)
| Site | Westernmost Longitude | Easternmost Longitude | Northernmost Latitude | Southernmost Latitude |
|---|---|---|---|---|
| Eastern Acre, Brazil | -68.147738 | -67.281765 | -9.754178 | -10.083254 |
Data File Information
There are two data files with this dataset: one file of survey data in comma-separated format (.csv) and one compressed shapefile (.zip) with measurement plot locations. The plot locations are also provided as a companion file in .kmz format for viewing in Google Earth. Two study area photos are also provided as companion files.
Table 1. File names and descriptions
| File name | Description |
|---|---|
| Forest_Inventory_Acre_2017.csv | This file provides the plot sizes, description (burned or unburned), diameter at breast height (dbh), and forest inventories with scientific and family names |
| acre_forest_inventory_plots_2017.zip | A shapefile with the plot location information |
| Companion files | |
| acre_forest_inventory_plots_2017.kmz | The plot locations provided in kmz fomat for viewing in Google Earth |
| Bonal_unburned_area.JPG | Photo of the Bonal unburned study site |
| Catuaba_unburned_area1.JPG | Photo of the Catuaba area 1 unburned study site |
Table 2. Variables in the file Forest_Inventory_Acre_2017.csv
| Column Heading | Unit/Format | Description |
|---|---|---|
| area | Identification of inventoried areas by name | |
| area_code | Identification of inventoried area by code (matches shape file) | |
| sampling_date | YYYY-MM-DD | Sampling date |
| transect | The transect ID number within an area. | |
| plot | The plot ID number within a transect | |
| plot_size | Plot dimensions | |
| easting | UTM | Plot center location in UTM (easting) |
| southing | UTM | Plot center location in UTM (northing) |
| latitude | Decimal degrees | Latitude of plot center |
| longitude | Decimal degrees | Longitude of pot center |
| burned_2005 | Binary code where 1 indicates plot burned in 2005 | |
| burned_2010 | Binary code where 1 indicates plot burned in 2010 | |
| unburned | Binary code where 1 indicates plot did not burn | |
| dbh | cm | Diameter at Breast Height, 1.3m above the ground |
| live_dead | Binary code where 1 indicates live stem | |
| life_form | Stems are identified as tree or liana | |
| scientific name | Scientific name of tree. Some “Not identified” | |
| family | Family name of tree. Some “Not identified” |
User notes:
- At the Bonal site, Transect 05, (Area A in Figure 1) plot 1 was completely cleared before the inventory could take place, therefore, the data for Transect 05 begin with plot 2.
- At the Bonal site, the transects of 2017 were in the same general location as the transects from previous inventories conducted in 2014 (see https://doi.org/10.3334/ORNLDAAC/1563), but for this study the size (larger) and the number (smaller) of the plots were different from those of 2014. The measurements are new, and do not represent repeat measurements from 2014.
Properties of the Shapefile
Projection: SIRGAS 2000 UTM Zone 19S
GEOGCS: GCS SIRGAS 2000
DATUM: Sistema de Referencia Geocentrico para las AmericaS 2000
SPHEROID: GRS 1980, 6378137.0, 298.257222101
PRIMEM: Greenwich, 0.0
UNIT: Degree, 0.0174532925199433
PROJECTION: Transverse Mercator
PARAMETER: False Easting, 500000.0
PARAMETER: False Northing, 10000000.0
PARAMETER: Central Meridian, -69.0
PARAMETER: Scale Factor, 0.9996
PARAMETER: Latitude of Origin, 0.0
UNIT: Meter, 1.0
Application and Derivation
These data can be used to characterize the post-fire recovery of forest sites from wildfires in 2005 and 2010 and the impact of fire frequency (once, twice, and unburned) on forest structure and species composition.
Quality Assessment
Sampled stems were classified as live or dead and botanically identified to species or higher taxon (genus or family) level by two botanists.
Data Acquisition, Materials, and Methods
Site Description
The study was focused on the eastern side of Acre (Figure 2) where intensive forest cover change has occurred, and remnant forests are highly fragmented. The climate type is Awi (Köppen), with annual precipitation of approximately 2000 mm and an average temperature of 25 degrees C. The dry season occurs between the months of June and September.
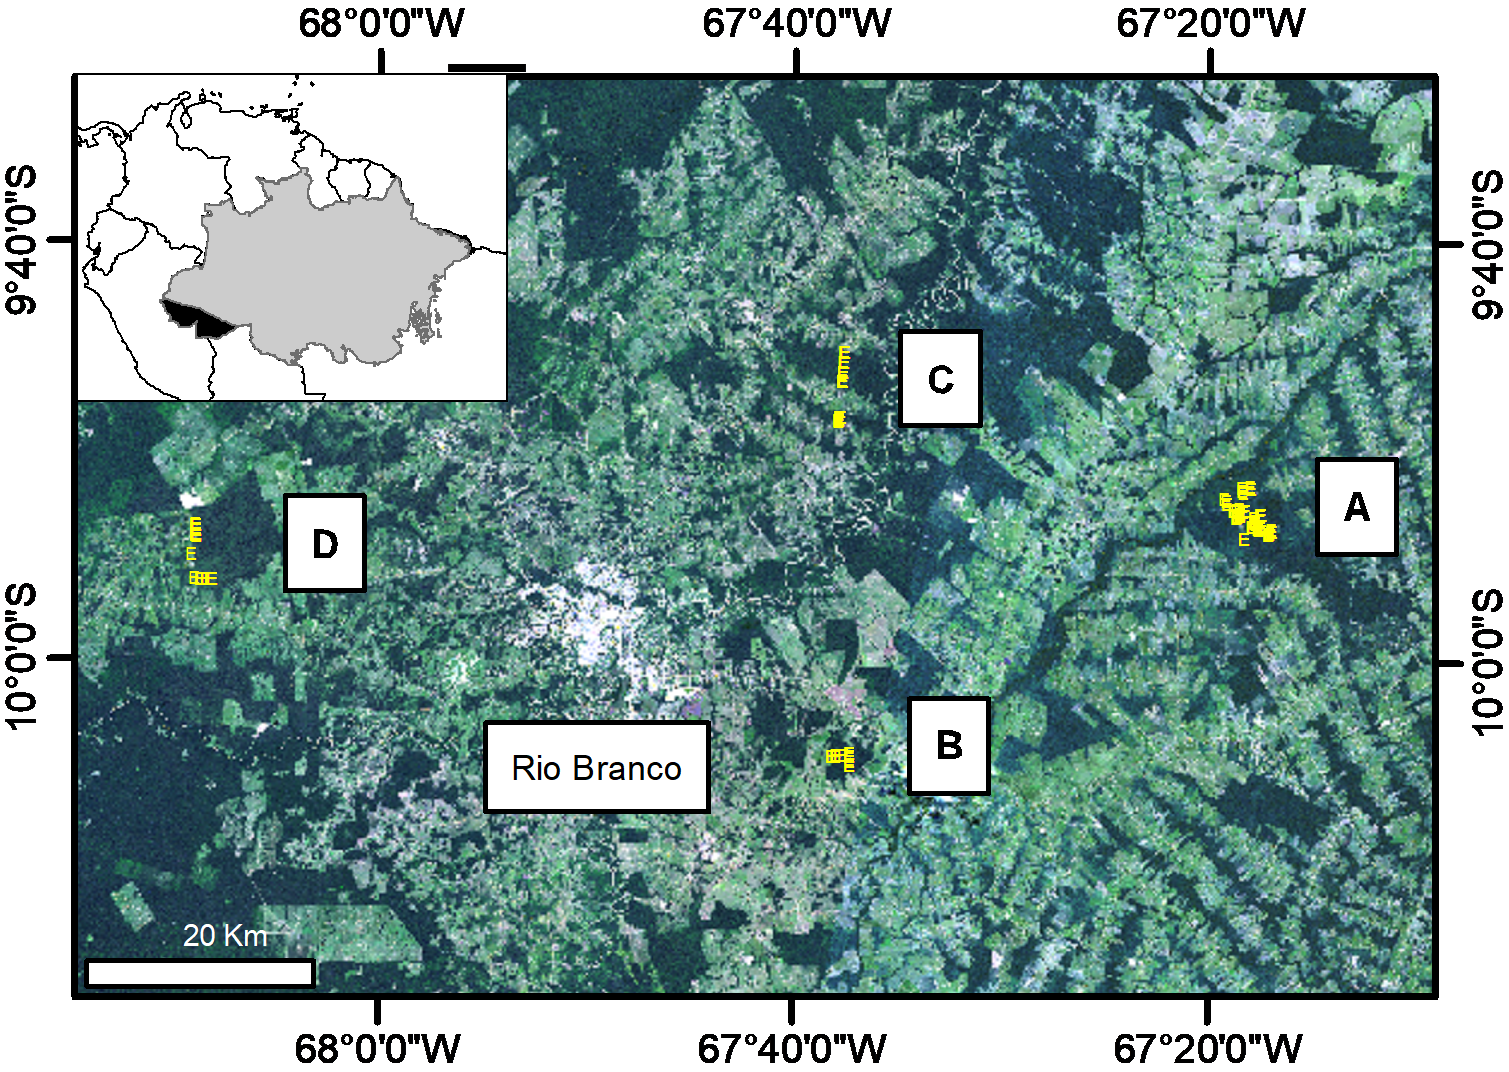
Figure 2. Site location map in the eastern side of Acre, Brazil including Bonal (A), Catuaba (B), Humaita (C,) and Transacreana (D). All sites were located within a distance of 67 km.
Surveys
Surveys were conducted in burned and unburned plots at four sites in the eastern side of Acre, Brazil including Bonal (A), Catuaba (B), Humaita (C) and Transacreana (D). All sites were located within a distance of 67 km. At the Bonal site, the transects of 2017 were in the same places of the transects from previous inventories conducted in 2014 (see related datasets), but for this study the size (larger) and the number (smaller) of the plots were different from those of 2014.
To identify burned forest areas in 2005 and 2010, Landsat time series data (Path/row: 1/67 and 2/67) were used to create annual land cover data using the method developed by Souza et al. (2013) that combines spectral mixture analysis and binary decision classification (Numata et al., 2017).
- In area A, a sustainable use area, there were nine 500-m transects (T01-T09) with three plots of 50-m x 50-m size. Sampling plots were established 500 m, 300 m and 500 m from forest edge. Another transect with three 50-m x 100-m size plots were established in the same area.
- In area B, there were eight plots of 50-km x 50-m split into two transects (four plots in each transect) within a preserved forest area by Federal University of Acre.
- There were six 50-m x 100-m plots in area C; four plots were located within a preserved forest area by Federal University of Acre and the other two plots were located on private property in a fragmented forest area.
Sampling
All stems with DBH ≥ 10 cm were measured within the sample plots. Within each plot, 25-m x 25-m and 5-m x 5-m subplots were established (in Area B these plots were 10-m x 10-m) to sample stems with DBH < 10 cm and lianas, respectively. In total, 53 plots were sampled over unburned forests (28 plots) and burned forests (25 plots). Of these burned forest plots, 13 plots in the forest burned in 2005, nine plots in the forest burned in 2010 and three plots burned in both 2005 and 2010 (Numata et al., 2017).
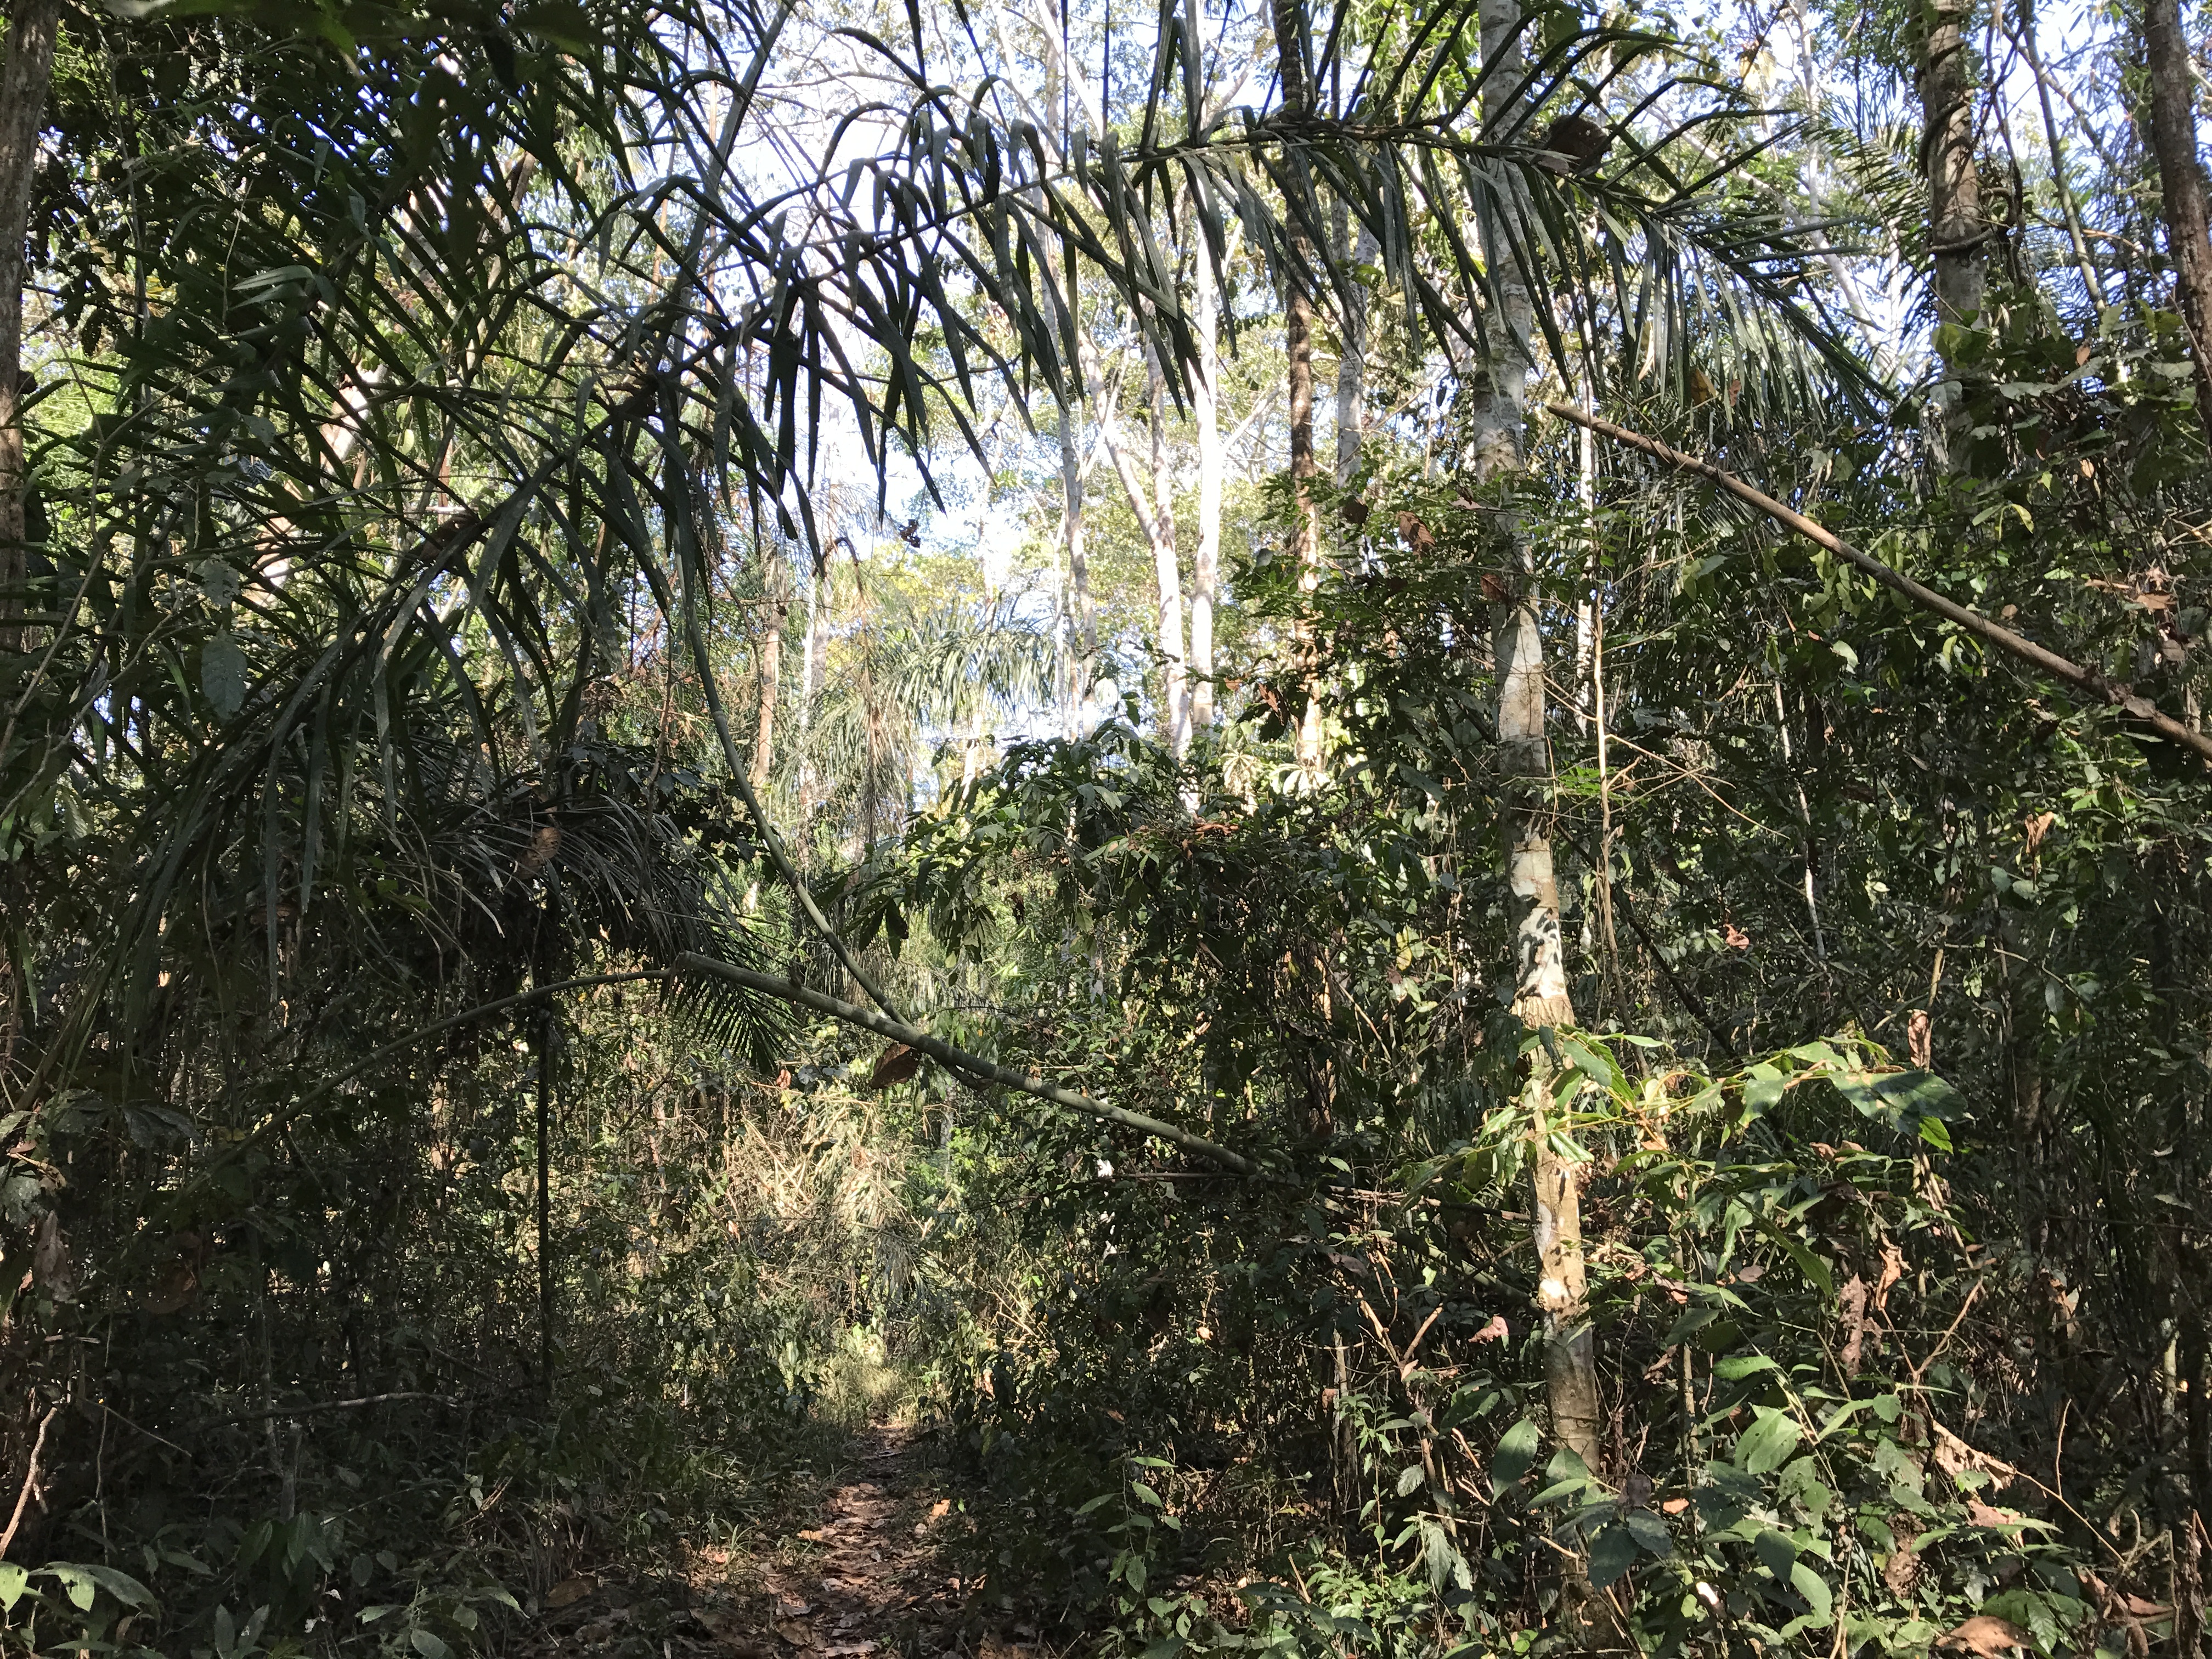
Figure 3. Humaita, Area C unburned.
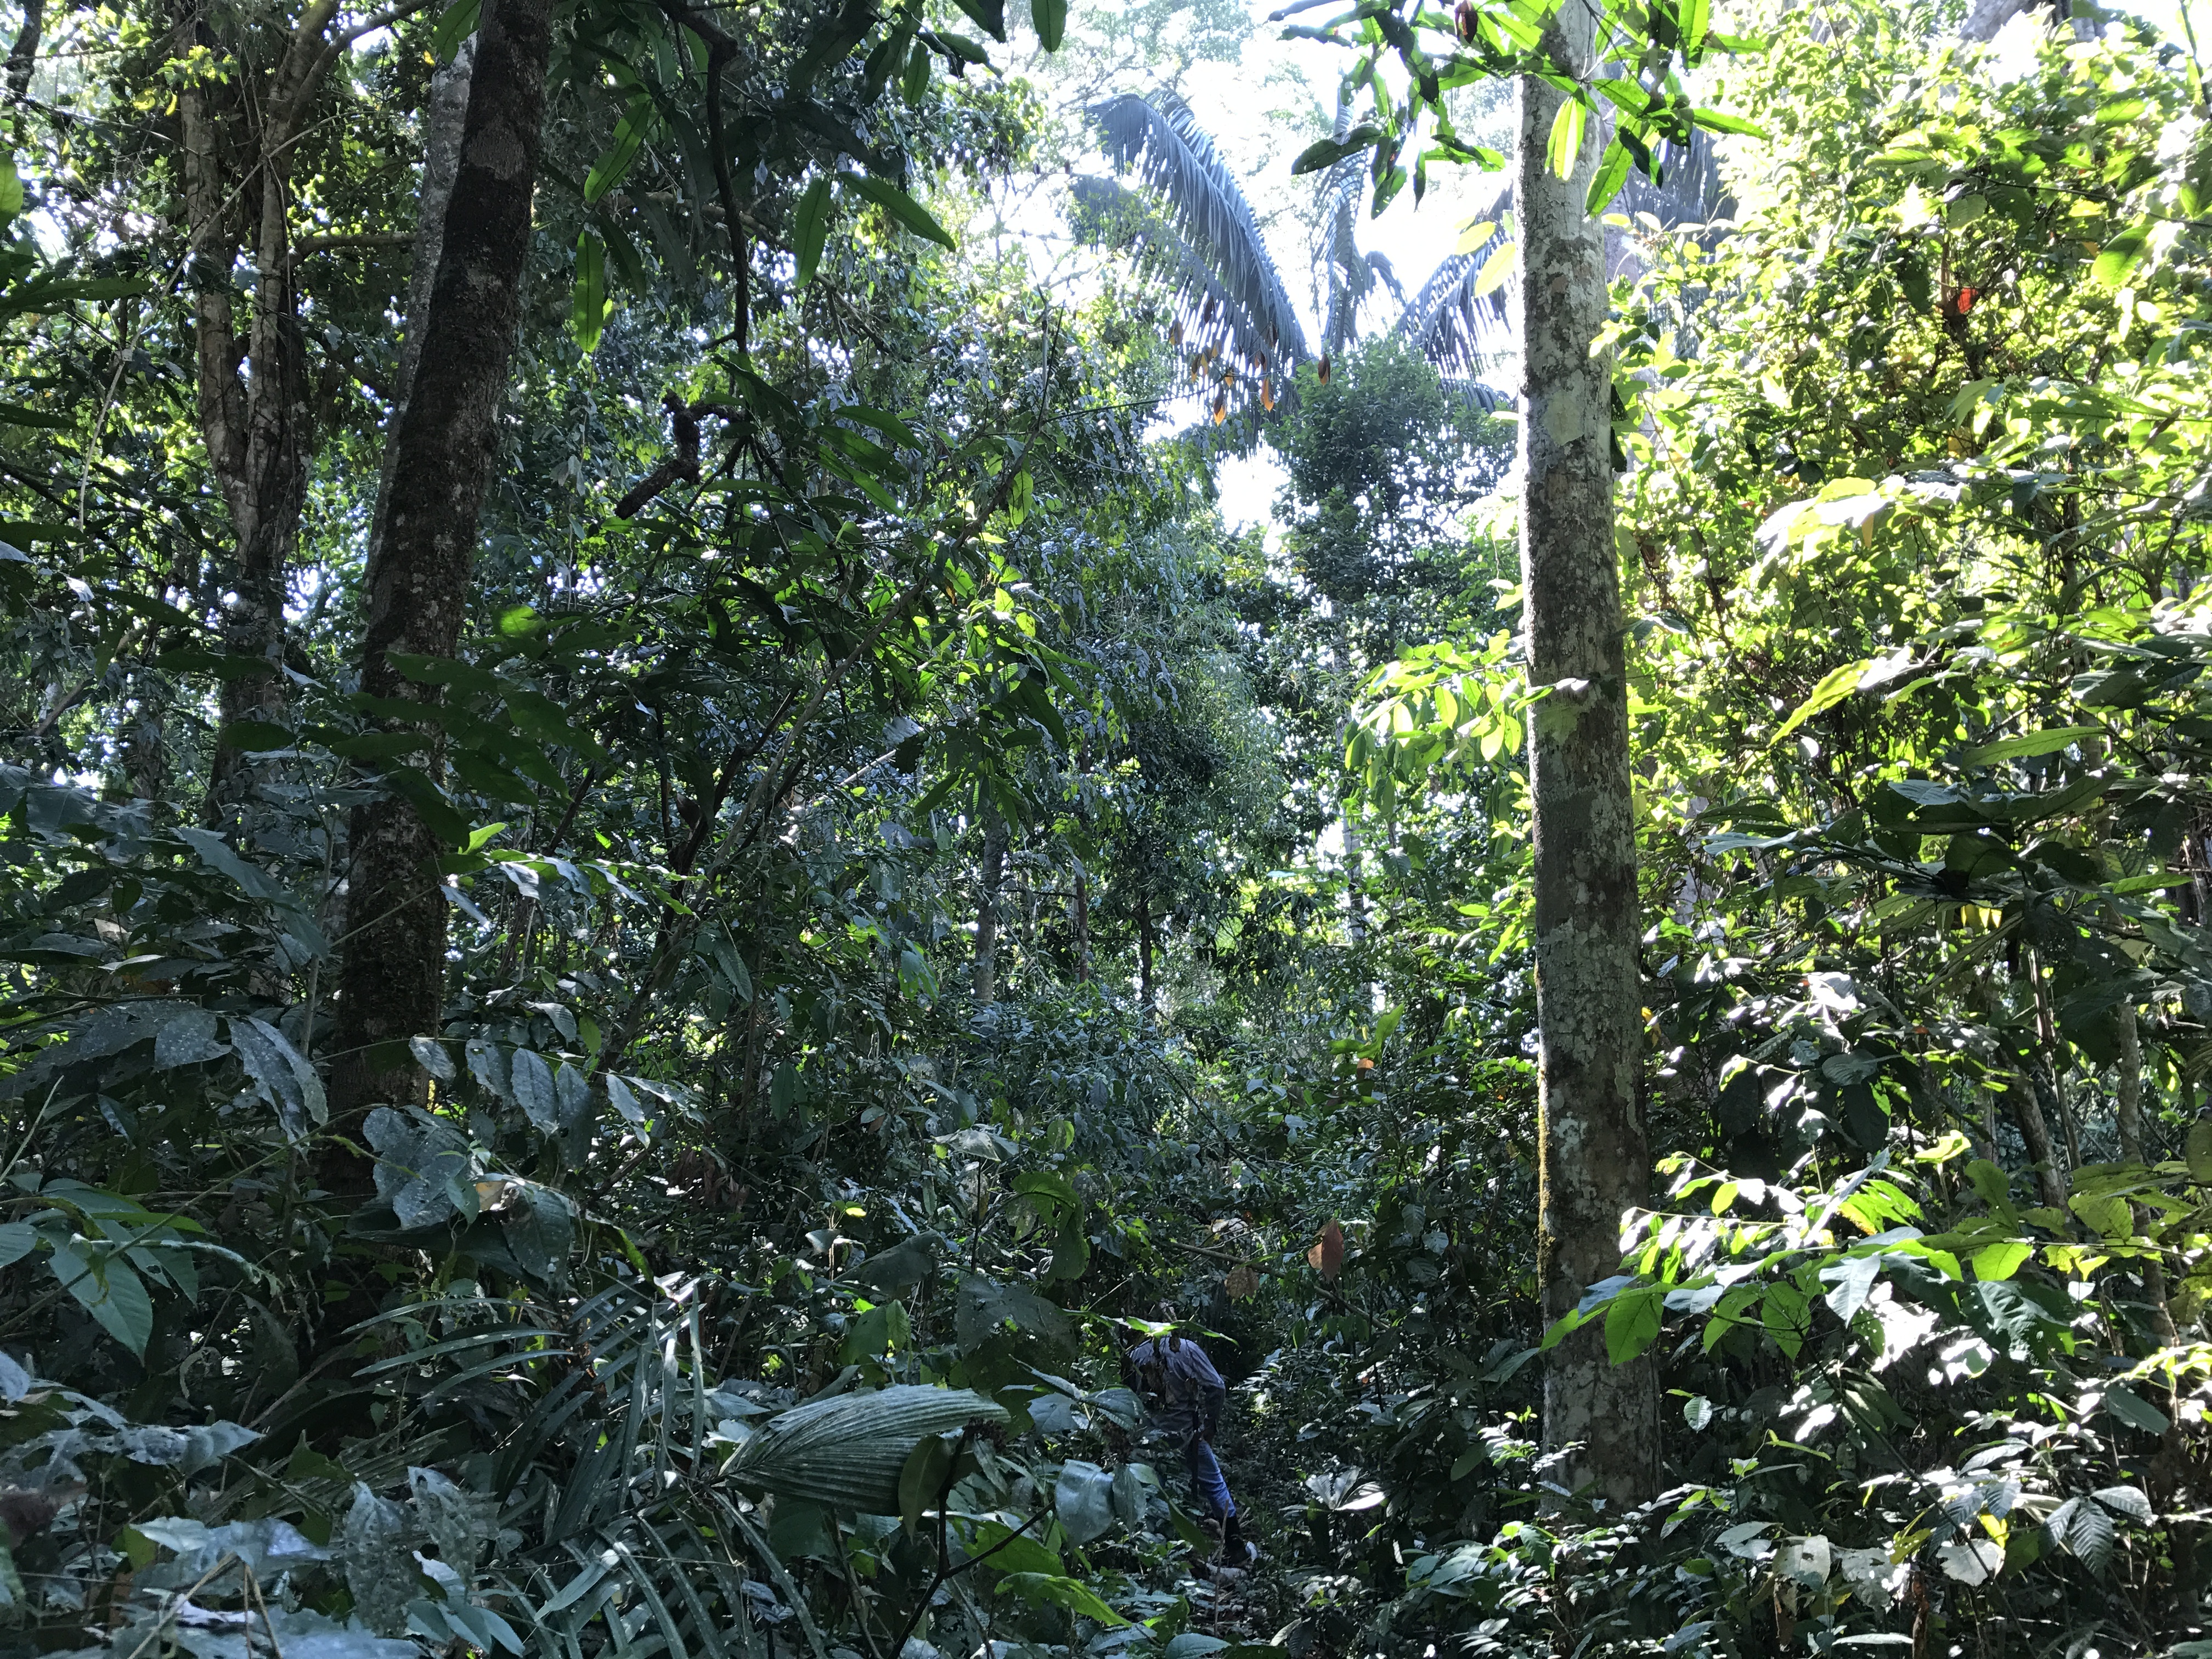
Figure 4. Transacreana, Area D unburned.
Data Access
These data are available through the Oak Ridge National Laboratory (ORNL) Distributed Active Archive Center (DAAC).
Forest Inventories and DBH at Burned and Unburned Forest Sites, Acre, Brazil, 2017
Contact for Data Center Access Information:
- E-mail: uso@daac.ornl.gov
- Telephone: +1 (865) 241-3952
References
Numata, I., Silva, S.S., Cochrane, M.A., d’Oliveira, M.V.C., 2017. “Fire and edge effects in a fragmented tropical forest landscape in the southwestern Amazon Article reference”. Forest Ecology and Management, 401, 135-146. https://doi.org/10.1016/j.foreco.2017.07.010
Souza, C.M., Siqueira, J.V., Sales, M.H., Fonseca, A.V., Ribeiro, J.G., Numata, I., Cochrane, M.A., Barber, C.P., Roberts, D.A., Barlow, J., 2013. Ten-year landsat classification of deforestation and forest degradation in the Brazilian Amazon. Rem. Sens. 5 (11), 5493–5513. https://doi/10.3390/rs5115493