Documentation Revision Date: 2026-01-30
Dataset Version: 1
Summary
This dataset holds a total of 927 files, including 916 cloud optimized GeoTIFFs, 10 files in comma separated values (CSV) format, and one map in Keyhole Markup Language (KML) format.
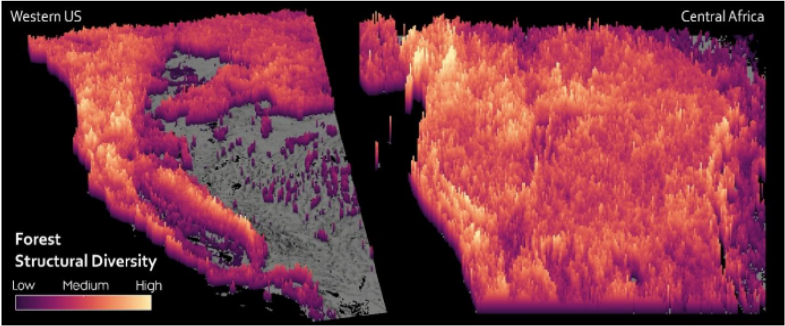
Figure 1. Forest structural diversity in western U.S. and central Africa model from GEDI and airborne lidar data. Source: Schneider et al. (2026).
Citation
Schneider, F.D., M. Dean, E.M. Ordway, M.B. Libalah, and A. Ferraz. 2026. Forest Structural Diversity of Central Africa and the Western US mapped using GEDI. ORNL DAAC, Oak Ridge, Tennessee, USA. https://doi.org/10.3334/ORNLDAAC/2481
Table of Contents
- Dataset Overview
- Data Characteristics
- Application and Derivation
- Quality Assessment
- Data Acquisition, Materials, and Methods
- Data Access
- References
Dataset Overview
This dataset holds maps of forest structure and structural diversity metrics at a range of spatial scales (1, 5, 10, 15, 20 and 25 km) derived from NASA's GEDI spaceborne lidar data collected between April 2019 and March 2023. It also holds the ALS data that provides simulated GEDI waveforms and was used to evaluate the GEDI-derived metrics. Forest structural diversity is a key component of ecosystem diversity and essential for informing conservation and restoration strategies in the face of rapid global climate change and biodiversity loss. Structural metrics include canopy height at 25th and 98th percentiles, plant area index, canopy cover, and foliage height diversity.
Structural diversity metrics include richness, evenness, and divergence. Focusing on two biodiversity global hotspots in Central Africa and the western US, GEDI-derived forest structural metrics were validated at 1 km2 resolution over 391 km2 of airborne laser scanning (ALS) coverage.GEDI-derived metrics showed robust correlations with ALS data, particularly in dense, flat Central African forests (R2 up to 0.85) compared to more variable terrains like the California Sierra Nevada (R2 up to 0.55). Structural diversity was calculated through probability density-based methods that consider multivariate forest structural metrics. GEDI canopy height (rh98), canopy cover, and foliage height diversity were effective metrics for capturing structural diversity with an R2 of 0.37 when compared to wall-to-wall ALS data at 1-km2 scale. The maps reveal high structural diversity in mid elevation and coastal forests in the western U.S. and in Central African forest-savanna transitions and volcanic ranges, aligning with ecological processes related to disturbance, wildfires and topographic gradients and aridity.
This dataset holds maps generated during the research described in Schneider et al. (2026), this article should be cited when using this dataset.
The ORNL DAAC compiles, archives, and distributes data on vegetation from local to global scales. Specific topic areas include: belowground vegetation characteristics and roots, vegetation biomass, fire and other disturbance, vegetation dynamics, land cover and land use change, vegetation characteristics, and NPP (Net Primary Production) data.
Related Publication
Schneider, F.D., M. Dean, E.M. Ordway, M.B. Libalah, and A. Ferraz. 2026. Mapping the structural diversity of Central African and Western US forests using GEDI. Remote Sensing of Environment 334:115215. https://doi.org/10.1016/j.rse.2025.115215
Acknowledgements
This project received financial support from NASA’s GEDI Science Team (grant 80NSSC21K0202, NNH20ZDA001N-GEDIST) and NASA's Biodiversity program (grant #80NSSC21K1144). F.D. Schneider was supported by the Pioneer Center for Landscape Research in Sustainable Agricultural Futures (Land-CRAFT; DNRF grant number P2). The research was carried out at the Jet Propulsion Laboratory, California Institute of Technology, under a contract with the National Aeronautics and Space Administration (80NM0018D0004).
Data Characteristics
Spatial Coverage: Western US: California, Oregon, Washington, and parts of Nevada.
Central Africa: Portions of the Democratic Republic of Congo, Republic of the Congo, Gabon, Cameroon, Equatorial Guinea, Central African Republic, Nigeria, South Sudan, Uganda, Rwanda, Burundi, Tanzania, and Angola
Spatial Resolution: GEDI derived data: 1 m to 25 km. ALS lidar simulated metrics: 25 m.
Temporal Coverage: GEDI derived data: 2019-04 to 2023-03. ALS lidar simulated metrics: 2013 (Sonoma), 2014-2015 (Central Africa), 2014-2016 (Sierra Nevada), and 2016-2017 (Los Padres)
Temporal Resolution: One time estimate
Study Areas: Latitude and longitude are given in decimal degrees.
| Site | Westernmost Longitude | Easternmost Longitude | Northernmost Latitude | Southernmost Latitude |
|---|---|---|---|---|
| western US | -125.1680 | -114.4452 | 49.2560 | 32.2346 |
| central Africa | 5.1738 | 35.9356 | 13.7565 | -13.9197 |
Data File Information
This dataset holds a total of 927 files, including 916 cloud optimized GeoTIFFs, 10 files in comma separated values (CSV) format, and one map in Keyhole Markup Language (KML) format.
GEDI derived products are provided in GeoTIFF format and include maps of forest structure traits and structural diversity metrics aggregated from GEDI waveforms (25-m resolution) at six spatial resolutions (1, 5, 10, 15, 20, 25 km) and reported as mean and standard deviation.
The file naming conventions are
ForStruc_GEDI_<region>_<stat>_rh98_rh25_pai_cover_fhd_<res>.tif for structural traits and
ForStruc_GEDI_<region>_StructuralDiversity_<res>.tif for structural diversity metrics, where
- <region> = "USwest" or "AFRICA"
- <stat> = statistical estimate: "Mean" or "Std" for standard deviation
- <res> = spatial resolution: "1km", "5km", "10km", "15km", "20km", or "25km"
The forest structure trait GeoTIFFs have five bands: GEDI rh98, GEDI rh25, plant area index (PAI), canopy cover and foliage height diversity index (FHD). The structural diversity metrics GeoTIFFS have three bands: richness, evenness and divergence.
Example file names:
ForStruc_GEDI_AFRICA_Std_rh98_rh25_pai_cover_fhd_25km.tif, ForStruc_GEDI_AFRICA_StructuralDiversity_1km.tif
ForStruc_GEDI_USwest_Mean_rh98_rh25_pai_cover_fhd_25km.tif, ForStruc_GEDI_USwest_StructuralDiversity_15km.tif
Airborne Laser Scanning (ALS) products are maps of simulated GEDI waveforms over 1-km2 grids at 25-m resolution. Each GeoTIFF has 105 bands, each corresponding to a GEDI waveform metric (Table 1). For each band, the metric name is included in the band’s Description in the GeoTIFF’s encoded metadata.
The naming convention for the ALS GeoTIFFs is ALS_<region>_<area>_<plot>_gediMetrics_<ground>.tif, where
- <region> = study area: "USwest" or "Congo"
- <area> = a study area within the region. In "Congo", this is the UTM zone (e.g., "UTM35N"). In "USwest", it is one of five location names ("Padres", "Plumas", "Sierra", "Sonoma")
- <plot> = numeric plot identifier within the study area
- <ground> = indicated whether ground returns were included ("_grnd") or excluded ("_nogrnd") in the simulated waveforms
Example file names: ALS_Congo_UTM36N_117_gediMetrics_nogrnd.tif, ALS_USwest_Padres_1_gediMetrics_grnd.tif
The ALS products are also provided in comma separated values (CSV) format. The naming convention is ALSMetrics_1kmGrid_<region>_<area>_grnd.csv. The <area> component is not included with the Congo region files.
All GeoTIFFs use coordinates in WGS 84 / NSIDC EASE-Grid 2.0 Global projection: EPSG: 6933,
PROJ4: "+proj=cea +lat_ts=30 +lon_0=0 +x_0=0 +y_0=0 +datum=WGS84 +units=m +no_defs +type=crs"
The KML file "ForStruc_USwest_boundary.kml" holds a polygon marking the boundaries of the western US study region.
Table 1. Metrics in the ALS simulated waveform GeoTIFFs and CSV files. The variable names and units follow conventions in the GEDI L2A (Dubyah et al., 2021a) and L2B (Dubyah et al., 2021b) product data dictionaries.
| Metric | Units | GeoTIFF band | Description |
|---|---|---|---|
| plot | - | - | Plot identifier (CSV files only) |
| x | m | - | x and y coordinates in the EPSG:6933 projection (CSV files only) |
| y | m | - | |
| rh100, rh98, rh95, rh90, rh85, rh80, rh75, rh50, rh25, rh10, rh5 | m | 1 - 11 | Relative height for percentiles 5% to 100% |
| cover | 1 | 12 | Total canopy cover, defined as the percent of the ground covered by the vertical projection of canopy material |
| pai | 1 | 13 | Total plant area index |
| fhd1m, fhd5m | 1 | 14 - 15 | Foliage height diversity based on 1-m and 5-m vertical resolutions |
| cvr0_5, cvr5_10, cvr10_15, cvr15_20, cvr20_25, cvr25_30, cvr30_35, cvr35_40, cvr40_45, cvr45_50, cvr50_55, cvr55_60, cvr60_65, cvr65_70, cvr70_75, cvr75_80, cvr80_85, cvr85_90, cvr90_95, cvr95_100, cvr100_105, cvr105_110, cvr110_115, cvr115_120, cvr120_125, cvr125_130, cvr130_135, cvr135_140, cvr140_145, cvr145_150 |
1 | 16 - 45 | Canopy cover per 5-m vertical layer |
| paiZ0_5, paiZ5_10, paiZ10_15, paiZ15_20, paiZ20_25, paiZ25_30, paiZ30_35, paiZ35_40, paiZ40_45, paiZ45_50, paiZ50_55, paiZ55_60, paiZ60_65, paiZ65_70, paiZ70_75, paiZ75_80, paiZ80_85, paiZ85_90, paiZ90_95, paiZ95_100, paiZ100_105, paiZ105_110, paiZ110_115, paiZ115_120, paiZ120_125, paiZ125_130, paiZ130_135, paiZ135_140, paiZ140_145, paiZ145_150 |
m2 m-2 | 46 - 75 | Plant area index per 5-m vertical layer |
| pvd0_5, pvd5_10, pvd10_15, pvd15_20, pvd20_25, pvd25_30, pvd30_35, pvd35_40, pvd40_45, pvd45_50, pvd50_55, pvd55_60, pvd60_65, pvd65_70, pvd70_75, pvd75_80, pvd80_85, pvd85_90, pvd90_95, pvd95_100, pvd100_105, pvd105_110, pvd110_115, pvd115_120, pvd120_125, pvd125_130, pvd130_135, pvd135_140, pvd140_145, pvd145_150 |
m2 m-3 | 76 - 105 | Plant area volume density per 5-m vertical layer |
Application and Derivation
This dataset provides GEDI-based structural diversity maps (richness, evenness, divergence) across multiple spatial scales (1 to 25 km). These products enable investigation of spatial patterns in forest functional diversity along gradients of climate, topography, biomass, land use, and protected-area status. The high-quality GEDI-simulated ALS dataset across 391 km2 offers a robust reference for quantifying uncertainties in GEDI measurements and supports ecological and biodiversity applications.
Quality Assessment
Uncertainty was assessed by measuring correlations between the GEDI- and ALS-derived metrics (Figure 2). Details are available in Schneider et al. (2026).
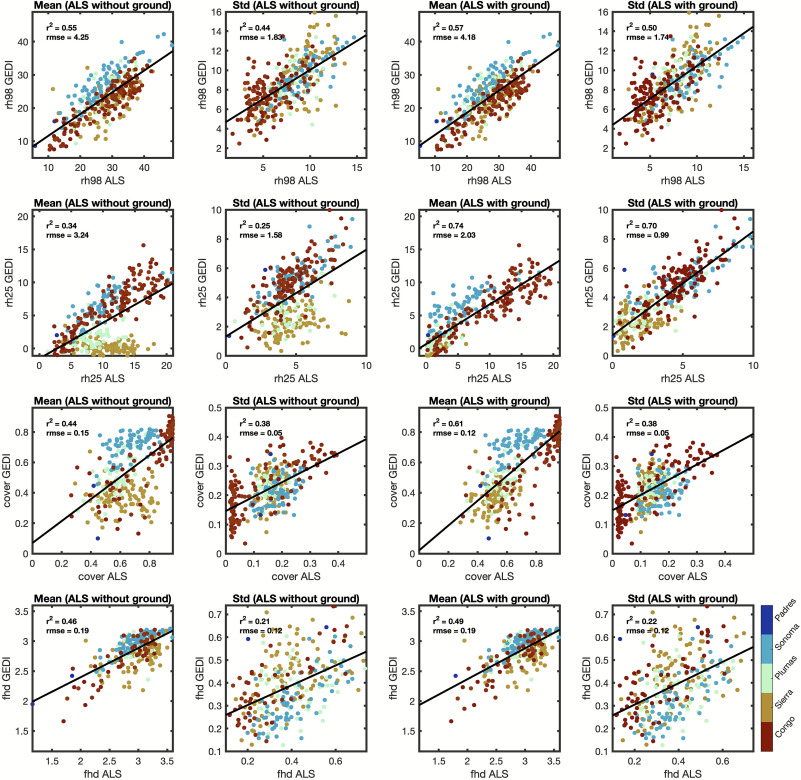
Figure 2. Scatter plots showing correlations between GEDI metrics and ALS traits calculated without and with ground returns. The points are colored by region, from dark red Congo Basin forests over Sierra Nevada, Plumas National Forest and Sonoma county to Los Padres National Forest shown in dark blue. The solid line shows the fit of a linear model, with R2 and root mean square error (rmse) shown in the top left of each panel (Schneider et al., 2026).
Data Acquisition, Materials, and Methods
Spaceborne lidar data from the NASA GEDI mission to map structural diversity at 1, 5, 10, 15, 20 and 25 km spatial scales, and ALS data were used to independently evaluate the GEDI traits and diversity metrics at 1 km spatial scale.
GEDI L2A and L2B footprint-level products were accessed, pre-processed and downloaded on Google Earth Engine (GEE). Specifically, the Google and USFS Laboratory for Applications of Remote Sensing in Ecology (LARSE) L2A and L2B version 2 products that have been gridded at 25 m spatial resolution and aggregated monthly from April 2019 to March 2023 (Dubayah et al., 2021a, Dubayah et al., 2021b) were used for this analysis. Data were filtered by only selecting pixels with an L2A and L2B quality flag of 1, a leaf off flag of 0, and a Landsat tree cover greater or equal to 30%.
Publicly available ALS data in the Congo rainforest and across California were obtained, with a point density >4 points m−2 and a geographic extent suitable to characterize wall-to-wall structural traits at 1 km2 plots that overlap with the GEDI 1 km grid on the NSIDC EASE-Grid 2.0 Global projection (EPSG:6933). The Congo data were from 2014-2015 (Xu et al., 2017). In the western US, four datasets were used that span the Sierra Nevada mountain range, including Yosemite and Kings Canyon National Parks as well as Plumas National Forest, Los Padres and Angeles National Forests, and coastal redwoods and oak woodlands in Sonoma county. The NASA-JPL ASO dataset collected in the Sierra Nevada in 2014– 2016 (Ferraz et al., 2020) was also processed to simulate GEDI structural traits and diversity (Schneider et al., 2020).
Detailed methods are available in Schneider et al. (2026).
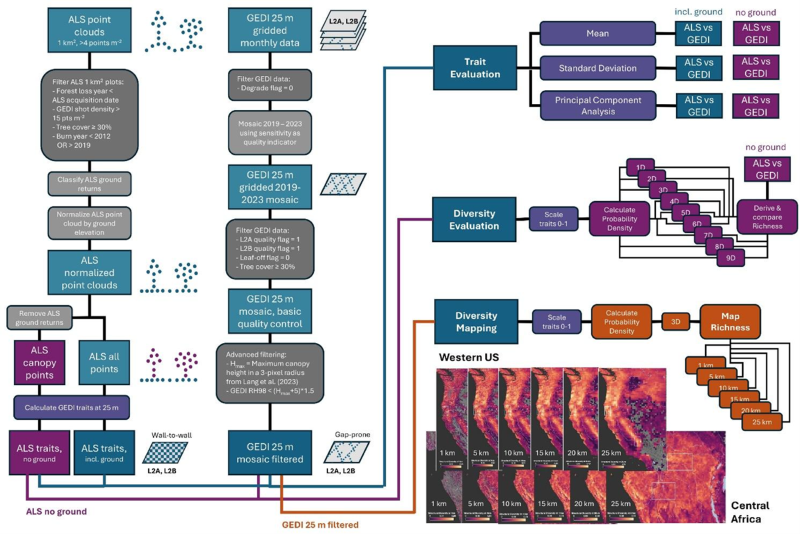
Figure 3. Workflow illustrating the methods and processing steps to evaluate GEDI traits and diversity metrics against Airborne laser scanning (ALS), and to map structural diversity using GEDI. ALS and GEDI data processing and filtering steps are shown on the left. The right side illustrates trait and diversity evaluations between ALS and GEDI at 1 km2 spatial resolution and the mapping of forest structural diversity patterns at 1 – 25 km2 spatial resolution (Schneider et al., 2026).
Data Access
These data are available through the Oak Ridge National Laboratory (ORNL) Distributed Active Archive Center (DAAC).
Forest Structural Diversity of Central Africa and the Western US mapped using GEDI
Contact for Data Center Access Information:
- E-mail: uso@daac.ornl.gov
- Telephone: +1 (865) 241-3952
References
Dean, M., A. Ferraz, F.D. Schneider, and E.M. Ordway. 2026. Systematic evaluation of GEDI-derived forest structure mapping in the tropics. Remote Sensing of Environment (in revision).
Dubayah, R., M. Hofton, J.Blair, J. Armston, H. Tang, and S. Luthcke. 2021a. GEDI L2A Elevation and Height Metrics Data Global Footprint Level V002. NASA Land Processes Distributed Active Archive Center. https://doi.org/10.5067/GEDI/GEDI02_A.002
Dubayah, R., H. Tang, J. Armston, S. Luthcke, M. Hofton, and J. Blair. 2021b. GEDI L2B Canopy Cover and Vertical Profile Metrics Data Global Footprint Level V002. NASA Land Processes Distributed Active Archive Center. https://doi.org/10.5067/GEDI/GEDI02_B.002
Ferraz, A., F. Schneider, K. Bormann, S. Saatchi, D. Schimel, and T. Painter. 2020, July 22. Data from: From lidar waveforms to vegetation products: 7380 km2 of high-resolution airborne and simulated GEDI data over Sierra Nevada, California. Dryad. https://doi.org/10.5068/D16T06
GEDI L2A Product Data Dictionary. https://lpdaac.usgs.gov/documents/586/gedi_l2a_dictionary_P001_v1.html
GEDI L2B Product Data Dictionary. https://lpdaac.usgs.gov/documents/587/gedi_l2b_dictionary_P001_v1.html
Schneider, F.D., M. Dean, E.M. Ordway, M.B. Libalah, and A. Ferraz. 2026. Mapping the structural diversity of Central African and Western US forests using GEDI. Remote Sensing of Environment 334:115215. https://doi.org/10.1016/j.rse.2025.115215
Schneider, F.D., A. Ferraz, S. Hancock, L.I. Duncanson, R.O. Dubayah, R.P. Pavlick, and D.S. Schimel. 2020. Towards mapping the diversity of canopy structure from space with GEDI. Environmental Research Letters 15:115006. https://doi.org/10.1088/1748-9326/ab9e99
Xu, L., S.S. Saatchi, A. Shapiro, V. Meyer, A. Ferraz, Y. Yang, J.-F. Bastin, N. Banks, P. Boeckx, H. Verbeeck, S.L. Lewis, E.T. Muanza, E. Bongwele, F. Kayembe, D. Mbenza, L. Kalau, F. Mukendi, F. Ilunga, and D. Ebuta. 2017. Spatial distribution of carbon stored in forests of the Democratic Republic of Congo. Scientific Reports 7:15030. https://doi.org/10.1038/s41598-017-15050-z