Documentation Revision Date: 2024-03-11
Dataset Version: 2
Summary
This GPP product is referred to as FluxSat v2.0, where FluxSat refers to data derived using FLUXNET eddy covariance tower site data and coincident satellite data. The FluxSat approach is described in Joiner and Yoshida (2020).
This dataset includes 245 files in netCDF version 4 (*.nc4) format. The files provide daily GPP data for each month in the period 2000-03-01 to the recent past.
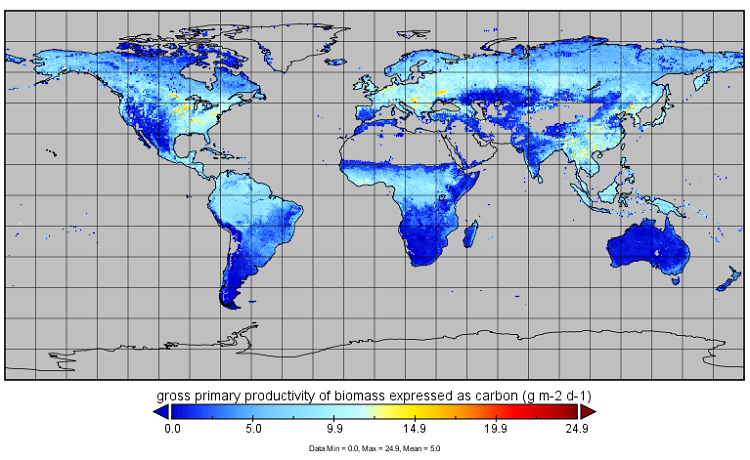
Figure 1. Gross primary production expressed as carbon (g m-2 d-1) for July 1st, 2019.
Citation
Joiner, J., and Y. Yoshida. 2021. Global MODIS and FLUXNET-derived Daily Gross Primary Production, V2. ORNL DAAC, Oak Ridge, Tennessee, USA. https://doi.org/10.3334/ORNLDAAC/1835
Table of Contents
- Dataset Overview
- Data Characteristics
- Application and Derivation
- Quality Assessment
- Data Acquisition, Materials, and Methods
- Data Access
- References
- Dataset Revisions
Dataset Overview
This dataset provides global gridded daily estimates of gross primary production (GPP) and uncertainties at 0.05-degree resolution for the period 2000-03-01 to the recent past. The GPP was derived from the MODerate-resolution Imaging Spectroradiometer (MODIS) instruments on the NASA Terra and Aqua satellites using the MCD43C4v006 Nadir Bidirectional Reflectance Distribution Function (BRDF)-Adjusted Reflectances (NBAR) product as input to neural networks that were used to globally upscale GPP estimated from selected FLUXNET 2015 eddy covariance tower sites. Additional data will be added periodically.
This GPP product is referred to as FluxSat v2.0, where FluxSat refers to data derived using FLUXNET eddy covariance tower site data and coincident satellite data. The FluxSat approach is described in Joiner and Yoshida (2020).
Related Publications
Joiner, J., and Y. Yoshida. 2020. Satellite-based reflectances capture large fraction of variability in global gross primary production (GPP) at weekly time scales. Agricultural and Forest Meteorology 291:108092. https://doi.org/10.1016/j.agrformet.2020.108092
Joiner, J., Y. Yoshida, Y. Zhang, G. Duveiller, M. Jung, A. Lyapustin, Y. Wang, and C.J. Tucker. 2018. Estimation of Terrestrial Global Gross Primary Production (GPP) with Satellite Data-Driven Models and Eddy Covariance Flux Data. Remote Sensing 10(9):1346. https://doi.org/10.3390/rs10091346
Related Datasets
Joiner, J., Y. Yoshida, P. Koehler, C. Frankenberg, and N.C. Parazoo. 2019. L2 Daily Solar-Induced Fluorescence (SIF) from ERS-2 GOME, 1995-2003. ORNL DAAC, Oak Ridge, Tennessee, USA. https://doi.org/10.3334/ORNLDAAC/1758
Data Characteristics
Spatial Coverage: Global
Spatial Resolution: 0.05 degree
Temporal Coverage: 2000-03-01 to 2020-08-01
Temporal Resolution: Daily
Study Area: Latitude and longitude are given in decimal degrees.
| Site | Westernmost Longitude | Easternmost Longitude | Northernmost Latitude | Southernmost Latitude |
|---|---|---|---|---|
| Global | -180 | 180 | 90 | -90 |
Data File Information
This dataset includes 245 files in netCDF format (.nc4). The files provide daily GPP data for each month in the period 2000-03-01 to the recent past. Additional data will be added periodically. The files are named GPP_FluxSat_daily_v2_YYYYMM.nc4 (e.g., GPP_FluxSat_daily_v2_202007.nc4), where YYYYMM represents the year and month of the data.
This product is referred to as "GPP FluxSat" Version 2.0, as its data were derived from FLUXNET eddy covariance tower site data (https://fluxnet.org/data/fluxnet2015-dataset/data-processing/) and coincident satellite data.
Data File Details
Table 1. Variable names and descriptions.
| Variable Name | No Data Value | Description |
|---|---|---|
| GPP | -9999 | Gross primary production of biomass expressed as carbon in g m-2 d-1 |
| GPP uncertainty | -9999 | Gross primary production of biomass expressed as carbon standard error in g m-2 d-1 |
| FPAR_LUE_constitutive | -9999 | Fraction of absorbed PAR multiplied by constitutive Light Use Efficiency (LUE) scaled to produce values in approximately the zero to one range |
| Latitude | Latitude at the center of the cell in degrees north (WGS84) | |
| Longitude | Longitude ar the center of the cell in degrees east (WGS84) | |
| BRDF_Quality | -1 | Derived from the MODIS MCD43C4v006 product with additional settings for gap-filled and suspect data 0 = best quality 100 percent with full inversions 1 = good quality 75 percent or more with best full inversions and 90 percent or more with full inversions 2 = relative good quality 75 percent or more with full inversions 3 = mixed 75 percent or less full inversions and 25 percent or less fill values 4 = all magnitude inversions or 50 percent or less fill values 5 = 50 percent or more fill values 6 = suspect GPP clipped 7 = missing data filled with climatology 8 = missing data with low PAR, zero-filled |
| Percent_Inputs | -1 | Percent of processed finer resolution data that contributed to the 0.05-degree spatial resolution (i.e., the Climate Modeling Grid); derived from the MODIS MCD43C4v006 product |
| Time | Middle of each day since 2000-01-01 00:00:00. |
Application and Derivation
These data could be used for global carbon cycle modeling and agricultural applications.
Quality Assessment
Known Caveats
- The product is only as good as the input MODIS MCD43C4v006 produce reflectances. Any issues with those reflectances will alias into the final GPP product.
- Data are provided for the pre-Aqua period (i.e., prior to July 2002) in which only the Terra satellite is used. The data quality, particularly in the partial year 2000 (Terra only) is not as good as the period from 2003 (Aqua and Terra) onwards. Users are cautioned when using the Terra-only period data.
- There are a very small fraction of spurious values that can be seen as discontinuities in time series. These data points are usually associated with a low percent of inputs as seen in the variable Percent_Inputs (typically <30%) and are associated with a BRDF_Quality value of 5. However, because there are also many good data points with the same BRDF_quality values, all values have been left in the dataset. Users are cautioned when using data with low percent inputs.
- A grid box GPP uncertainty is derived for each point based on machine learning. The uncertainty is conservative in that it includes representativeness error in the training set (see Joiner and Yoshida, 2020). Note that errors may be spatially and/or temporally correlated.
Data Acquisition, Materials, and Methods
The provided GPP product (FluxSat v2.0*) was computed at the spatio-temporal resolution of the MODIS MCD43C4v006 product (daily at 0.05-degree spatial resolution, the Climate Modeling Grid). MCD43C4v006 was derived from the MODIS (MODerate-resolution Imaging Spectroradiometer) instruments on the NASA Terra and Aqua satellites as the Nadir Bidirectional Reflectance Distribution Function (BRDF)-Adjusted Reflectances (NBAR) (https://lpdaac.usgs.gov/products/mcd43c4v006/). MCD43C4v006 was produced with a rolling 16-day window, so data are not truly daily, but are weighted towards the day of interest.
This GPP product was derived from machine learning with MODIS reflectances input to neural networks that were used to globally upscale GPP from FLUXNET 2015 eddy covariance tower sites data (https://fluxnet.org/data/fluxnet2015-dataset/data-processing/). Only MODIS bands 1-7 were used along with an estimate of top-of-atmosphere PAR.
Note that the GPP data were gap-filled when necessary using a GPP climatology developed from the full dataset. Gap-filled data are noted within the BRDF quality flag. GPP uncertainties for gap-filled data are set to 2g C m-2 day-1. When daily PAR is very low (typical of dark winter days), GPP gap-filled values and uncertainties are set to zero.
* This product is referred to as FluxSat Version 2.0, as its data were derived from FLUXNET eddy covariance tower site data (https://fluxnet.org/data/fluxnet2015-dataset/data-processing/) and coincident satellite data. The FluxSat approach is described in Joiner and Yoshida (2020).
FluxSat Product Background
For clarification, the current GPP product was derived using a similar process to the FluxSat v1.0 product as described in Joiner et. al. (2018) but with important differences. Generally:
- FluxSat v2.0 used MODIS MCD43C4v006 reflectances with 0.05 degree resolution (https://lpdaac.usgs.gov/products/mcd43c4v006/) rather than the 0.008 degree (1 km) (https://www.umb.edu/spectralmass/terra_aqua_modis/v006/mcd43d_cmg_30_arc_second_products).
- FluxSat v2.0 used MODIS bands 1-7 along with an estimate of top-of-atmosphere PAR trained with FLUXNET 2015 eddy covariance tower sites data. FluxSat v1.0 used a linear combination of bands to estimate GPP and validated with FLUXNET 2015 eddy covariance tower sites data.
- The same training FLUXNET 2015 eddy covariance tower site data were used for both products.
Previous FluxSat Version
FluxSat v1.0 data as described in Joiner et al. (2018) were previously available on the NASA Aura Validation Data Center (AVDC) (https://avdc.gsfc.nasa.gov/). The v1.0 data have been superseded and removed. The v2.0 data are now also available at AVDC at a lower resolution (MERRA-2 grid) for users who don’t need the high-resolution product and at 5 km resolution from the ORNL DAAC (current product).
Data Access
These data are available through the Oak Ridge National Laboratory (ORNL) Distributed Active Archive Center (DAAC).
Global MODIS and FLUXNET-derived Daily Gross Primary Production, V2
Contact for Data Center Access Information:
- E-mail: uso@daac.ornl.gov
- Telephone: +1 (865) 241-3952
References
Joiner, J., and Y. Yoshida. 2020. Satellite-based reflectances capture large fraction of variability in global gross primary production (GPP) at weekly time scales. Agricultural and Forest Meteorology 291:108092. https://doi.org/10.1016/j.agrformet.2020.108092
Joiner, J., Y. Yoshida, Y. Zhang, G. Duveiller, M. Jung, A. Lyapustin, Y. Wang, and C.J. Tucker. 2018. Estimation of Terrestrial Global Gross Primary Production (GPP) with Satellite Data-Driven Models and Eddy Covariance Flux Data. Remote Sensing 10(9):1346. https://doi.org/10.3390/rs10091346
Dataset Revisions
| Daymet Product Version | ORNL DAAC Release Date | Description |
|---|---|---|
| 2.0 | March 11, 2024 | Missing time and time bounds values were added to the file GPP_FluxSat_daily_v2_200106.nc4 |
| 2.0 | March 15, 2021 | First archive of data at the ORNL DAAC. |
| 1.0 | n/a | Initial version as described in section 5 under Previous FluxSat Version. Not archived at the ORNL DAAC. |