Documentation Revision Date: 2025-05-31
Dataset Version: 1
Summary
There are 864 files in plain text format.
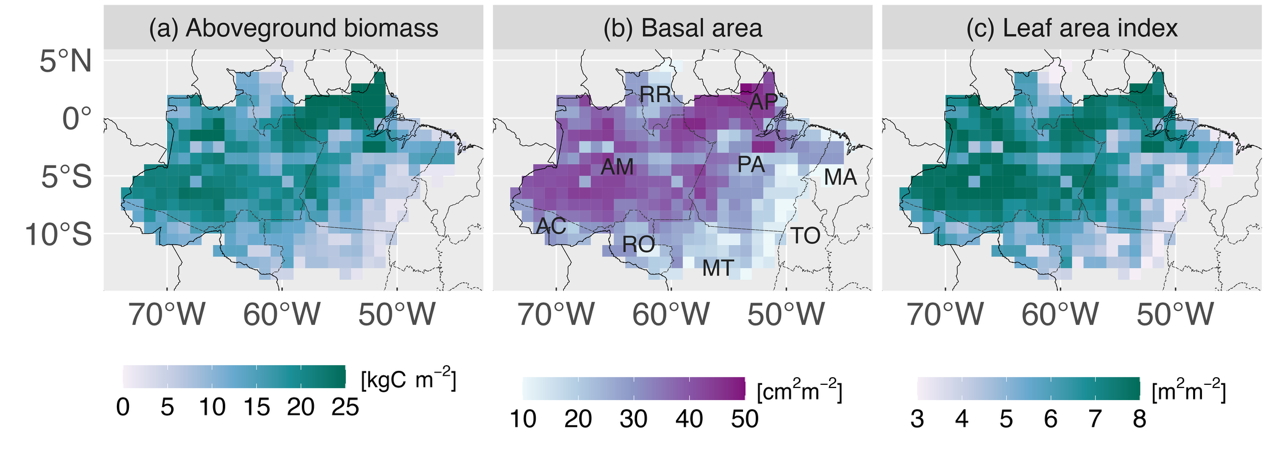
Grid-cell averages of multiple forest structure variables derived from airborne lidar through the approach described in Longo et al. (2020), and used as initial conditions for the Ecosystem Demography Model (ED2): (a) aboveground biomass carbon density, (b) basal area, and (c) leaf area index. Brazilian states overlapping with the Amazon biome indicated in panel (b): Acre (AC), Amapa (AP), Amazonas (AM), Maranhao (MA), Mato Grosso (MT), Para (PA), Rondonia (RO), Roraima (RR), and Tocantins (TO). Source: Longo et al. (2025).
Citation
Longo, M., M.M. Keller, L.M. Kueppers, K.W. Bowman, O. Csillik, A. Ferraz, P.R. Moorcroft, J.P. Ometto, B.S. Soares-Filho, X. Xu, M.L.R. de Assis, E.B. Gorgens, E.J.L. Larson, J.F. Needham, E.M. Ordway, F.R.S. Pereira, E.R. Pinage, L. Sato, L. Xu, and S.S. Saatchi. 2025. Amazon Forest Structure from Airborne Lidar, ED2 Initial Condition Files, 2016. ORNL DAAC, Oak Ridge, Tennessee, USA. https://doi.org/10.3334/ORNLDAAC/2412
Table of Contents
- Dataset Overview
- Data Characteristics
- Application and Derivation
- Quality Assessment
- Data Acquisition, Materials, and Methods
- Data Access
- References
Dataset Overview
This dataset holds regional forest structure characteristics across the Brazilian Amazon that were derived from 545 airborne lidar transects (300 x 12500 m each) acquired during the Amazon Biomass Estimation Project (EBA2016) campaign in 2016. These datasets contain vertical distributions of stem number density, aboveground biomass and potential leaf area index for over 1,300,000 columns (50 x 50 m each) that were aggregated into 288 grid cells (1 x 1 degree). The data are provided in text format that is fully compatible with the initial conditions files for initializing the Ecosystem Demography Model (ED2). The ED2 model is openly available at https://github.com/EDmodel/ED2, and the version used with the provided dataset is archived in Longo et al. (2025)
The ORNL DAAC compiles, archives, and distributes data on vegetation from local to global scales. Specific topic areas include: belowground vegetation characteristics and roots, vegetation biomass, fire and other disturbance, vegetation dynamics, land cover and land use change, vegetation characteristics, and NPP (Net Primary Production) data.
Related Publication
Longo, M., M. Keller, L. M. Kueppers, K. Bowman, O. Csillik, A. Ferraz, P. R. Moorcroft, J. P. Ometto, B. S. Soares-Filho, X. Xu, M. L. F. de Assis, E. B. Görgens, E. J. L. Larson, J. F. Needham, E. M. Ordway, F. R. S. Pereira, E. Rangel Pinagé, L. Sato, L. Xu, and S. Saatchi. 2025. Degradation and deforestation increase the sensitivity of the Amazon Forest to climate extremes. Environmental Research Letters 25(20), 054024, doi: 10.1088/1748-9326/adc58c
Related Datasets
dos-Santos, M.N., M.M. Keller, and D.C. Morton. 2019. LiDAR Surveys over Selected Forest Research Sites, Brazilian Amazon, 2008-2018. ORNL DAAC, Oak Ridge, Tennessee, USA. https://doi.org/10.3334/ORNLDAAC/1644
dos-Santos, M.N., M.M. Keller, E.R. Pinage, and D.C. Morton. 2022. Forest Inventory and Biophysical Measurements, Brazilian Amazon, 2009-2018. ORNL DAAC, Oak Ridge, Tennessee, USA. https://doi.org/10.3334/ORNLDAAC/2007
- These two datasets were used to calibrate the method used to generate the included data.
Acknowledgements
This project received financial support from NASA’s Terrestrial Ecology program (grant NNH20ZDA001N-GEDIST).
Data Characteristics
Spatial Coverage: Brazilian Amazon
Spatial Resolution: 1° (grid cell) and sub-grid samples (50 m each)
Temporal Coverage: 2016-01-01 to 2016-12-31
Temporal Resolution: One time estimate
Study Areas: Latitude and longitude are given in decimal degrees.
| Site | Westernmost Longitude | Easternmost Longitude | Northernmost Latitude | Southernmost Latitude |
|---|---|---|---|---|
| Brazilian Amazon | -74.0 | -45.0 | 5.0 | -14.0 |
Data File Information
There are 864 files in plain text format. The files have extensions sss (site file), pss (patch file), and css (cohort file). They are formatted following the Ecosystem Demography Model convention for multi-site initial conditions (ED-2.2, 2025; Longo et al., 2019).
The file naming convention is amzbr_<grid>.lat<latitude>lon<longitude>.<ext>, where
- <grid> = a four digit grid cell identifier (e.g., "0004")
- <latitude> = latitude of grid cell center in decimal degrees (e.g., "-12.5")
- <longitude> = longitude of grid cell center in decimal degrees (e.g., "-60.5")
- <ext> = suffix indicating file type: "sss" for site information, "pss" for patch data, and "css" for cohort characteristics
Example file names: amzbr_0004.lat-12.5lon-62.5.css, amzbr_0004.lat-12.5lon-62.5.pss, amzbr_0004.lat-12.5lon-62.5.sss
For example, the file amzbr_0006.lat-12.5lon-60.5.css contains the cohort-level forest structure for grid cell ID 6, located at 12.5 degrees S and 60.5 degrees W. Note that not every grid cell identifier between 1 and 350 exists, because some grid cells had no overlap with any lidar transect. The contents of each patch, site, and cohort file are described in Tables 1-3.
Table 1. Variables in the site files (*.sss).
| Variable | Unit | Description |
|---|---|---|
| site | - | Unique site identifier, consistent with pss/css files for the same grid cell |
| area | 1 | Fraction of the grid cell area represented by site |
| depth | m | Soil depth to bedrock (Pelletier et al., 2016) |
| nscol | - | Soil color class (Lawrence et al., 2007) that the albedo. Possible values go from 1 to 20, with 1 being the class with the highest albedo, and 20 being the one with the lowest albedo. |
| ntext | - | Soil texture class (Poggio et al., 2021). Possible values, based on ED2 defaults (Longo et al., 2019) are: 1. Sand, 2. Loamy sand, 3. Sandy loam, 4. Silt loam, 5. Loam, 6. Sandy clay loam, 7. Silty clay loam, 8. Clay loam, 9. Sandy clay, 10. Silty clay, 11. Clay, 14. Silt, 15. Heavy clay, 16. Clayey sand, 17. Clayey silt |
| sand | 1 | Sand fraction (Poggio et al., 2021) |
| clay | 1 | Clay fraction (Poggio et al., 2021) |
| slsoc | kg kg−1 | Mass fraction of soil organic carbon (Poggio et al., 2021) |
| slph | pH | Soil acidity (Poggio et al., 2021) |
| slcec | mol kg−1 | Cation exchange capacity (Poggio et al., 2021) |
| sldbd | kg m−3 | Dry bulk density (Poggio et al., 2021) |
| elevation | m | Terrain elevation (dummy value, reserved field for future ED2-TOPMODEL implementation) |
| slope | degrees | Terrain slope (dummy value, reserved field for future ED2-TOPMODEL implementation) |
| aspect | degrees | Terrain aspect (dummy value, reserved field for future ED2-TOPMODEL implementation) |
| TCI | 1 | Topography convergence index (dummy value, reserved field for future ED2-TOPMODEL implementation) |
| moist_f | m−1 | Rate of exponential decay of soil conductance with depth (dummy value, reserved field for future ED2-TOPMODEL implementation) |
| moist_w | 1 | Soil wetness index (dummy value, reserved field for future ED2-TOPMODEL implementation) |
Table 2. Variables in the patch files (*.pss).
| Variable | Unit | Description |
|---|---|---|
| time | YYYY | Year |
| site | - | Unique site identifier (consistent with sss/css files) |
| patch | - | Unique patch identifier (consistent with sss/css files). Patch names use the following convention: EBA_TNtttt_yyyy_uuu_Xeeeeeeee_Ynnnnnnnn, where tttt = EBA2016 transect number, yyyy = year of the lidar acquisition, uuu = UTM zone (and hemisphere), eeeeeeee = Easting of the column centre (m), nnnnnnnn = Northing of the column centre (m) |
| dtype | - | Disturbance type. Classes include: 1. Pasture, 2. Forest plantation, 3. Tree fall, 4. Burnt patch, 5. Abandoned managed land, 6. Logged forest (felling), 7. Skid trails (felling), 8. Cropland |
| age | y | Patch age, years since last disturbance |
| area | 1 | Fractional area represented by patch at site. The area of all patches within the same site will sum to 1. |
| fgc | kg m−2 | Fast soil carbon (above ground) in kg C. Estimated from land use history and literature search (Longo et al., 2020). |
| fsc | kg m−2 | Fast soil carbon (below ground) in kg C. Estimated from land use history and literature search (Longo et al., 2020). |
| stgc | kg m−2 | Structural soil carbon (above ground) in kg C. Estimated from land use history and literature search (Longo et al., 2020). |
| stgl | kg m−2 | Structural soil lignin (above ground) in kg lignin. Estimated from land use history and literature search (Longo et al., 2020). |
| stsc | kg m−2 | Structural soil carbon (below ground) in kg C. Estimated from land use history and literature search (Longo et al., 2020). |
| stsl | kg m−2 | Structural soil lignin (below ground) in kg lignin. Estimated from land use history and literature search (Longo et al., 2020). |
| msc | kg m−2 | Microbial soil carbon in kg C. Estimated from land use history and literature search (Longo et al., 2020). |
| ssc | kg m−2 | Humified (slow) soil carbon in kg C. Estimated from land use history and literature search (Longo et al., 2020). |
| psc | kg m−2 | Passive (very slow) soil carbon in kg C. Estimated from land use history and literature search (Longo et al., 2020). |
| fsn | kg m−2 | Fast soil nitrogen (below and above ground) in kg N. Estimated from land use history and literature search (Longo et al., 2020). |
| msn | kg m−2 | Mineralised soil nitrogen in kg N. Estimated from land use history and literature search (Longo et al., 2020). |
| npl | m−2 | Total stem density in this patch (consistent with the css file). |
| agb | kg m−2 | Aboveground biomass carbon density in this patch in kg C (consistent with the css file) |
| bsa | cm2 m-2 | Basal area in this patch (consistent with the css file) |
| lai | m2 m−2 | Leaf area index in this patch (consistent with the css file) |
Table 3. Variables in the cohort files (*.css).
| Variable | Unit | Description |
|---|---|---|
| time | YYYY | Year |
| site | - | Unique site identifier (consistent with sss/pss files) |
| patch | - | Unique patch identifier (consistent with sss/pss files). |
| cohort | 1 | Cohort index in the patch |
| dbh | cm | Diameter at breast height |
| height | m | Plant height |
| pft | integer | Plant functional type, consistent with ED2 default classes. Possible values are: 1. Tropical C4 grass, 2. Early-successional, evergreen broadleaf tropical tree, 3. Mid-successional, evergreen broadleaf tropical tree, 4. Late-successional, evergreen broadleaf tropical tree |
| nplant | m−2 | Total stem number density of this cohort |
| bdead | kg | Biomass stored in heartwood (structural, dead tissues) in kg C |
| balive | kg | Biomass stored in living tissues (leaves, fine roots, sapwood, bark) in kg C |
| agb | kg | Aboveground biomass of this cohort in kg C |
| lai | m2 m−2 | (Maximum) Leaf area index of this cohort |
Application and Derivation
These files are intended to provide initial conditions for cohort-based vegetation demography models. Vegetation structure data (stem number density, aboveground biomass, leaf area index) were obtained from airborne lidar surveys following the method described in Longo et al. (2020) and extensively cross-validated. Soil edaphic characteristics were obtained from existing datasets (Lawrence and Chase, 2007; Pelletier et al., 2016; Poggio et al., 2021), and users are referred to these publications for uncertainty. Carbon stored in litter and soil layers (patch files) were estimated from the land use history and limited measurements in different land use types. These data are provided here because these quantities are required by the ED2 model, but their uncertainty is likely very high and unlikely to provide reliable information at regional scale.
Quality Assessment
Results using regional cross-validation (i.e., bootstrapping sampling that sets entire regions as testing) showed that the approach produces realistic variability in forest structures in the Amazon, both across precipitation gradients and at different levels of forest degradation (Longo et al., 2020).
Data Acquisition, Materials, and Methods
Forest structure distributions were derived from raw airborne lidar dataset using the approach described in Longo et al. (2020). Airborne lidar data were pooled from the Amazon Biomass Estimation Project (EBA2016) campaign archive, publicly available through Ometto et al. (2023); only the transects designated for random sampling (545 transects) were selected. Each transect was split into multiple 50 × 50 m columns, resulting in 1,310,478 columns. Each column was assumed to be one patch. For each patch, waveforms were simulated using an approach similar to the GEDI waveform simulator (Hancock et al., 2019) and a light extinction model was applied based on Ni-Meister et al. (2001) to derive a first guess of leaf area density (LAD). The lidar-based statistical models derived from airborne lidar metrics (Longo et al., 2020) were used to estimate aboveground biomass carbon density (ABCD), basal area (BA), leaf area index (LAI), and stem number density (ND). The first-guess LAD profiles were assigned a correction factor to minimize the overall uncertainty of ABCD, BA, LAI and ND (Longo et al., 2020).
Because the airborne lidar campaign did not survey deforested areas (Ometto et al., 2023), the lidar profiles were complemented with additional patches that accounted for deforested areas. For simplicity, these areas were assumed to be pastures entirely covered with C4 grasses, and further assumed an LAI of 2 m2 m−2, based on values typically found in the Amazon (Zanchi et al., 2009).
To account for the associations between forest structure and soil properties, each patch was assigned to a set of soil depth (derived from Pelletier et al., 2016), soil color (Lawrence et al., 2007) and other soil characteristics from SoilGrids250m version 2.0 (Poggio et al., 2021). For each grid cell, up to four sets of soil characteristics were defined, which became sites. Patches were assigned to each of the sites based on the similarity of soil characteristics.
See Longo et al. (2025) for additional details.
Data Access
These data are available through the Oak Ridge National Laboratory (ORNL) Distributed Active Archive Center (DAAC).
Amazon Forest Structure from Airborne Lidar, ED2 Initial Condition Files, 2016
Contact for Data Center Access Information:
- E-mail: uso@daac.ornl.gov
- Telephone: +1 (865) 241-3952
References
Hancock, S., J. Armston, M. Hofton, X. Sun, H. Tang, L.I. Duncanson, J.R. Kellner, and R. Dubayah. 2019. The GEDI Simulator: a large-footprint waveform Lidar simulator for calibration and validation of spaceborne missions. Earth and Space Science 6:294–310. https://doi.org/10.1029/2018EA000506
Lawrence, P.J., and T.N. Chase. 2007. Representing a new MODIS consistent land surface in the Community Land Model (CLM 3.0). Journal of Geophysical Research: Biogeosciences 112:G01023. https://doi.org/10.1029/2006JG000168
Longo, M., M. Keller, L. M. Kueppers, K. Bowman, O. Csillik, A. Ferraz, P. R. Moorcroft, J. P. Ometto, B. S. Soares-Filho, X. Xu, M. L. F. de Assis, E. B. Görgens, E. J. L. Larson, J. F. Needham, E. M. Ordway, F. R. S. Pereira, E. Rangel Pinagé, L. Sato, L. Xu, and S. Saatchi. 2025. Degradation and deforestation increase the sensitivity of the Amazon Forest to climate extremes. Environmental Research Letters 25(20), 054024, doi: 10.1088/1748-9326/adc58c
Longo, M., S. Saatchi, M. Keller, K. Bowman, A. Ferraz, P.R. Moorcroft, D.C. Morton, D. Bonal, P. Brando, B. Burban, G. Derroire, M.N. dos-Santos, V. Meyer, S. Saleska, S. Trumbore, and G. Vincent. 2020. Impacts of degradation on water, energy, and carbon cycling of the Amazon tropical forests. Journal of Geophysical Research: Biogeosciences 125:e2020JG005677. https://doi.org/10.1029/2020JG005677
Longo, M., R.G. Knox, D.M. Medvigy, N.M. Levine, M.C. Dietze, Y. Kim, A.L.S. Swann, K. Zhang, C.R. Rollinson, R.L. Bras, S.C. Wofsy, and P.R. Moorcroft. 2019. The biophysics, ecology, and biogeochemistry of functionally diverse, vertically and horizontally heterogeneous ecosystems: the Ecosystem Demography model, version 2.2 – Part 1: Model description. Geoscientific Model Development 12:4309–4346. https://doi.org/10.5194/gmd-12-4309-2019
Ometto, J.P., E.B. Gorgens, F.R. de Souza Pereira, L. Sato, M.L.R. de Assis, R. Cantinho, M. Longo, A.D. Jacon, and M. Keller. 2023. A biomass map of the Brazilian Amazon from multisource remote sensing. Scientific Data 10:668. https://doi.org/10.1038/s41597-023-02575-4
Pelletier, J.D., P.D. Broxton, P. Hazenberg, X. Zeng, P.A. Troch, G. Niu, Z. Williams, M.A. Brunke, and D. Gochis. 2016. A gridded global data set of soil, intact regolith, and sedimentary deposit thicknesses for regional and global land surface modeling. Journal of Advances in Modeling Earth Systems 8:41–65. https://doi.org/10.1002/2015MS000526
Poggio, L., L.M. de Sousa, N.H. Batjes, G.B.M. Heuvelink, B. Kempen, E. Ribeiro, and D. Rossiter. 2021. SoilGrids 2.0: producing soil information for the globe with quantified spatial uncertainty. SOIL 7:217–240. https://doi.org/10.5194/soil-7-217-2021
Zanchi, F.B., M.J. Waterloo, L.J.G. Aguiar, C. von Randow, B. Kruijt, F.L. Cardoso, and A.O. Manzi. 2009. Estimativa do Índice de Área Foliar (IAF) e Biomassa em pastagem no estado de Rondônia, Brasil. Acta Amazonica 39:335–347. https://doi.org/10.1590/S0044-59672009000200012