Documentation Revision Date: 2018-03-20
Data Set Version: 1
Summary
This dataset includes 72 files in ENVI binary image format (compressed in *.tar.gz format) and two zipped companion files containing: 1) an RGB composite image for each flight line, and 2) a shapefile providing the boundaries for the imagery captured for each flight line.
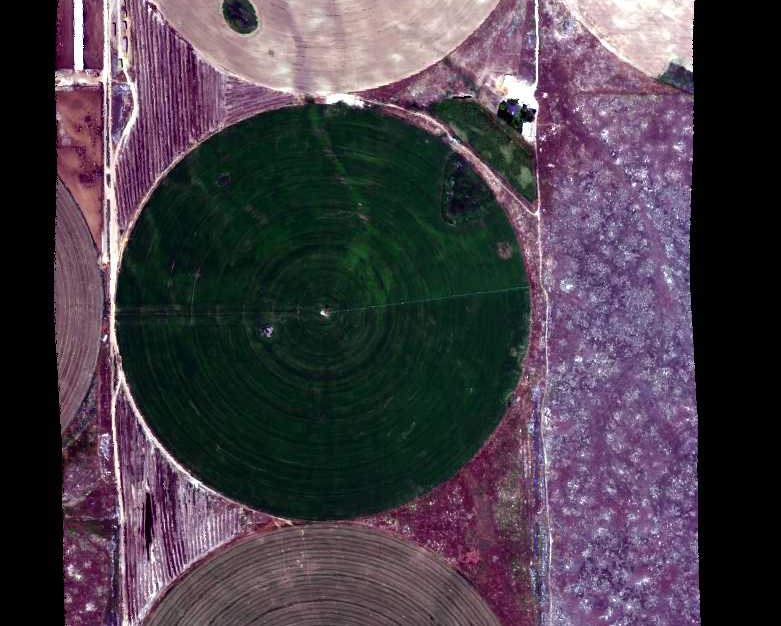
Figure 1. A portion of the quicklook image from flight line ang20150611t202652 over Reynolds Creek Experimental Watershed, Idaho on June 6, 2015. Center-pivot irrigation of agricultural land (1/2 mile in diameter) is visible in this image. Flight altitude was approximately 3000 m with clear weather.
Citation
Dashti, H., N.F. Glenn, L.P. Spaete, and N. Ilangakoon. 2018. Hyperspectral Imagery from AVIRIS-NG for Sites in ID and CA, USA, 2014 and 2015. ORNL DAAC, Oak Ridge, Tennessee, USA. https://doi.org/10.3334/ORNLDAAC/1533
Table of Contents
- Data Set Overview
- Data Characteristics
- Application and Derivation
- Quality Assessment
- Data Acquisition, Materials, and Methods
- Data Access
- References
Data Set Overview
This dataset provides surface reflectance measured by the Airborne Visible/Infrared Imaging Spectrometer-Next Generation (AVIRIS-NG) instrument during flights over research sites in Idaho and California in 2014 and 2015. AVIRIS-NG measures reflected radiance at 5-nanometer (nm) intervals in the visible to shortwave infrared spectral range between 380 and 2510 nm. Measurements are radiometrically and geometrically calibrated and provided at 1-meter spatial resolution. The data include 72 flight lines covering long term-research sites in the Reynolds Creek Experimental Watershed in southwestern Idaho and Hollister in southeastern Idaho. Several flight lines from a site in the Inyo National Forest near Big Pine, California are included as well.
The data were registered to full waveform LiDAR data from the same areas. These data are provided in the related dataset cited below.
Related Datasets:
Ilangakoon, N., N. Glenn, and L. Spaete. 2017. LiDAR Data, DEM, and Maximum Vegetation Height Product from Southern Idaho, 2014. ORNL DAAC, Oak Ridge, Tennessee, USA. https://doi.org/10.3334/ORNLDAAC/1532
Glenn, N.F., L.P. Spaete, R. Shrestha, A. Li, N. Ilangakoon, J. Mitchell, S.L. Ustin, Y. Qi, H. Dashti, and K. Finan. 2017. Shrubland Species Cover, Biometric, Carbon and Nitrogen Data, Southern Idaho, 2014. ORNL DAAC, Oak Ridge, Tennessee, USA. https://doi.org/10.3334/ORNLDAAC/1503
Acknowledgements:
This research was funded through NASA Terrestrial Ecology grant number NNX14AD81G.
Data Characteristics
Spatial Coverage: Flights over research sites in southern Idaho and eastern California
Spatial Resolution: 1-meter
Temporal Coverage: 2014-09-15 to 2015-06-13
Temporal Resolution: Reynolds Creek Experimental Watershed was surveyed twice. Other areas were surveyed once.
Study Area (These coordinates are the approximate locations of the study sites and may not match the extent of the data files. All latitude and longitude are given in decimal degrees.)
| Site | Northern Extent | Western Extent | Eastern Extent | Southern Extent |
|---|---|---|---|---|
| Reynolds Creek Experimental Watershed, Idaho | 43.329 | -116.865 | -116.675 | 43.029 |
| Hollister, Idaho | 42.435 | -114.734 | -114.671 | 42.235 |
| Inyo National Forest, Big Pine, California | 37.216 | -118.406 | -118.172 | 36.571 |
Data File Information
There are 72 compressed tar archives (TAR; *.tar.gz) providing data from the AVIRIS-NG instrument for the 72 flight lines included in this dataset. Reflectance measurements are provided for each flight in ENVI binary image format. Ground control points used for image georegistration are provided in text file formats (*.txt and *.pts).
The ENVI image files have no extension and are accompanied by a header file (*.hdr) of the same name in text format. The header files should remain in the same directory as the image files for the data to be displayed properly. Header files provide spatial and spectral metadata related to the image file such as the number of lines, samples, channels, etc. Please see the Harris Geospatial reference for the ENVI file format for more detailed information on the header files.
Each TAR contains a README describing the content of the ENVI files. Filenames listed in the README do not match the ENVI filenames. See the Filename Convention section below for a description of TAR and ENVI filenames.
NoData are coded as -9999.
File Naming Convention
Each flight line uses a specific base filename prefix: angYYYYMMDDtHHNNSS. TAR files are named according to this prefix, e.g. ang20140915t203245_rfl_v1c.tar.gz. The datetime codes outlined below apply to TAR filenames.
- YYYY : Year of flight
- MM : Month of flight
- DD : Day of flight
- HH : UTC hour at start of flight
- NN : UTC minute at start of flight
- SS : UTC second at start of flight
ENVI files are named according to the UTC time of the flight line (HHNNSS_Georegistered), e.g.
- 203245_Georegistered
- 203245_Georegistered.hdr
- 203245_GCPs.txt
- 203245_GCPs.pts
Companion Files
An RGB composite image is provided in JPEG format for each flight line in the companion file idaho_aviris_quicklooks.zip and a shapefile containing the flight line boundaries is provided in the companion file idaho_aviris_boundaries.zip.
Application and Derivation
Spectra measured by AVIRIS-NG are used to identify, measure, and monitor constituents of the Earth's surface and atmosphere. Ecological applications include species composition, structure and function; chlorophyll, leaf water, lignin, cellulose, pigment, and non-photosynthetic constituent content.
Quality Assessment
AVIRIS-NG data are processed by the AVIRIS-NG instrument ground data system at NASA's Jet Propulsion Laboratory. Anomalies that were not detected by pre- and post-flight diagnostics are detected through sensor performance evaluation based on a preliminary analysis of the data.
Georegistration was based on the 1st-degree polynomial and bilinear sampling. The RMSE for most of the flight lines is less than half a pixel.
Data Acquisition, Materials, and Methods
Airborne Visible/Infrared Imaging Spectrometer-Next Generation (AVIRIS-NG) is an imaging spectrometer that measures reflected radiance at 5-nm intervals in the visible to shortwave infrared spectral range from 380-2510 nm. AVIRIS-NG was built to support NASA science and applications measuring spectra as images that record the interaction of light with matter.
See Thompson et al. (2015) and Gao et al. (1993) for explanation of surface reflectance derivation from AVIRIS radiance measurements.
These data include 72 flight lines covering long-term research sites in the Reynolds Creek Experimental Watershed in southwestern Idaho and Hollister in southeastern Idaho. Several flight lines from the Inyo National Forest near Big Pine, California are included as well. Flight lines are depicted in Figure 2.
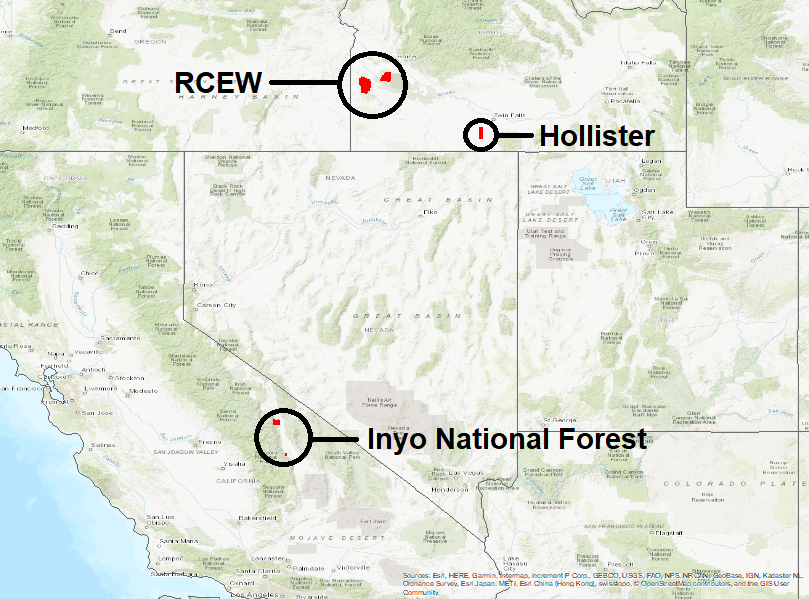
Figure 2. AVIRIS-NG flights over the Reynolds Creek Experimental Watershed (RCEW) and Hollister in Idaho and Inyo National Forest in California. Flight paths are depicted in red.
The data were registered to full waveform LIDAR data collected in the same areas. The LIDAR data are provided in a related dataset listed in Section 2 (Ilangakoon et al. 2017). Georegistration was based on the 1st-degree polynomial and bilinear sampling. Ground control points are included for each of the flight lines.
Shrubland vegetation was characterized for the two Idaho research sites in another related dataset listed in Section 2 (Glenn et al. 2017). Shrubland species cover, carbon and nitrogen content, leaf area index and other parameters were measured within one-meter plots throughout the research sites.
Data Access
These data are available through the Oak Ridge National Laboratory (ORNL) Distributed Active Archive Center (DAAC).
Hyperspectral Imagery from AVIRIS-NG for Sites in ID and CA, USA, 2014 and 2015
Contact for Data Center Access Information:
- E-mail: uso@daac.ornl.gov
- Telephone: +1 (865) 241-3952
References
Gao, B.C., K.H. Heidebrecht, and A.F.H. Goetz. 1993. Derivation of scaled surface reflectances from AVIRIS data, Remote Sens. Env., 44, 165-178. https://doi.org/10.1016/0034-4257(93)90014-O
Glenn, N.F., L.P. Spaete, R. Shrestha, A. Li, N. Ilangakoon, J. Mitchell, S.L. Ustin, Y. Qi, H. Dashti, and K. Finan. 2017. Shrubland Species Cover, Biometric, Carbon and Nitrogen Data, Southern Idaho, 2014. ORNL DAAC, Oak Ridge, Tennessee, USA. https://doi.org/10.3334/ORNLDAAC/1503
Ilangakoon, N., N. Glenn, and L. Spaete. 2017. LiDAR Data, DEM, and Maximum Vegetation Height Product from Southern Idaho, 2014. ORNL DAAC, Oak Ridge, Tennessee, USA. https://doi.org/10.3334/ORNLDAAC/1532
Thompson, D.R., B.C. Gao, R.O. Green, P.E. Dennison, D.A. Roberts, and S. Lundeen. 2015. Atmospheric Correction for Global Mapping Spectroscopy: ATREM Advances for the HyspIRI Preparatory Campaign. Remote Sens. of Env., 167: 64-77. https://doi.org/10.1016/j.rse.2015.02.010