Documentation Revision Date: 2023-11-20
Dataset Version: 1.1
Summary
Fixed sites are included at the request of measurement networks, research programs, and individual researchers. Subsets of each available terrestrial ecology data are pre-processed and indexed for the roughly 8.5 by 8.5-km footprint surrounding each fixed site to allow for instantaneous visualization and download of the data. The time series for each product is routinely updated as new data become available. Fixed sites are searchable by site name, country, or network affiliation through the TESViS Fixed Sites Subsetting Tool portal.
Data are available for download in comma separated value (*.csv) and GeoTIFF (.tif; sinusoidal projection) format.
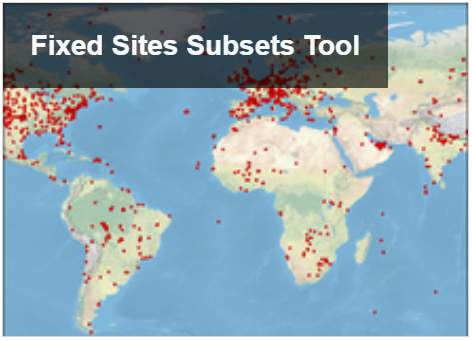
Figure 1. Pre-processed terrestrial ecology land product subsets are available for selected sites around the globe.
Citation
ORNL DAAC. 2018. Terrestrial Ecology Subsetting & Visualization Services (TESViS) Fixed Sites Subsets. ORNL DAAC, Oak Ridge, Tennessee, USA. https://doi.org/10.3334/ORNLDAAC/1567
Table of Contents
- Dataset Overview
- Data Characteristics
- Application and Derivation
- Quality Assessment
- Data Acquisition, Materials, and Methods
- Data Access
- References
Dataset Overview
The TESViS Fixed Sites Subsetting Tool provides customized subsets and visualizations of several terrestrial ecology data products for 2000+ selected field and flux tower sites around the world. Spatial subsets of the land products are available for predefined areas (approximately 8.5 by 8.5-km) centered on each site. Users select a site and data product through the graphical web interface and are directed to a page with options for data download and visualizations.
Fixed sites are included at the request of measurement networks, research programs, and individual researchers. Subsets of each available terrestrial ecology data product are pre-processed and indexed for the roughly 8.5 by 8.5-km footprint surrounding each fixed site to allow for instantaneous visualization and download of the data. The time series for each product is routinely updated as new data become available. Fixed sites are searchable by site name, country, or network affiliation through the TESViS Fixed Sites Subsetting Tool portal.
How to Cite TESViS Fixed Sites Subsets Tool:
Please refer to Section 5 of this document and to the TESViS Citation Guidelines page for more information on how to cite your subsets.
Data Characteristics
The data products available through the TESViS Fixed Sites Subsetting Tool are generated by instruments on NASA's earth observation platforms:
Please refer to the TESViS Documentation page for a list of available data products.
Application and Derivation
The Fixed Sites Subsetting Tool streamlines the use of terrestrial ecology data for characterization of field sites, rapid time-series visualization, validation of models and other remote sensing products, and other research activities. See here for a list of publications that have used Fixed Sites subsets from the ORNL DAAC.
Quality Assessment
The results of routine quality assessments are maintained at the MODIS Land Quality Assessment (MODLAND) site by the MODIS Land Science Team and provided through product metadata and per-pixel information for each MODIS granule.
Similar quality assessments are performed by the NASA Suomi NPP Land Science Team. More information about VIIRS validation is available at the Suomi NPP VIIRS Land site.
Data Acquisition, Materials, and Methods
Data Processing
Subsets of each available product are pre-processed and indexed for the roughly 8.5 by 8.5-km footprint surrounding each fixed site to allow for instantaneous visualization and download of the data. The time series for each product is routinely updated as new data become available. Fixed sites are searchable by site name, country, or network affiliation through the TESViS Fixed Sites Subsetting Tool portal.
How to Cite Collection 6 Land Product Subsets
For your convenience, you will receive citations for your order and the terrestrial ecology data products in the order delivery email. Users should include both a citation to the subsetting tool itself and a citation to the specific product(s) used as references in subsequent manuscripts. Citations for available products are included in the references section of this document. Please refer to the TESViS Citation Guidelines page for more information on how to cite your data subsets.
Tool Description
The tool is accessed via the link on the TESViS Get Data page. Users are required to log in with their NASA Earthdata login information before downloading data. Fixed sites are searchable by site name, country, or network affiliation through the TESViS Fixed Sites Subsetting Tool portal. Sites may be selected on the map or from the list. A list of available land products is displayed upon selecting a site. Selection of the desired product directs the user to the visualization page specific to that site and product.
The fixed site visualization page provides details about the subset area, visualizations, quality assurance information, citations, and download links.
- Users have the option to visualize data from individual composite dates by clicking the Visualize Subset Area by Dates button.
- Check the Stack by Year box to visualize a stacked yearly time series.
- Coarse and fine adjustments to the temporal range for Stacked and Default time series plots can be made using the sliders at the top of the page and directly below the plots.
- IGBP land cover classification, vegetation phenology, and various plots (and plotting scripts written in R) are accessible for subset data near the bottom of the visualization page.
Additional Resources
A collection of example classroom exercises is maintained on the TESViS Land Products Subsets page. The exercises have been provided by instructors from various institutions to help students and researchers understand the basic concepts of remote sensing as well as the use of the subsetting and visualization tools provided by the ORNL DAAC.
Data Access
These data are available through the Oak Ridge National Laboratory (ORNL) Distributed Active Archive Center (DAAC).
Terrestrial Ecology Subsetting & Visualization Services (TESViS) Fixed Sites Subsets
Contact for Data Center Access Information:
- E-mail: uso@daac.ornl.gov
- Telephone: +1 (865) 241-3952
References
S.K. Santhana Vannan, R.B. Cook, S.K. Holladay, L.M. Olsen, U. Dadi, B.E. Wilson. A Web-Based Subsetting Service for Regional Scale MODIS Land Products (2010). IEEE JSTARS, 2(4): 319–328