Get Data
Revision Date: August 1, 2014
Summary:
This data set provides a soil map with estimates of soil carbon (C) in gC/m2 for 20-cm layers from the surface to 1-m depth for the conterminous United States. STATSGO v.1 (State Soil Geographic Database, Soil Survey Staff, 1994) data were used to estimate by 20-cm intervals to a 1-m depth the mean soil carbon inventory (gC/m2) for each of the STATSGO-delineated soil map units. These map units are the polygons represented in the provided Shapefile data product.
The STATSGO-delineated soil map units encompass between 1 and 26 soil components, representing phases of soil series. Soil series phases represent environmental distinctions within soil series that are relevant to land management, such as slope position and slope steepness (Soil Survey Division Staff, 1993). Each soil series phase within a map unit has been given a high and low value for each soil attribute (e.g., soil organic matter, bulk density, soil layer depth, soil texture, etc.). To generate a baseline soils map, we averaged the high and low values for attributes of each soil series phase, converted soil organic matter content to soil organic C content, multiplied the C content by soil bulk density and by the depth of the respective soil layer, and corrected for the percentage of rock fragments in each soil layer. Soil C was estimated by 20-cm intervals to a 1-m depth, based on soil layer depths and on depth-to-bedrock estimates included in the STATSGO database. A weighted average of soil C was calculated among soil series phases within each soil map unit, resulting in one soil C estimate by depth increment for each spatially delineated soil map unit.
Polygons (soil map units) are an area(s), that have the same derived 0-20, 20-40, 40-60, 60-80, and 80-100 cm layer soil carbon values (g C/m2). There is one compressed file (.zip) with this data set. When extrapolated, the .zip file contains one shapefile (.shp).
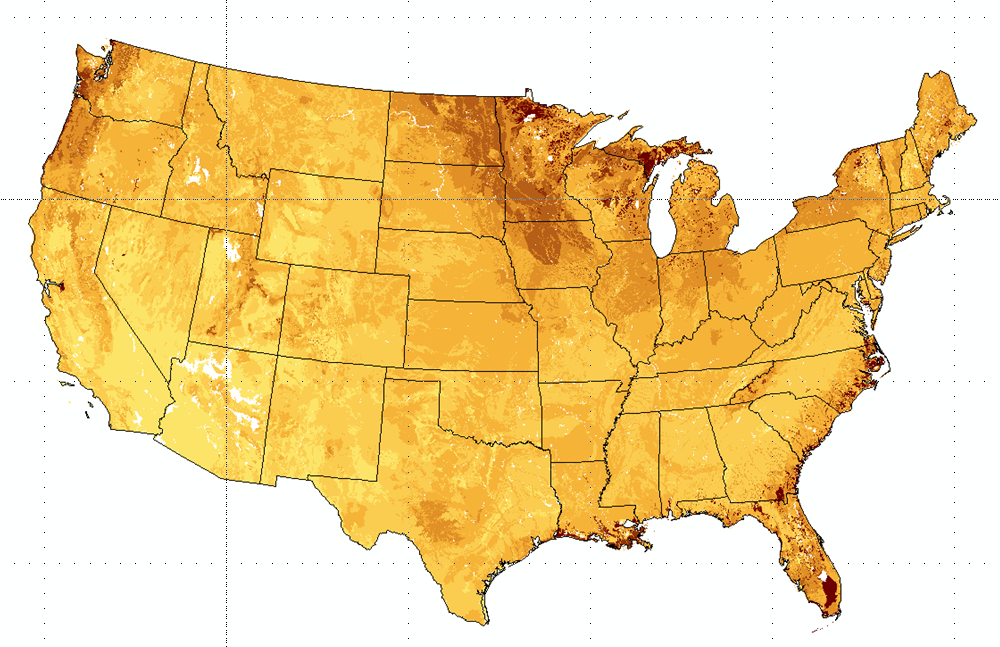
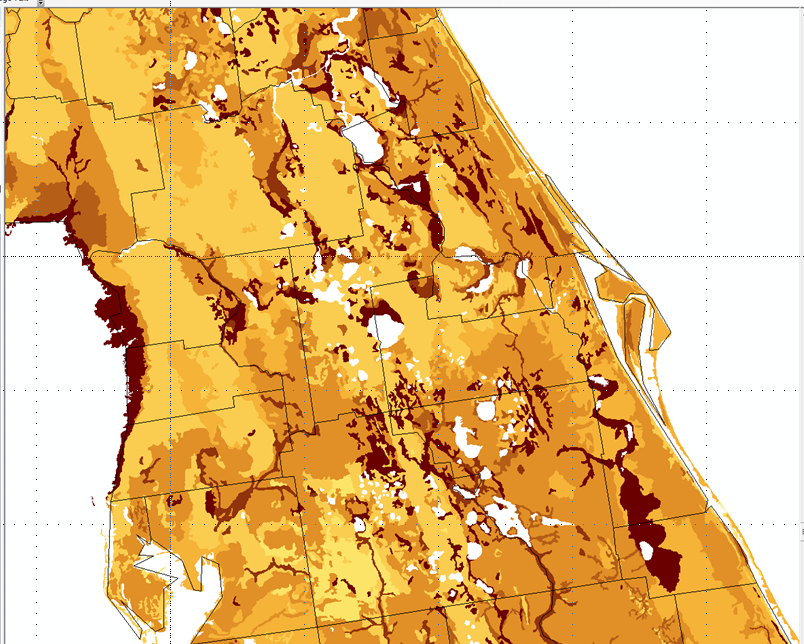
Figure 1. Left image is entire map showing soil carbon in g C/m2 for the 0-20 cm layer. Right image, soil carbon
in g C/m2 for the 0-20 cm layer for central Florida, is shown as an example of polygon detail available with
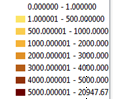
this map. Soil carbon inventories (gC/m2) are classified as follows:
Data and Documentation Access:
Get Data: http://daac.ornl.gov/cgi-bin/dsviewer.pl?ds_id=1238
Data Citation:
Cite this data set as follows:
West, T.O. 2014. Soil Carbon Estimates in 20-cm Layers to 1-m Depth for the Conterminous US, 1970-1993. Data set. Available on-line [http://daac.ornl.gov] from Oak Ridge National Laboratory Distributed Active Archive Center, Oak Ridge, Tennessee, USA. http://dx.doi.org/10.3334/ORNLDAAC/1238
Table of Contents:
- 1 Data Set Overview
- 2 Data Characteristics
- 3 Applications and Derivation
- 4 Quality Assessment
- 5 Acquisition Materials and Methods
- 6 Data Access
- 7 References
1. Data Set Overview:
This data set provides a soil map with estimates of soil carbon (C) in g C/m2 for 20-cm layers from the surface to 1-m depth for the conterminous United States. STATSGO v.1 (State Soil Geographic Database, Soil Survey Staff, 1994) data were used to estimate by 20-cm intervals to a 1-m depth the mean soil carbon inventory (gC/m2) for each of the STATSGO-delineated soil map units. These map units are the polygons represented in the provided Shapefile data product.
2. Data Characteristics:
Spatial Coverage
Conterminous USA
Spatial Resolution
Not applicable
Site boundaries: (All latitude and longitude given in degrees and fractions)
| Westernmost Longitude | Easternmost Longitude | Northernmost Latitude | Southernmost Latitude |
|---|---|---|---|
| -135.6815 | -54.82205 | 53.5415 | 22.2706 |
Temporal Coverage
Compilation from published soil databases between 1970/01/01 to 1993/12/30.
Temporal Resolution
None
Data File Information
This data set provides one shapefile depicting soil carbon estimates per 20-cm increments to one meter depth for the conterminous United States. Polygons (soil map units) are defined as an area(s) with the same 0-20, 20-40, 40-60, 60-80, and 80-100 cm g C/m2 values. This shapefile contains six files (*.shx, *.dbf, *.prj, *.sbn, *.sbx, and *.shp).
Shapefile: statsgo1poly
Parameters of the shapefile:
Geometry Type: Polygon
Projected Coordinate System: NAD_1927_Albers
Geographic Coordinate
System: GCS_North_American_1927
Datum: D_North_American_1927
Prime Meridian: Greenwich
Angular Unit: Degree
Projection: Albers
False Easting: 0
False Northing: 0
Central Meridian: -96.00000000
Standard_Parallel_1: 29.50000000
Standard_Parallel_2:
45.50000000
Latitude of Origin: 23.00000000
Linear Unit: Meter
Attributes:
| FID | Internal feature number; sequential unique whole numbers that are automatically generated |
| Shape | Feature geometry |
| USMUID_ | Data provider generated ID used in data processing based on STATSGO. No specific
reference available at this time. |
| USMUID_ID | Data provider generated ID used in data processing based on STATSGO. No specific
reference available at this time. |
| MUID | Data provider generated ID used in data processing based on STATSGO. No specific
reference available at this time. |
| IDS | Data provider generated ID used in data processing based on STATSGO. No specific
reference available at this time. |
| OC0_20cm | Soil carbon estimate from a depth of 0 to 20 centimeters (gC/m^2) |
| OC20_40cm | Soil carbon estimate from a depth of 20 to 40 centimeters (gC/m^2) |
| OC40_60cm | Soil carbon estimate from a depth of 40 to 60 centimeters (gC/m^2) |
| OC60_80cm | Soil carbon estimate from a depth of 60 to 80 centimeters (gC/m^2) |
| OC80_100cm | Soil carbon estimate from a depth of 80 to 100 centimeters (gC/m^2) |
3. Data Application and Derivation:
This soil map with estimates of soil carbon in gC/m2 for 20-cm layers from the surface to 1-m depth for the conterminous United States was derived using methods described by West et al., 2008.
This data set represents soil attributes from STATSGO v.1 that were largely collected prior to conservation tillage practices were adopted on US croplands.
These soil carbon estimates were used as baseline data for soil carbon change estimates by West et al. (2008).
4. Quality Assessment:
The STATSGO v.1 Soil Survey Manual (Soil Survey Division Staff, 1993) describes the compilation of data and the attributes in the 1993 database.
5. Data Acquisition Materials and Methods
Soil Carbon Estimation Methods
STATSGO v.1 was used to estimate mean soil carbon per polygon in 20-cm increments to 1-m depth. In preparation for the release of STATSGO v.1 in 1994, incorporation of new soils data into STATSGO ceased in late 1993. Of 4,595 complete soil surveys for the contiguous United States, 664 or 14% are from the period 1983 to 1993. Therefore, approximately 86% of soil series data used in the development of STATSGO were taken before 1983 (i.e., before no-till practices became more widely adopted).
The STATSGO-delineated soil map units encompass between 1 and 26 soil components, representing phases of soil series. Soil series phases represent environmental distinctions within soil series that are relevant to land management, such as slope position and slope steepness (Soil Survey Division Staff, 1993). Each soil series phase within a map unit has been given a high and low value for each soil attribute (e.g., soil organic matter, bulk density, soil layer depth, soil texture, etc.). To generate a baseline soils map, we averaged the high and low values for attributes of each soil series phase, converted soil organic matter content to soil organic C content, multiplied the C content by soil bulk density and by the depth of the respective soil layer, and corrected for the percentage of rock fragments in each soil layer. Soil C was estimated by 20-cm intervals to a 1-m depth, based on soil layer depths and on depth-to-bedrock estimates included in the STATSGO database. A weighted average of soil C was calculated among soil series phases within each soil map unit, resulting in one soil C estimate for each spatially delineated soil map unit.
6. Data Access:
This data is available through the Oak Ridge National Laboratory (ORNL) Distributed Active Archive Center (DAAC).
Data Archive Center:
Contact for Data Center Access Information:
E-mail: uso@daac.ornl.gov
Telephone: +1 (865) 241-3952
7. References:
Soil Survey Staff, Natural Resources Conservation Service, United States Department of Agriculture, US General Soil Map (STATSGO2), available at: http://www.nrcs.usda.gov/wps/portal/nrcs/detail/soils/survey/?cid=nrcs142p2_053629, last access: August 2011.
Soil Survey Staff. 1994a. U.S. general soil map (STATSGO). Available at www. ncgc.nrcs.usda.gov/products/datasets/statsgo/. NRCS, Washington, DC.
Soil Survey Division Staff. 1993. Soil survey manual. USDA Handbook. 18. U.S. Gov. Print. Office, Washington, DC.
West, T.O., C.C. Brandt, B.S. Wilson, C.M. Hellwinckel, D.D. Tyler, G. Marland, D.G. De La Torre Ugarte, J.A. Larson, and R.G. Nelson. 2008. Estimating regional changes in soil carbon with high spatial resolution. Soil Sci. Soc. Am. J. 72:285-294 doi:10.2136/sssaj2007.0113