Documentation Revision Date: 2020-05-07
Dataset Version: 1
Summary
There are 141 files total; 140 files in GeoTIFF (*.tif) format and 1 file in Comma Separated Value (*.csv) format.
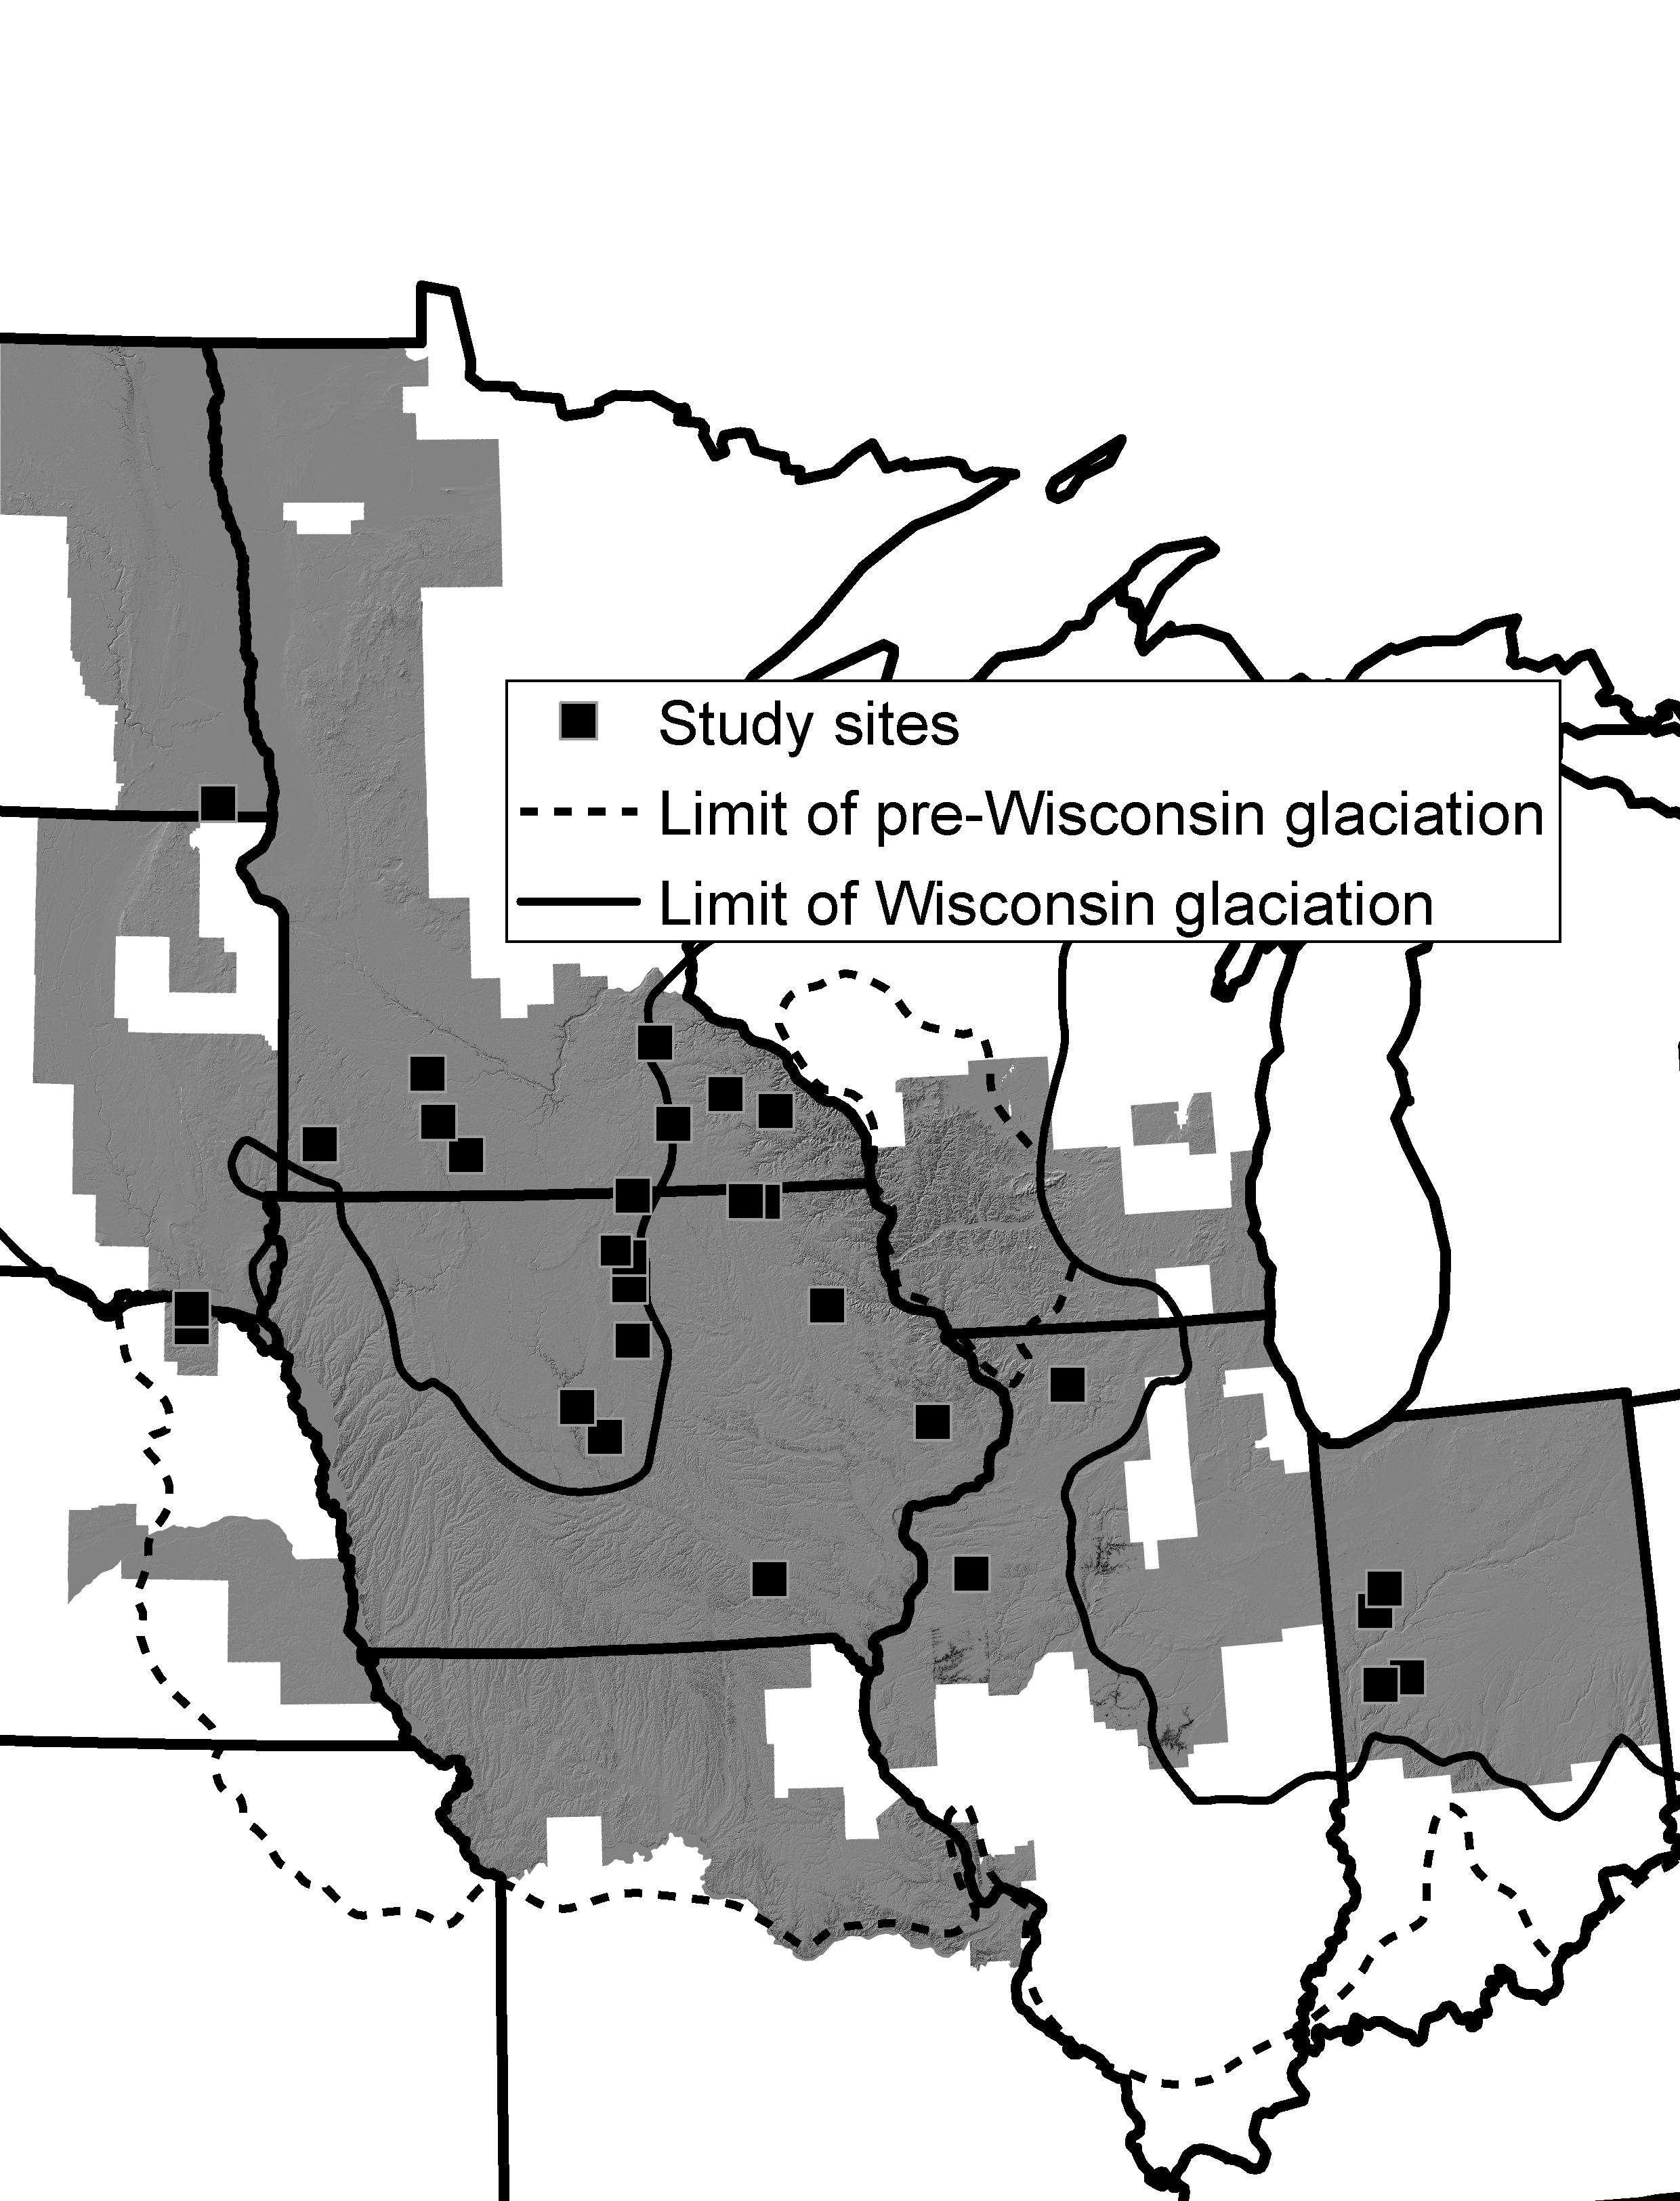
Figure 1. Study area in the Midwestern US with study site locations and extent of analysis. The study area was limited to the spatial extent of LiDAR topographic data (gray hillshade). Squares represent the 28 sites, a total of 210 km2, that were selected for having plowed, bare soil. Source: Thaler et al., 2020
Citation
Thaler, E., I. Larsen, and Q. Yu. 2020. Remote Sensing Derived Topsoil and Agricultural Economic Losses, Midwestern USA. ORNL DAAC, Oak Ridge, Tennessee, USA. https://doi.org/10.3334/ORNLDAAC/1774
Table of Contents
- Dataset Overview
- Data Characteristics
- Application and Derivation
- Quality Assessment
- Data Acquisition, Materials, and Methods
- Data Access
- References
Dataset Overview
This dataset provides estimates of topsoil loss and economic loss associated with decreased crop productivity resulting from topsoil loss at county- and state-levels across the Corn Belt region of the Midwestern USA. Intermediate products used to derive topsoil loss are provided and include 4 m gridded estimates of study sites’ elevation, curvature, slope, soil organic carbon index (SOCI), and the probability of exposed B-horizon soil. Topsoil loss at the county- and state-levels was derived from analyses of agricultural land at selected sites across the study area. From WorldView imagery, 759 fields were identified that had exposed bare soil (210 km2) and were grouped into 28 sites. Gridded estimates of the SOCI and of the probability of exposed B-horizon soil were determined for each field within the sites. Topography measures, including elevation (m), curvature (m-1), and slope (deg), were extracted over the entire study area from LiDAR-derived digital elevation models acquired from 2003-2018 and at a 4 m resolution. Within each of the 28 study sites, the SOCI and topographic curvature values were extracted from co-located pixels. Topsoil loss was estimated from the relationship between subsoil exposure and topography and averaged across each site. The relationship between topsoil loss and topographic curvature was used to up-scale and predict topsoil and economic losses at the county and state-levels across the entire 375,000 km2 study area. The data have been used to demonstrate a robust and scalable method for estimating the magnitude of erosion in agricultural landscapes.
Related Publication:
Thaler, E.A., I.J. Larsen, and Q. Yu. in review. The scale of agriculturally-induces topsoil loss in the Corn Belt of the Midwestern U.S.
Thaler, E.A., I.J. Larsen, and Q. Yu. 2019. A New Index for Remote Sensing of Soil Organic Carbon Based Solely on Visible Wavelengths. Soil Science Society of America Journal, 83(5), pp.1443-1450. https://doi.org/10.2136/sssaj2018.09.0318
Acknowledgments:
This work was supported by the New (Early Career) Investigator Program in Earth Science grant number 80NSSC18K0747.
Data Characteristics
Spatial Coverage: 375,000 km2 of the Midwestern United States known as the Corn Belt
Spatial Resolution: 4 m
Temporal Coverage: Non-continuous satellite imagery captured from April 2003 to July 2018
Temporal Resolution: Once
Study Area: Latitude and longitude are given in decimal degrees.
| Site | Westernmost Longitude | Easternmost Longitude | Northernmost Latitude | Southernmost Latitude |
|---|---|---|---|---|
| Midwestern US | -97.32451 | -86.98604 | 46.04608 | 40.03966 |
Data File Information
This dataset includes 140 files in GeoTIFF (*.tif) format. There are five files for each of the 28 sites. And one file in Comma Separated Value (*.csv) format.
The naming convention for GeoTIFF files is site_##_X.tif, where:
## is the site number (01-28) and
X is one of five variable types (carb, curv, elev, probs, slope)
Table 1. File names and descriptions.
| File Name | Units | Description |
|---|---|---|
| site_##_carb | soil organic carbon index (SOCI; Thaler et al. 2019) | |
| site_##_curv | m-1 | topographic curvature (i.e., hillslope) in reciprocal meter; negative values signify convex topography, positive values signify concave topography, and a value of zero signifies a linear surface |
| site_##_elev | m | surface elevation in meters |
| site_##_probs | fraction | probability of B-horizon soil presence, 0 to 1 |
| site_##_slope | deg | topographic slope in degrees |
| topsoil_loss.csv | county data used to estimate topsoil and economic losses |
Data File Details
Missing values are represented by -9999. The coordinate reference system includes EPSG: 32614, 32615, and 32616 (WGS 84 / UTM zones 14N, 15N, and 16N). Each of the five files for a site contain the same number of rows and columns.
Table 2. Variable names and descriptions for topsoil_loss.csv.
| Variable | Units | Description |
|---|---|---|
| county_name | county name | |
| state_name | state name | |
| fips | unique county identifier | |
| area_ha | ha | land area in hectares |
| farm_cnt | cnt | number of farms |
| farm_area_mean_ac | ac | mean farm area in acres |
| farm_area_km2 | km2 | farmland area in square kilometers |
| corn_planted_ac | ac | corn planted in acres |
| soy_planted_ac | ac | soybean planted in acres |
| corn_harvest_ac | ac | corn harvest in acres |
| corn_harvest_ha | ha | corn harvest in hectares |
| soy_harvest_ac | ac | soybean harvest in acres |
| soy_harvest_ha | ha | soybean harvest in hectares |
| corn_yield_bu_per_ac | bu/ac | corn yield in bushels per acre |
| corn_yield_kg_per_ha | kg/ha | corn yield in kilograms per hectare |
| soy_yield_bu_per_ac | bu/ac | soybean yield in bushels per acre |
| soy_yield_kg_per_ha | kg/ha | soybean yield in kilograms per hectare |
| corn_econ_loss_usd | usd | economic loss from decreased corn yield in United States dollars |
| soy_econ_loss_usd | usd | economic loss from decreased soybean yield in United States dollars |
| farm_econ_loss_mean_usd | usd | mean economic loss per farm in United States dollars |
| farm_econ_loss_min_usd | usd | minimum economic loss per farm in United States dollars |
| farm_econ_loss_max_usd | usd | maximum economic loss per farm in United States dollar |
| econ_loss_mean_usd | usd | mean economic loss in United States dollars |
| econ_loss_min_usd | usd | minimum economic loss in United States dollars |
| econ_loss_max_usd | usd | maximum economic loss in United States dollars |
| econ_loss_usd_per_ha | usd/ha | mean economic loss in United States dollar per hectare |
| econ_loss_usd_per_km2 | usd/km2 | mean economic loss in United States dollar per square kilometers |
| topsoil_loss_km2 | km2 | topsoil loss in square kilometers |
| topsoil_loss_frac | frac | topsoil loss as fraction, 0 to 1 |
| topsoil_loss_error_frac | frac | uncertainty of topsoil loss as fraction, 0 to 1 |
| state_econ_loss_usd | usd | mean economic loss for state in United States dollars |
| state_topsoil_loss_frac | frac | mean topsoil loss for state as fraction, 0 to 1 |
Application and Derivation
This dataset provides estimates of topsoil loss across the Corn Belt region in the Midwestern US using a novel remote-sensing method for quantifying topsoil loss at individual fields and by relating topsoil loss and topography. The data have been used to demonstrate a robust and scalable method for estimating the magnitude of erosion in agricultural landscapes. See Thaler et al. (2020) for details.
Quality Assessment
The validity of the model predicting the SOCI was validated by plotting the receiver operator characteristic curve and calculating the area under the curve (AUC) for each site. AUC values ranged from 0.75 to 1.0, indicating that the logistic regression model well-classifies soil horizon based on SOCI values.
The uncertainty in estimates of topsoil and economic losses is derived from the standard deviation of the relationship between topsoil loss and topographic curvature. See Thaler et al. (2020) for details.
Data Acquisition, Materials, and Methods
Study Area
The dataset spatial extent covers an approximately 375,000 km2 region of the Midwestern US that is colloquially known as the Corn Belt, as it is where 75% of corn and 60% of soybeans are produced in the USA.
The availability of LiDAR-derived digital elevation models (DEMs) through The National Map Download Client (USGS 2019) dictated the specific extent of the study area. The LiDAR data were clipped to the Herbaceous Agricultural Vegetation layer from the US Geological Survey Gap Analysis Program (USGS 2011) so that analyses excluded areas with non-agricultural land. A total of 210 km2 (759 fields) of agricultural land across 28 sites were selected for analyses (Fig. 2).
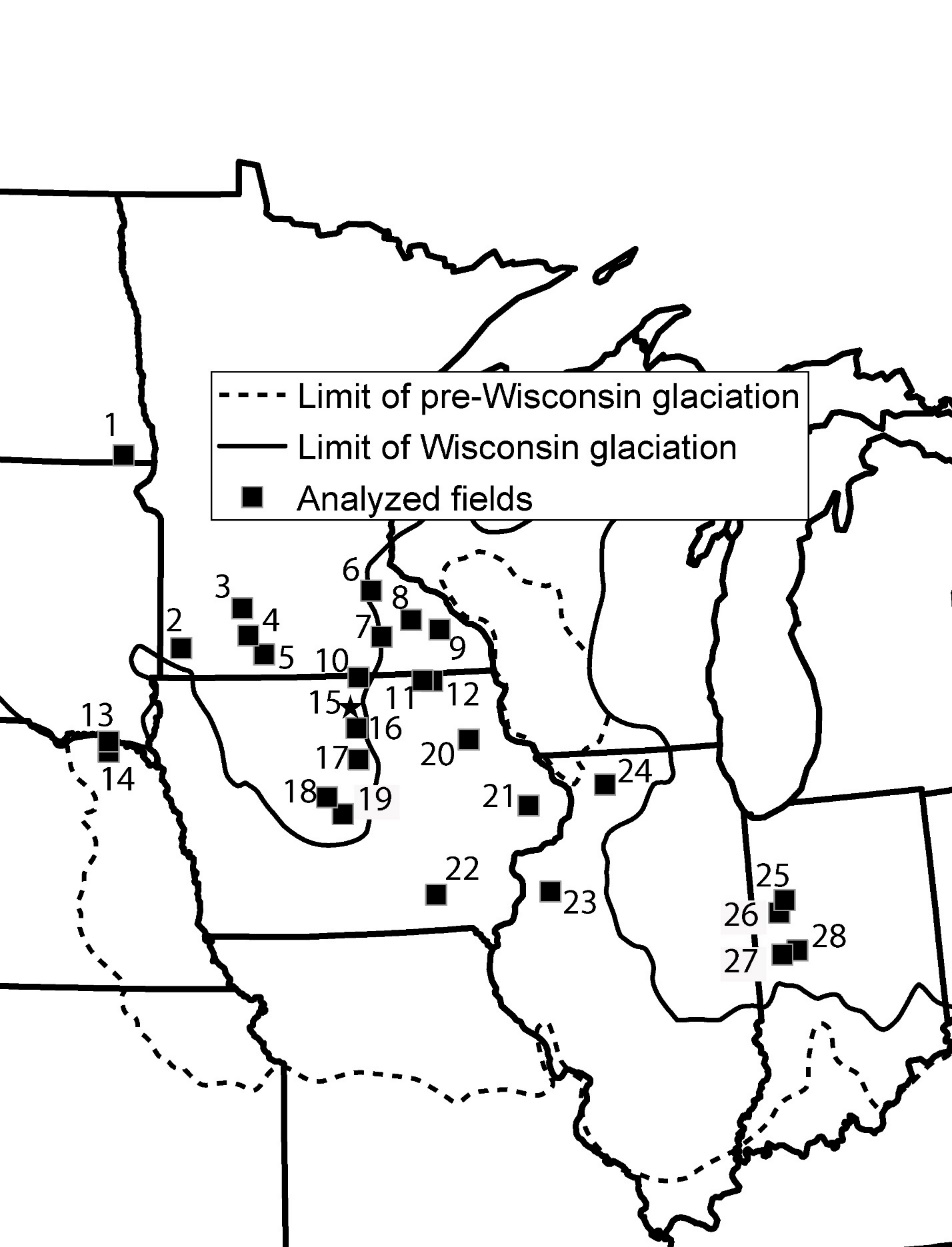
Figure 2. Location of study sites with site numbers corresponding to file names. For example, site_01_carb.tif and site_28_slope.tif. Source: Thaler et al., 2020
Soil Horizon
The National Geospatial-Intelligence Agency catalog of Digital Globe (Neigh et al., 2013) was used to identify WorldView-2 and WorldView-3 satellite imagery of plowed fields with exposed soil; 759 individual fields within 28 sites were selected. Soil horizon and soil organic carbon data for the area were retrieved from the US Department of Agriculture Natural Resources Conservation Service Rapid Carbon Assessment database (Willis et al. 2014). A newly developed soil organic carbon index (SOCI; Thaler et al. 2019) was used to differentiate between soil A- and B-horizons (i.e., topsoil and subsoil, respectively) of the plowed fields. Where soil A- and B-horizons were distinguishable, topographic slope and curvature were calculated as the first and second derivatives of elevation, respectively, using a 4 m resolution DEM (USGS 2011). Logistic regression was used to model the relationship between B-horizon exposure and topographic curvature at each site.
Soil & Economic Loss
Topsoil and annual economic loss were determined at the county and state levels. The relationships between B-horizon exposure and topographic curvature at the 28 sites (210 km2) were used to upscale the estimate of topsoil loss of the 3.7x10⁵ km2 Corn Belt region. The estimate of annual economic losses incurred from topsoil loss relied on the similarity between yield reductions for corn and soybeans in severely eroded soils (Langdale and Shrader 1982).
For details of the analyses and image processing, see Thaler et al. (2020).
Data Access
These data are available through the Oak Ridge National Laboratory (ORNL) Distributed Active Archive Center (DAAC).
Remote Sensing Derived Topsoil and Agricultural Economic Losses, Midwestern USA
Contact for Data Center Access Information:
- E-mail: uso@daac.ornl.gov
- Telephone: +1 (865) 241-3952
References
Langdale, G.W. and Shrader, W.D. 1982. Soil erosion effects on soil productivity of cultivated cropland 1. Determinants of Soil Loss Tolerance. ASA Special Publication 45. Determinants of Soil Loss Tolerance, pp. 41-51. https://doi.org/10.2134/asaspecpub45.c4
Neigh C.S., Masek J.G. and Nickeson J.E. 2013 HighâÂÂÂÂresolution satellite data open for government research. Eos, Transactions American Geophysical Union 94(13): 121-123.
Thaler, E.A., Larsen, I.J., and Yu, Q. 2020 The scale of agriculturally-induces topsoil loss in the Corn Belt of the Midwestern U.S. Proceeding of the National Academy of Sciences, in review.
Thaler, E.A., Larsen, I.J., and Yu, Q., 2019. A New Index for Remote Sensing of Soil Organic Carbon Based Solely on Visible Wavelengths. Soil Science Society of America Journal, 83(5), pp.1443-1450. https://doi.org/10.2136/sssaj2018.09.0318
U.S. Geological Survey Gap Analysis Program, 20160513, GAP/LANDFIRE National Terrestrial Ecosystems 2011: U.S. Geological Survey, https://doi.org/10.5066/F7ZS2TM0
U.S. Geological Survey, 2019, The National Map—New data delivery homepage, advanced viewer, lidar visualization: US. Geological Survey Fact Sheet 2019. https://doi.org/10.3133/fs20193032
Willis, S., Loecke, T., Sequeira, C., Teachman, G., Grunwald, S., and West, L.T., 2014. Overview of the US rapid carbon assessment project: sampling design, initial summary and uncertainty estimates. In Soil Carbon, A.E. Hartemink, K. McSweeney (Eds.), Springer International Publishing, Cham., pp. 95-104. https://doi.org/10.1007/978-3-319-04084-4_10