Documentation Revision Date: 2021-02-28
Dataset Version: 5
Summary
Soil respiration, the flux of autotrophically- and heterotrophically-generated CO2 from the soil to the atmosphere, remains the least well-constrained component of the terrestrial carbon cycle. Previous ancillary information fields were revised for consistency and simplicity and several new fields (e.g., measurement time, collar insertion depth, and collar area) were added. V5 provides opportunities for the biogeochemistry community to better understand the spatial and temporal variability of Rs, its components, and the overall carbon cycle.
There are 3 data files in comma-separated value (*.csv) format and 5 companion files included in this dataset.
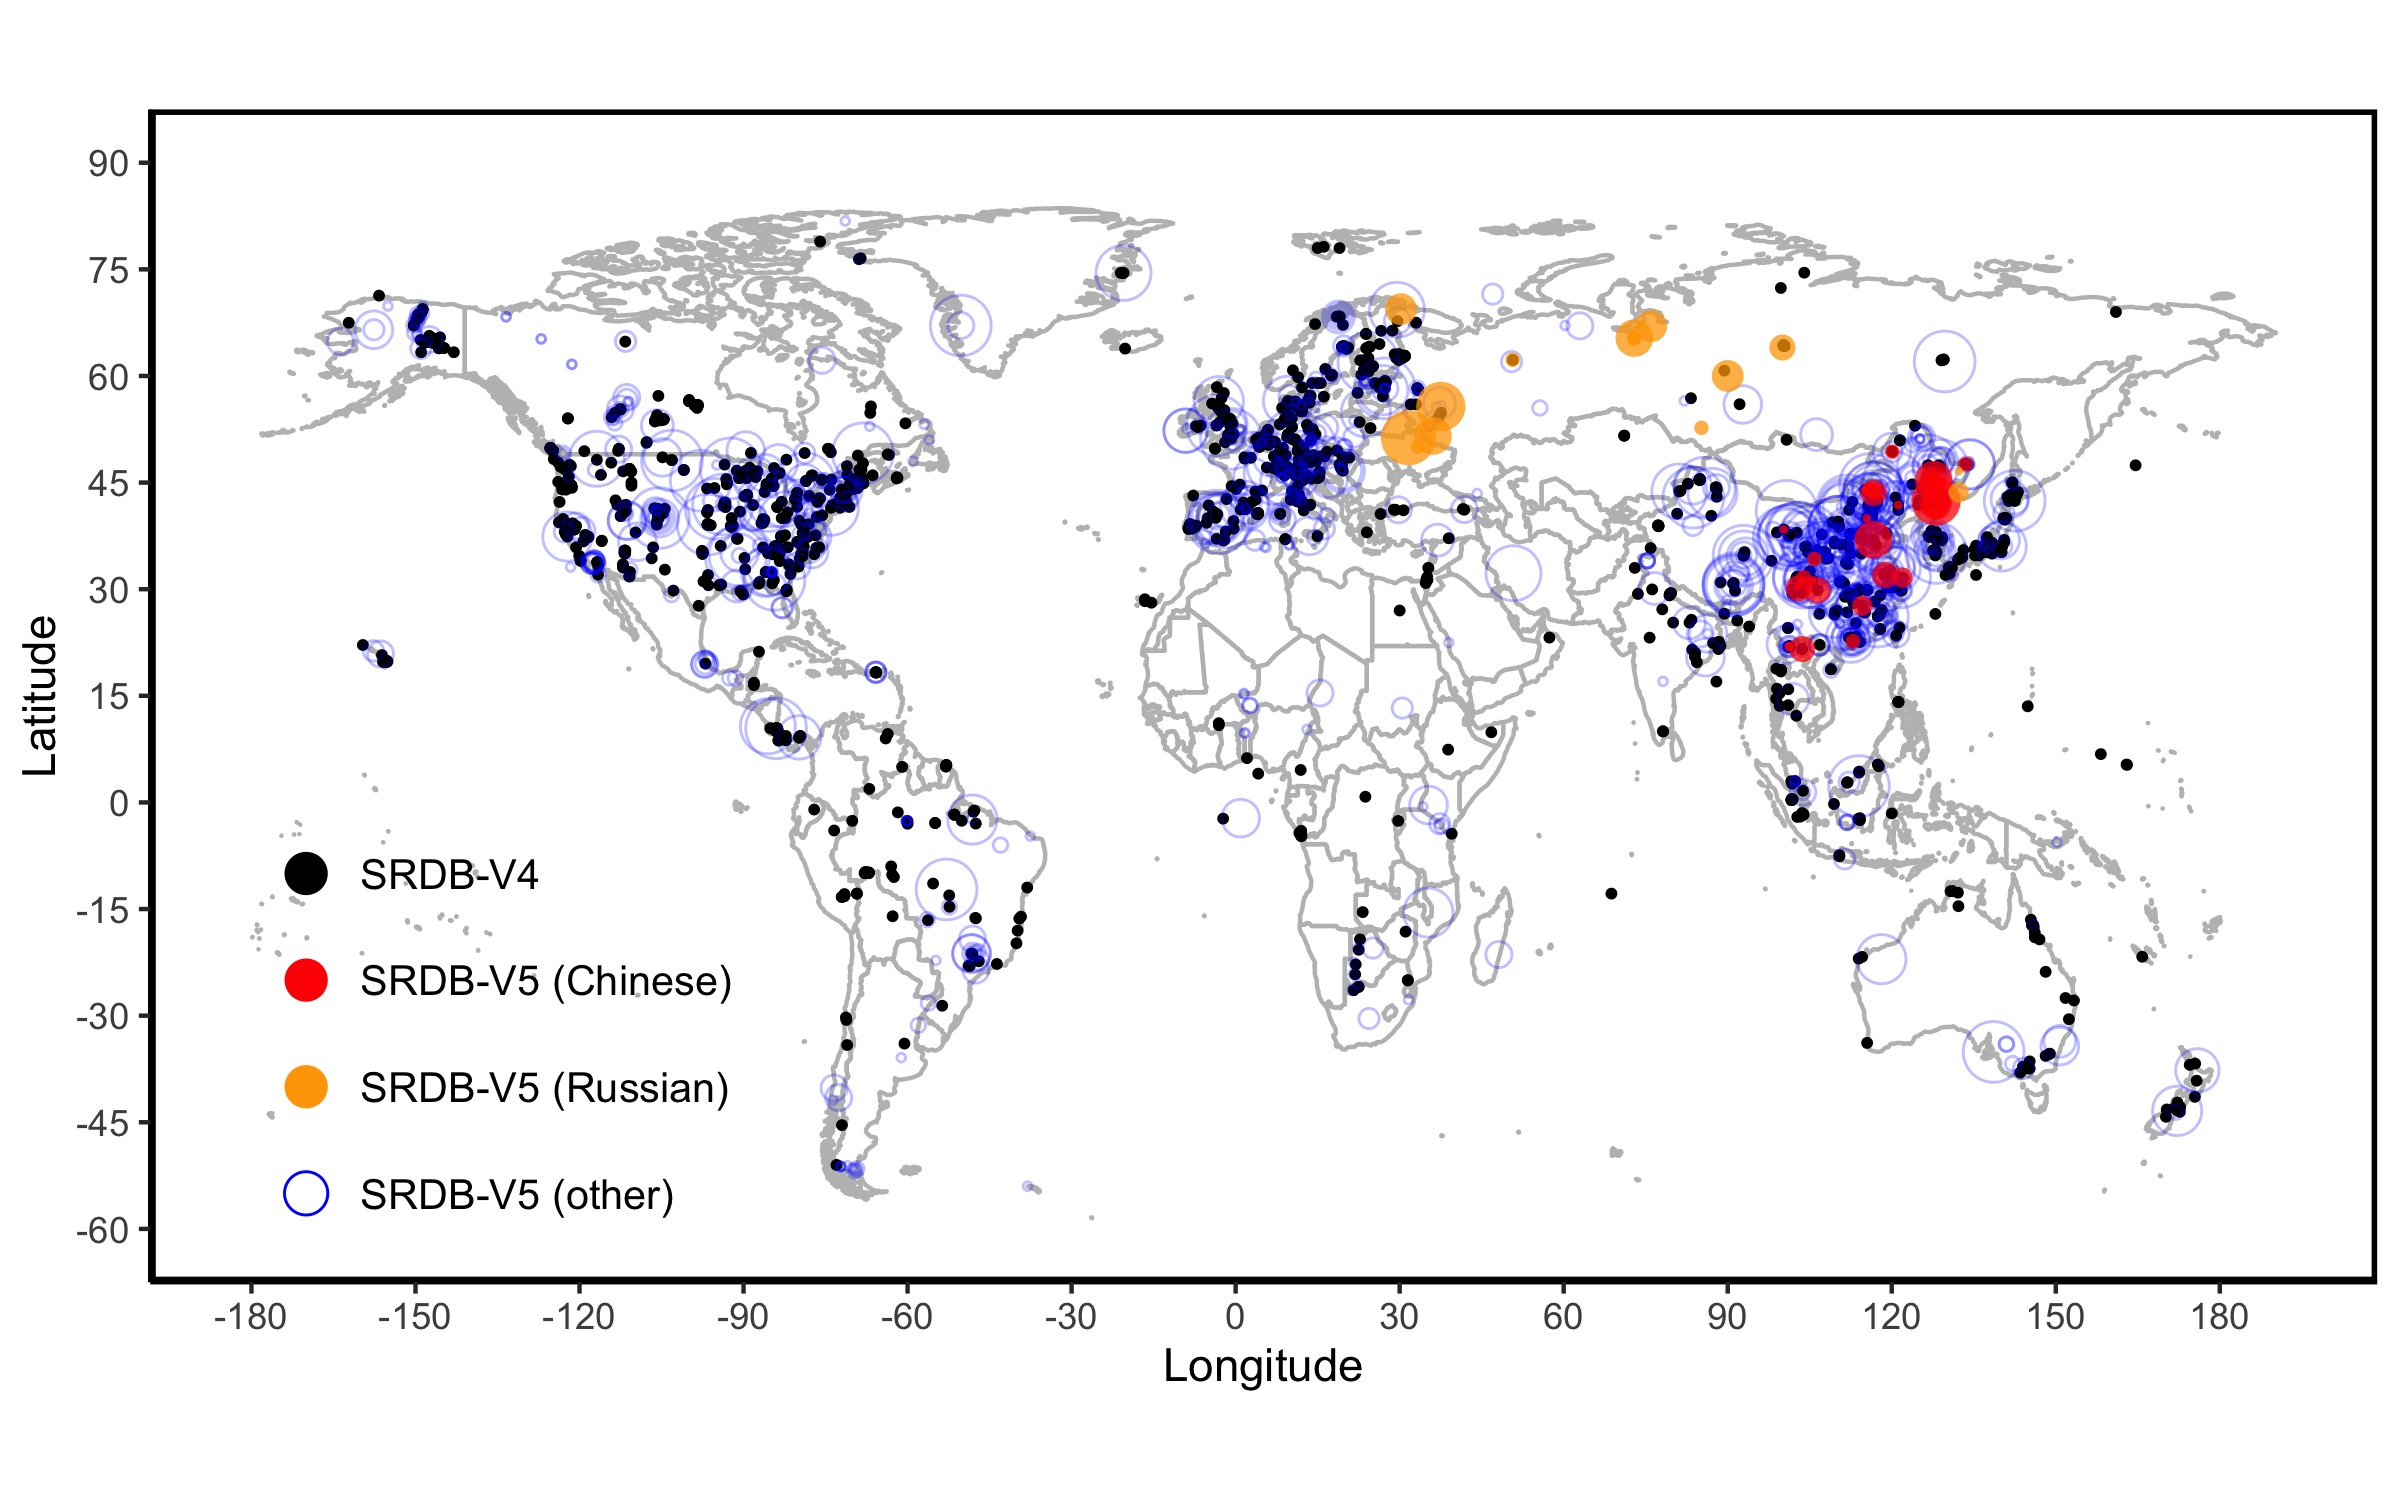
Figure 1. Locations of SRDB V5 observations. SRDB-V4 are all observations in V4 database (n=1584). SRDB-V5 (Chinese) are new sites from Chinese literature (n=41). SRDB-V5 (Russian) are new sites from Russian literature (n=16). SRDB-V5 (other) are new sites from literature published in other languages (primarily English) (n=840). The size of circles represents the sample size at each site, where larger circles signify more data. Source: Jian et al. (2020)
Citation
Jian, J., R. Vargas, K.J. Anderson-Teixeira, E. Stell, V. Herrmann, M. Horn, N. Kholod, J. Manzon, R. Marchesi, D. Paredes, and B.P. Bond-Lamberty. 2021. A Global Database of Soil Respiration Data, Version 5.0. ORNL DAAC, Oak Ridge, Tennessee, USA. https://doi.org/10.3334/ORNLDAAC/1827
Table of Contents
- Dataset Overview
- Data Characteristics
- Application and Derivation
- Quality Assessment
- Data Acquisition, Materials, and Methods
- Data Access
- References
- Dataset Revisions
Dataset Overview
The Soil Respiration Database (SRDB) is a near-universal compendium of published soil respiration (Rs) data. The database encompasses published studies that report at least one of the following data measured in the field (not laboratory): annual soil respiration, mean seasonal soil respiration, a seasonal or annual partitioning of soil respiration into its source fluxes, soil respiration temperature response (Q10), or soil respiration at 10 degrees C. The SRDB's orientation is to seasonal and annual fluxes, not shorter-term or chamber-specific measurements, and the database is dominated by temperate, well-drained forest measurement locations. Version 5 (V5) is the compilation of 2,266 published studies with measurements taken between 1961–2017. V5 features more soil respiration data published in Russian and Chinese scientific literature for better global spatio-temporal coverage and improved global climate-space representation. The database is also restructured to have better interoperability with other datasets related to carbon-cycle science.
Soil respiration, the flux of autotrophically- and heterotrophically-generated CO2 from the soil to the atmosphere, remains the least well-constrained component of the terrestrial carbon cycle. Previous ancillary information fields were revised for consistency and simplicity and several new fields (e.g., measurement time, collar insertion depth, and collar area) were added. V5 provides opportunities for the biogeochemistry community to better understand the spatial and temporal variability of Rs, its components, and the overall carbon cycle.
Related Publications
Bond-Lamberty, B., and A.M. Thomson. 2010. A global database of soil respiration measurements. Biogeosciences. 7:1321-1344. https://doi.org/10.5194/bgd-7-1321-2010
Jian, J., Vargas, R., Anderson-Teixeira, K., Stell, E., Herrmann, V., Horn, M., Kholod, N., Manzon, J., Marchesi, R., Paredes, D., and Bond-Lamberty, B.: A restructured and updated global soil respiration database (SRDB-V5). Earth System Science Data 13:255–267. https://doi.org/10.5194/essd-2020-136
User Notes
Information provided in related publications will not be identical to the information provided here owing to revisions made while compiling new versions of the dataset.
The compilers of the SRDB database (Bond-Lamberty and Thomson, 2010) make it available to the scientific community both as a traditional, static archive and as a dynamic community database hosted on GitHub at https://github.com/bpbond/srdb that accepts contributions from users. Citations for the dynamic database should always include a version number and download date.
Data Characteristics
Spatial Coverage: Global
Spatial Resolution: Points
Temporal Coverage: 1961-01-01 to 2017-12-31
Temporal Resolution: Annual and seasonal
Site Boundaries: Latitudes and longitudes are provided in decimal degrees.
| Site | Westernmost Longitude | Easternmost Longitude | Northernmost Latitude | Southernmost Latitude |
|---|---|---|---|---|
| Global | -163.71 | 175.897 | 81.8 | -78.02 |
Data File Information
There are 3 data files in comma-separated value (*.csv) format and 5 companion files are included in this dataset.
Table 1. File names and descriptions.
| File Name | Description |
|---|---|
| Data Files | |
| srdb-data-V5.csv | soil respiration and contextual data |
| srdb-studies-V5.csv | bibliographic information for the studies that appear in and or all studies reviewed for inclusion into the SRDB for which only a subset has met the criteria for inclusion in srdb-data-V5.csv (the Study_number field is common to both files) |
| srdb-equations-V5.csv | responses of soil respiration to temperature and moisture for selected studies described in srdb-data-V5.csv (the Record_number field is common to both files) |
| Companion Files | |
| SRDBv5.R | R script used to check SRDB data for consistency, columns types, out of bounds, etc. |
| srdb-data_fields_V5.txt | List of fields in srdb-data-V5.csv |
| srdb-studies_fields_V5.txt | List of fields in srdb-studies-V5.csv |
| srdb-equations_fields_V5.txt | List fields in srdb-equations-V5.csv |
| calculations_worksheets_V5.zip | Calculations necessary for a study to estimate annual flux and notes recorded in an Excel spreadsheet in a compressed file format |
Data File Details
Missing values are represented as -9999 for numeric data or NA for text data. Many fields have empty values.
Table 1. Column names and descriptions for srdb-data-V5.csv. Data field descriptions provide contextual information useful for filtering data, especially by fields Quality_flag, CO2_method (e.g., exclude "soda lime" measurements), Manipulation (e.g., filter to "None" to look at un-manipulated systems), Ecosystem_state, and Ecosystem_type.
| Column Number | Column Name | Description |
|---|---|---|
| Metadata | ||
| 1 | Record_number | Record number: Index to srdb-equations-V5.csv |
| 2 | Entry_date | Entry date (yyyy-mm-dd) |
| 3 | Study_number | Study number: Index to srdb-studies-V5.csv |
| 4 | Author | Name of first author |
| 5 | Duplicate_record | Quantifies if record a known duplicate (Study_number) |
| 6 | Quality_flag | Quality control flags Q0 default/none Q01 estimated from figure Q02 data from another study Q03 data estimated--other Q04 potentially useful future data Q10 potential problem with data Q11 suspected problem with data Q12 known problem with data Q13 duplicate Q14 inconsistency Details can generally be found in the Notes field |
| 7 | Contributor | Data contributor |
| Site and Measurement Data | ||
| 8 | Country | Country |
| 9 | Region | State/province/region |
| 10 | Site_name | Name of the study site |
| 11 | Site_ID | Identification code for study site; typically, Study_number + Site_ID + Study_midyear is unique |
| 12 | Study_midyear | Year study was performed (middle year if multiple years) |
| 13 | Years_of_data | Years of data; always ≥1 |
| 14 | Latitude | Latitude in decimal degree |
| 15 | Longitude | Longitude in decimal degree |
| 16 | Elevation | Elevation in m |
| 17 | Manipulation | Manipulation performed (CO2, fertilization, etc.) |
| 18 | Manipulation_level | Manipulation amount or description |
| 19 | Age_ecosystem | Time since ecosystem establishment in years; used when the time of conversion (e.g., forest to agriculture) is known |
| 20 | Age_disturbance | Time since disturbance in years |
| 21 | Species | Dominant species |
| 22 | Biome | Biome type assigned (e.g., boreal, temperate) |
| 23 | Ecosystem_type | Ecosystem type assigned (e.g., grassland, forest) |
| 24 | Ecosystem_state | Ecosystem state (managed, unmanaged, natural); unmanaged refers to human management or disturbance in the past but not at the time of the study |
| 25 | Leaf_habit | Dominant leaf habit (deciduous, evergreen) |
| 26 | Stage | Developmental stage assigned (aggrading, mature) |
| 27 | Soil_type | Soil description (classification and texture) |
| 28 | Soil_drainage | Soil drainage assigned (dry, wet); dry is equivalent to well-drained uplands and wet is equivalent to peatlands, swamps, etc. |
| 29 | Soil_BD | Soil bulk density in g cm-3 |
| 30 | Soil_CN | Soil C:N ratio |
| 31 | Soil_sand | Soil percent sand |
| 32 | Soil_silt | Soil percent silt |
| 33 | Soil_clay | Soil percent clay |
| 34 | MAT | Reported mean annual temperature in degrees C |
| 35 | MAP | Reported mean annual precipitation in mm |
| 36 | PET | Reported potential evapotranspiration in mm |
| 37 | Study_temp | Annual temperature in year of study in degrees C |
| 38 | Study_precip | Annual precipitation in year study of study in mm |
| 39 | Meas_method | CO2 measurement method |
| 40 | Collar_height | Total height of collar in cm |
| 41 | Collar_depth | Depth of collar insertion in cm |
| 42 | Chamber_area | Area of measurement chamber in cm2 |
| 43 | Time_of_day | Time of day measurements were made in hours (H1toH2) |
| 44 | Meas_interval | Mean interval between soil respiration measurements in days |
| 45 | Annual_coverage | Fraction of annual coverage of soil respiration measurements (1.0 = full year) |
| 46 | Partition_method | Method used to partition soil respiration source fluxes (Bond-Lamberty et al., 2004) |
| Annual and Seasonal Rs Fluxes | ||
| 47 | Rs_annual | Annual C flux from soil respiration in g C m-2; this can be reported directly by the study, calculated from reported mean fluxes, or estimated from a figure (in which case, the Quality_flag field is employed) |
| 48 | Rs_annual_err | Error (typically plot-to-plot) for soil respiration annual in g C m-2 |
| 49 | Rs_interann_err | Interannual error reported for annual soil respiration in g C m-2; this is occasionally reported by authors or defined as the standard deviation between yeari and yeari + 1 (n = 2) |
| 50 | Rlitter_annual | Annual soil respiration flux from litter in g C m-2 fraction |
| 51 | Ra_annual | Annual autotrophic soil respiration flux in g C m-2 |
| 52 | Rh_annual | Annual heterotrophic soil respiration flux in g C m-2 |
| 53 | RC_annual | Root contribution to soil respiration annual fraction |
| 54 | Rs_spring | Mean spring* soil respiration flux in µmol m-2 s-1 |
| 55 | Rs_summer | Mean summer* soil respiration flux in µmol m-2 s-1 |
| 56 | Rs_autumn | Mean autumn* soil respiration flux in µmol m-2 s-1 |
| 57 | Rs_winter | Mean winter* soil respiration flux in µmol m-2 s-1 |
| 58 | Rs_growing | Mean growing season* soil respiration flux in µmol m-2 s-1 |
| 59 | Rs_wet | Mean wet season* soil respiration flux in µmol m-2 s-1 |
| 60 | Rs_dry | Mean dry season* soil respiration flux in µmol m-2 s-1 |
| 61 | RC_seasonal | Fraction of root contribution to seasonal* soil respiration |
| 62 | RC_season | Season* of root contribution |
| Ancillary Pools and Fluxes | ||
| 63 | GPP | Annual gross primary production at the site in g C m-2 |
| 64 | ER | Annual ecosystem respiration at the site in g C m-2 |
| 65 | NEP | Annual net ecosystem production at the site in g C m-2 |
| 66 | NPP | Annual net primary production at the site in g C m-2 |
| 67 | ANPP | Annual aboveground NPP at the site in g C m-2 |
| 68 | BNPP | Annual belowground NPP at the site in g C m-2 |
| 69 | NPP_FR | Annual fine root NPP at the site in g C m-2 |
| 70 | TBCA | Total belowground carbon allocation at the site in g C m-2 |
| 71 | Litter_flux | Annual aboveground litter flux in g C m-2; (leaf only, leaf and fine woody material, all material, etc); generally, should not include large woody material; inconsistently reported |
| 72 | Rootlitter_flux | Annual belowground litter flux in g C m-2 |
| 73 | TotDet_flux | Annual total litter flux in g C m-2; (~ Litter_flux + Rootlitter_flux) |
| 74 | Ndep | Annual nitrogen deposition in g N m-2 |
| 75 | LAI | Leaf area index at the site in m2 m-2; hemispheric (one-sided) when possible |
| 76 | BA | Basal area at site in m2 ha-1 |
| 77 | C_veg_total | Total carbon** in vegetation in g C m-2 (C_AG + C_BG) |
| 78 | C_AG | Total carbon** in aboveground vegetation in g C m-2 |
| 79 | C_BG | Total carbon** in belowground vegetation in g C m-2 |
| 80 | C_CR | Total carbon in** coarse roots in g C m-2 |
| 81 | C_FR | Total carbon** in fine roots in g C m-2 |
| 82 | C_litter | Total carbon** in standing litter in g C m-2 |
| 83 | C_soilmineral | Total carbon** in soil organic matter in g C m-2 |
| 84 | C_soildepth | Depth of soil for which carbon was measured in cm |
| 85 | Notes | Notes |
* The temporal extent of a season was defined by the investigators.
** C_ fields related to biomass are converted to carbon using a ratio of 0.5 unless study-specific values were available.
Table 2. Column names and descriptions for srdb-studies-V5.csv. The content includes bibliographic information for all studies reviewed for inclusion into the SRDB. Only a subset has met the criteria (as outlined in Section 5).
| Column Number | Column Name | Description |
|---|---|---|
| 1 | Study_number | Study number: Index to srdb-data-V5.csv |
| 2 | Authors | Study authors |
| 3 | Title | Study title |
| 4 | Source | Study source, usually the journal name |
| 5 | Volume | Volume number |
| 6 | Issue | Issue number |
| 7 | Bp | Beginning page |
| 8 | Ep | Ending page |
| 9 | Pubyear | Publication year |
| 10 | Notes | Notes |
| 11 |
Citations |
Citations |
| 12 | DE | Data entry: Entered into srdb-data-V5.csv (Y/N) |
| 13 | DLD | Downloaded: Study acquired (Y/N) |
| 14 | DOI | Digital object identifier |
| 15 | nonEnglish | Study in a non-English language (Y/N) |
| 16 | Rank | Rank (1=highly relevant to 4=not relevant); this score is not an assessment of the study's scientific merit or validity but a judgment, based on reading the abstract and title, of how relevant this study is to the data (i.e., the likelihood of having appropriate data) |
| 17 | SearchDate | Date search performed (yyyy-mm-dd) |
| 18 | SearchTerm | Web of Science search term used |
Table 3. Column names and descriptions for srdb-equations-V5.csv. The content represents the response of Rs to temperature and moisture.
| Column Number | Column Name | Description |
|---|---|---|
| 0 | Record_number | Record number: Index to srdb-data-V5.csv |
| 1 | Model_type | Temperature-response model used |
| 2 | Temp_effect | Temperature effect on Rs (none, positive, negative) |
| 3 | Model_output_units | Temperature-response model output units |
| 4 | Model_temp_min | Minimum soil temperature over which model fitted in degrees C |
| 5 | Model_temp_max | Maximum soil temperature over which model fitted in degrees C |
| 6 | Model_N | Model N |
| 7 | Model_R2 | Model R-squared |
| 8 | T_depth | Depth at which soil temperature recorded in cm; a value of -200 (i.e., 2 m above ground) is used for air temperature |
| 9 | Model_paramA | Model parameter A |
| 10 | Model_paramB | Model parameter B |
| 11 | Model_paramC | Model parameter C |
| 12 | Model_paramD | Model parameter D |
| 13 | Model_paramE | Model parameter E |
| 14 | WC_effect | Soil water effect on Rs |
| 15 | R10 | Rs at 10 degrees C in µmol m-2 s-1 |
| 16 | Q10_0_10 | Q10 temperature response*** (0-10 degrees C) |
| 17 | Q10_5_15 | Q10 temperature response*** (5-15 degrees C) |
| 18 | Q10_10_20 | Q10 temperature response*** (10-20 degrees C) |
| 19 | Q10_0_20 | Q10 temperature response*** (0-20 degrees C) |
| 20 | Q10_other1 | Q10 temperature response*** (other temp range) |
| 21 | Q10_other1_temp_min | Minimum soil temperature over which Q10_other1 fitted in degrees C |
| 22 | Q10_other1_temp_max | Maximum soil temperature over which Q10_other1 fitted in degrees C |
| 23 | Q10_other2 | Q10 temperature response*** (other temp range) |
| 24 | Q10_other2_temp_min | Minimum soil temperature over which Q10_other2 fitted in degrees C |
| 25 | Q10_other2_temp_max | Maximum soil temperature over which Q10_other2 fitted in degrees C |
*** Values for Q10 fields are either reported by authors, calculated from reported Rs temperature regressions, or occasionally estimated from figures (in which case, the Quality_flag field is employed).
Application and Derivation
This is a database compiled from published studies about soil surface CO2 flux (i.e., soil respiration) measured in the field and is intended to serve as a resource for scientific analysis.
The V5 database was restructured to have has better interoperability with other datasets related to carbon cycle science. V5 has all fields from the previous version, but the fields have been revised for consistency and simplicity and several new fields have been added to include ancillary information (e.g., Rs measurement times, collar insertion depth, collar area). In addition, the Site_ID field (a unique identifier for a study site) was added allowing linkage to an hourly timescale global soil respiration database (HGRsD; Jian and Steele, 2018) and the open community database of continuous soil respiration and other chamber flux data (COSORE; Bond-Lamberty et al., 2020), enabling researchers to explore data integration and comparative studies.
The primary soil respiration units used were g C m-2 yr-1 for annual fluxes and µmol m-2 s-1 for mean seasonal fluxes. When necessary, the units were converted from those provided in the study. A variety of ancillary data were also included when provided in the literature, including site-related and experimental data, information on ecosystem structure and function, and methods. A ratio of 12:44 was assumed for C to CO2 molecular weights and biomass was assumed to be 50% C unless specified otherwise in the study.
Quality Assessment
Data were cross-checked against a number of other soil respiration data collections and metaanalyses including Hibbard et al. (2005), Chen and Tian (2005), Burton et al. (2008), and Sotta et al. (2004). Quality flags were assigned based on information provided in a given study and the investigator's judgment.
Data Acquisition, Materials, and Methods
SRDB Inclusion Criteria
Short term experiments (i.e., soil respiration measurements made over less than 1–2 weeks) were not entered unless the study authors extrapolated their results to seasonal or annual values; the database is generally not designed to accommodate instantaneous or short-term measurements. In general, no additional research was performed to find older publications that were not listed in the Web of Science. To qualify for inclusion, a study had to report at least one of the following data:
- Annual soil respiration
- Mean seasonal soil respiration
- Annual or seasonal partitioning of soil respiration sources
- Q10 and associated temperature range
- R10 (soil respiration at 10 degrees C)
If at least one of these data were reported or could be calculated with few or no assumptions (e.g., easily estimated from points in a figure), the study was entered into the database. For example, sometimes a study will show monthly soil respiration in a figure but not compute an annual flux, so estimates were made from a figure. This is documented using the Quality_flag field.
Flux Calculation Log
When it was necessary to calculate or estimate annual flux for one of the studies, these calculations and notes were recorded in an Excel spreadsheet (*.xlsx). The name of the Excel files begin with the Study_number indexed in srdb-studies-V5.csv and srdb-data-V5.csv (e.g., "0020 WitkampEcology 1966.xlsx", "4634 Webster JGR 2008.xlsx"). The spreadsheets are provided as the companion file calculations_worksheets_v5.zip.
Data Access
These data are available through the Oak Ridge National Laboratory (ORNL) Distributed Active Archive Center (DAAC).
A Global Database of Soil Respiration Data, Version 5.0
Contact for Data Center Access Information:
- E-mail: uso@daac.ornl.gov
- Telephone: +1 (865) 241-3952
References
BondâÂÂÂÂLamberty, Ben, Danielle S. Christianson, Avni Malhotra, Stephanie C. Pennington, Debjani Sihi, Amir AghaKouchak, Hassan Anjileli et al. "COSORE: A community database for continuous soil respiration and other soilâÂÂÂÂatmosphere greenhouse gas flux data." Global change biology 26, no. 12 (2020): 7268-7283. https://doi.org/10.1111/gcb.15353
Bond-Lamberty, B., and A.M. Thomson. 2010. A global database of soil respiration measurements. Biogeosciences 7:1321–1344. https://doi.org/10.5194/bgd-7-1321-2010
Burton, A.J., J.M. Melillo, and S.D. Frey. 2008. Adjustment of forest ecosystem root respiration as temperature warms. Journal of Integrative Plant Biology 50:1467–1483. https://doi.org/10.1111/j.1744-7909.2008.00750.x
Chen, H., and H.Q. Tian. 2005. Does a general temperature-dependent Q(10) model of soil respiration exist at biome and global scale? Journal of Integrative Plant Biology 47:1288–1302. https://doi.org/10.1111/j.1744-7909.2005.00211.x
Hibbard, K.A., B.E. Law, and J. Sulzman. 2005. An analysis of soil respiration across northern hemisphere temperate ecosystems. Biogeochemistry 73:29–70. https://doi.org/10.1007/s10533-004-2946-0
Jian, J., and M. Steele. 2018. Hourly and Daily Timescale Global Soil Respiration Data (HGRsD) [Data set]. University Libraries, Virginia Tech. https://doi.org/10.7294/W4V9867V
Jian, J., Vargas, R., Anderson-Teixeira, K., Stell, E., Herrmann, V., Horn, M., Kholod, N., Manzon, J., Marchesi, R., Paredes, D., and Bond-Lamberty, B.: A restructured and updated global soil respiration database (SRDB-V5). Earth System Science Data 13:255–267. https://doi.org/10.5194/essd-2020-136
Sotta, E.D., P. Meir, Y. Malhi, A.D. Nobre, M. Hodnett, and J. Grace. 2004. Soil CO2 efflux in a tropical forest in the central Amazon. Global Change Biology 10:601–617. https://doi.org/10.1111/j.1529-8817.2003.00761.x
Dataset Revisions
| Version | Release Date | Number of Records | Date Range |
|---|---|---|---|
| 5.0 | 2021-02-28 | 10,366 | 1961–2017 |
| 4.1 | 2018-12-17 | 6,633 | 1961–2016 |
| 4.0 | 2018-11-21 | 6,631 | 1961–2016 |
| 3.0 | 2014-07-24 | 5,173 | 1961–2012 |
| 2.0 | 2012-03-01 | 4,387 | 1961–2009 |
| 1.0 | 2010-04-30 | 3,379 | 1961–2007 |
SRDB Version History Details
Version 1
Investigators collected all available studies in the peer-reviewed scientific literature reporting soil respiration measured in the field. Lab incubation studies were not included. Web of Science was used to search for publications through the year 2008, and the search terms included "soil respiration," "soil CO2 evolution," and others. Each study's title and abstract were used to decide whether to acquire it. Approximately 40% of the almost 4,700 studies were acquired and examined.
Version 2
Publications from 2009, 2010, and from the first half of 2011 were included, and Rs data from 164 studies were added. The Google Earth (*.kmz) file of site locations was updated. Values for the Age_disturbance field were corrected and completed. The Partition_method field was fixed for many records. Finally, three fields, Chamber_method, CH4_flux, and N2O_flux, were deleted because the fields were inconsistent or almost never used.
Version 3.0
Publications from 2012 and Rs data from a total of 466 new studies were added. Many corrections were made to older data and an R script for error-checking and mapping was created. The compressed Keyhole Markup Language (*.kmz) file was removed and the CO2_method field was renamed to Meas_method. Additionally, two new fields, Meas_interval and Annual_coverage, were added.
Version 4.0
Publications through 2017 were reviewed, and data from 1,750 studies were added constituting 6,631 records total. Many corrections were made to older data. The data are dominated by temperate, well-drained forests. The materials were collected from the GitHub repository.
Version 4.1
The file srdb-studies-V4.csv was updated with a new file available from the GitHub repository.
Version 5.0
V5 includes data from 2,266 unique published studies through 2017. Observations increased by more than 3,000 to 10,366. This version features more Rs data published in the Russian and Chinese scientific literature for improved global spatio-temporal coverage and improved global climate-space representation. V5 is described in detail in Jian et al. (2020).
Changes implemented in srdb-data-V5.csv data file included:
- The set of columns related to the response of Rs to temperature and moisture were removed from srdb-data-V5.csv and are provided in the new data file srdb-equations-V5.csv. The Record_number field is common to both files.
- Additional fields include Site_ID, Collar_height, Collar_depth, Chamber_area, and Time_of_day.
- Removed fields include Rs_max, Rs_maxday, Rs_min, and Rs_minday.
Changes implemented in srdb-studies-V5.csv data file included:
- Removed the fields abstract, tf, ut, sn, and copy.
The srdb-equations-V5.csv data file is new for V5 but includes previously provided data columns related to the response of Rs to temperature and moisture extracted from srdb-data-V5.csv. The Record_number field is common to both files.