Documentation Revision Date: 2020-04-22
Dataset Version: 4.1
Summary
The dataset includes 2 files in comma-separated (.csv) format: a compilation of soil respiration data from published studies and a bibliography of the published studies.
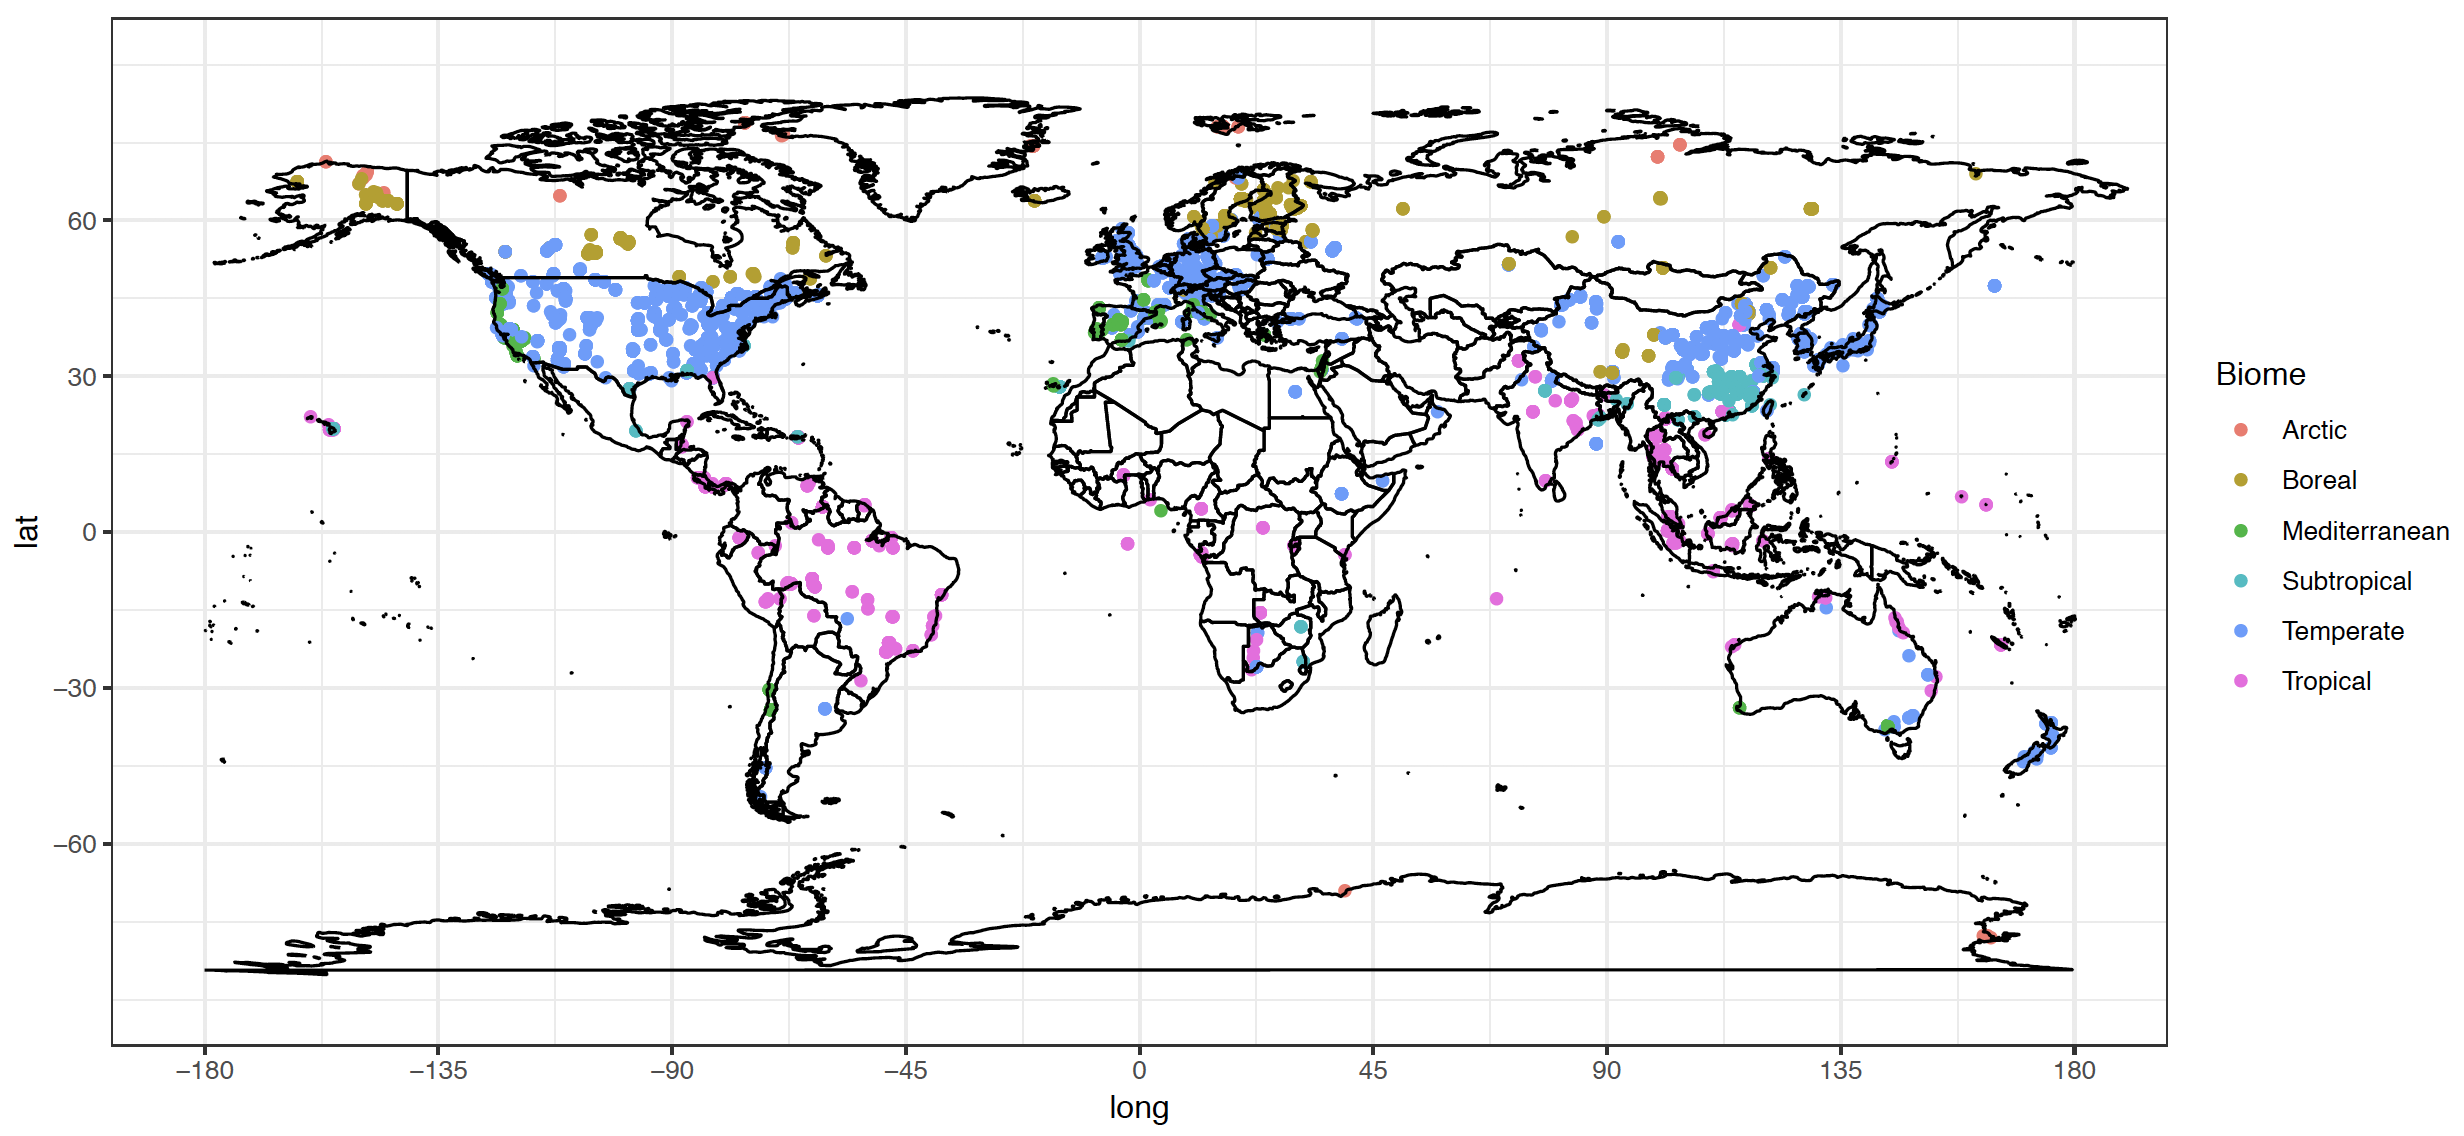
Figure 1: Locations of SRDB V4 observations, colored by biome. Map produced by the companion SRDBv4.R script.
Citation
Bond-Lamberty, B.P., and A.M. Thomson. 2018. A Global Database of Soil Respiration Data, Version 4.0. ORNL DAAC, Oak Ridge, Tennessee, USA. https://doi.org/10.3334/ORNLDAAC/1578
Table of Contents
- Dataset Overview
- Data Characteristics
- Application and Derivation
- Quality Assessment
- Data Acquisition, Materials, and Methods
- Data Access
- References
- Dataset Revisions
Dataset Overview
This dataset provides an update to the Soil Respiration Database (SRDB), a near-universal compendium of published soil respiration data. Soil respiration, the flux of autotrophically- and heterotrophically-generated CO2 from the soil to the atmosphere, remains the least well-constrained component of the terrestrial carbon cycle. The database encompasses all published studies that report at least one of the following data measured in the field (not laboratory): annual soil respiration, mean seasonal soil respiration, a seasonal or annual partitioning of soil respiration into its source fluxes, soil respiration temperature response (Q10), or soil respiration at 10 degrees C. The SRDB's orientation is thus to seasonal and annual fluxes, not shorter-term or chamber-specific measurements, and the database is dominated by temperate, well-drained forest measurement locations. Version 4 is the compilation of 1458 published studies with measurements taken between 1961 and 2016.
Related Publication
Bond-Lamberty, B., and A.M. Thomson. 2010. A global database of soil respiration measurements. Biogeosciences. 7:1321-1344. https://doi.org/10.5194/bgd-7-1321-2010
User Note
The compilers of the SRDB database (Bond-Lamberty and Thomson, 2010) make it available to the scientific community both as a traditional static archive (through the ORNL DAAC) and as a dynamic community database that can be updated by users into the future. The dynamic database is hosted on GitHub at https://github.com/bpbond/srdb. Citations to the dynamic database should always include a version number and download date.
The information provided in the related publication will not be identical to the information provided here owing to revisions made while compiling new versions of the dataset.
Data Characteristics
Spatial Coverage: Global
Spatial Resolution: Point-based measurements with global extent (see Fig. 1). Coordinates are provided for each sample location.
Temporal Coverage: Compilation of published measurements taken between 1961/01/01 and 2016/06/30. The study date of each record is provided in the dataset.
Temporal Resolution: Annual and seasonal measurements for each study are provided.
Site Boundaries: (All latitude and longitude given in decimal degrees)
| Site (Region) | Westernmost Longitude | Easternmost Longitude | Northernmost Latitude | Southernmost Latitude | Geodetic Datum |
|---|---|---|---|---|---|
| Global (point) | -162.2 | 175.77 | 78.9 | -78.20 | Unknown |
Data File Information
srdb-data-V4.csv is a comma-separated file of all the soil respiration and contextual data. Bibliographic information for the studies that appear in srdb-data-V4.csv can be found in srdb-studies-V4.csv. The “Study_number” field is common to both files.
Missing values are represented as -9999 for numeric data or NA for text data.
Table 1. Column names and descriptions for srdb-data-V4.csv.
| Column Number | Column Name | Column Description and Units |
|---|---|---|
| Metadata | ||
| 1 | Record_number | Record number |
| 2 | Entry_date | Entry date (yyyy-mm-dd) |
| 3 | Study_number | Study number; index into the studies database |
| 4 | Author | Name of first author |
| 5 | Duplicate_record | Is record a known duplicate? (Study number) |
| 6 | Quality_flag | Quality control flags: Q0 default/none Q01 estimated from figure Q02 data from another study Q03 data estimated--other Q04 potentially useful future data Q10 potential problem with data Q11 suspected problem with data Q12 known problem with data Q13 duplicate? Q14 inconsistency Further details can generally be found in the notes field (column 105) |
| 7 | Contributor | Data contributor |
| Site and Measurement Data | ||
| 8 | Country | Country |
| 9 | Region | State/province/region |
| 10 | Site_name | Name of study site |
| 11 | Study_midyear | Year study was performed (middle year if multiple years) |
| 12 | Years_of_data | Years of data; always ≥1 |
| 13 | Latitude | Latitude, decimal; positive=north, negative=south |
| 14 | Longitude | Longitude, decimal; positive=east, negative=west |
| 15 | Elevation | Elevation, m |
| 16 | Manipulation | Manipulation performed (CO2, fertilization, etc.) |
| 17 | Manipulation_level | Degree of manipulation performed |
| 18 | Age_ecosystem | Time since ecosystem established, years. This is used when, e.g., the time of conversion of forest to agriculture is known |
| 19 | Age_disturbance | Time since disturbance, years |
| 20 | Species | Dominant species |
| 21 | Biome | Biome (boreal, temperate, etc). Subjective |
| 22 | Ecosystem_type | Ecosystem type (grassland, forest, etc). Subjective |
| 23 | Ecosystem_state | Ecosystem state (managed, unmanaged, natural). Subjective. Unmanaged means human management or disturbance in the past, but not currently. |
| 24 | Leaf_habit | Dominant leaf habit (deciduous, evergreen) |
| 25 | Stage | Developmental stage (aggrading, mature). Subjective |
| 26 | Soil_type | Soil description (classification and texture) |
| 27 | Soil_drainage | Soil drainage (dry, wet). Subjective. Dry means well-drained uplands; wet peatlands, swamps, etc. |
| 28 | Soil_BD | Soil bulk density, g cm-3 |
| 29 | Soil_CN | Soil C:N ratio |
| 30 | Soil_sand | Soil percent sand |
| 31 | Soil_silt | Soil percent silt |
| 32 | Soil_clay | Soil percent clay |
| 33 | MAT | Reported mean annual temperature, C |
| 34 | MAP | Reported mean annual precipitation, mm |
| 35 | PET | Reported potential evapotranspiration, mm |
| 36 | Study_temp | Annual temperature in year of study, C |
| 37 | Study_precip | Annual precipitation in year study of study, mm |
| 38 | Meas_method | CO2 measurement method |
| 39 | Meas_interval | Mean interval between soil respiration measurements, days |
| 40 | Annual_coverage | Annual coverage of soil respiration measurements, fraction (1.0= full year) |
| 41 | Partition_method | Method used to partition soil respiration source fluxes, following Bond-Lamberty et al. (2004) |
| Annual and Seasonal Rs Fluxes | ||
| 42 | Rs_annual | Annual C flux from soil respiration, g C m-2. This can either be reported directly by the study, calculated from reported mean fluxes, or estimated from a figure (in which case a quality control note is made, field 6) |
| 43 | Rs_annual_err | Error (typically plot-to-plot) for soil respiration annual, g C m-2 |
| 44 | Rs_interann_err | Interannual error reported for soil respiration annual, g C m-2. This is occasionally reported by authors, or defined as the standard deviation between year ‘i’ and year ‘i+1’ (N=2) |
| 45 | Rs_max | Maximum soil respiration flux, µmol m-2 s-1 |
| 46 | Rs_maxday | Maximum soil respiration flux day of year |
| 47 | Rs_min | Minimum soil respiration flux, µmol m-2 s-1 |
| 48 | Rs_minday | Minimum soil respiration flux day of year |
| 49 | Rlitter_annual | Annual soil respiration flux from litter, g C m-2 fraction |
| 50 | Ra_annual | Annual autotrophic soil respiration flux, g C m-2 |
| 51 | Rh_annual | Annual heterotrophic soil respiration flux, g C m-2 |
| 52 | RC_annual | Root contribution to soil respiration annual fraction |
| 53 | Rs_spring | Mean spring soil respiration flux, µmol m-2 s-1. Seasons are defined by authors |
| 54 | Rs_summer | Mean summer soil respiration flux, µmol m-2 s-1 |
| 55 | Rs_autumn | Mean autumn soil respiration flux, µmol m-2 s-1 |
| 56 | Rs_winter | Mean winter soil respiration flux, µmol m-2 s-1 |
| 57 | Rs_growing | Mean growing soil respiration flux, µmol m-2 s-1 |
| 58 | Rs_wet | Mean wet season soil respiration flux, µmol m-2 s-1 |
| 59 | Rs_dry | Mean dry season soil respiration flux, µmol m-2 s-1 |
| 60 | RC_seasonal | Root contribution to seasonal soil respiration, fraction |
| 61 | RC_season | Season of root contribution |
| Response of Rs to Temperature and Moisture | ||
| 62 | Model_type | Type of temperature-response model used |
| 63 | Temp_effect | Temperature effect on soil respiration (none, positive, negative) |
| 64 | Model_output_units | Temperature-response model output units |
| 65 | Model_temp_min | Lower bound of soil temperature range over which model fitted |
| 66 | Model_temp_max | Upper bound of soil temperature range over which model fitted |
| 67 | Model_N | Model N |
| 68 | Model_R2 | Model r-squared |
| 69 | T_depth | Depth at which soil temperature recorded, cm. A value of -200 (i.e., 2 m above ground) is used for air temperature |
| 70 | Model_paramA | Model parameter A |
| 71 | Model_paramB | Model parameter B |
| 72 | Model_paramC | Model parameter C |
| 73 | Model_paramD | Model parameter D |
| 74 | Model_paramE | Model parameter E |
| 75 | WC_effect | Soil water effect on Rs |
| 76 | R10 | Soil respiration at 10 C, µmol m-2 s-1 |
| 77 | Q10_0_10 | Q10 temperature response, for 0–10, 5–15, 10–20, 0–20 °C, as well as custom ranges. Q10 values are either reported by authors, calculated from reported Rs-temperature regressions, or occasionally estimated from figures (in which case a quality control note is made, field 6) |
| 78 | Q10_5_15 | Q10 temperature response, 5-15 C |
| 79 | Q10_10_20 | Q10 temperature response, 10-20 C |
| 80 | Q10_0_20 | Q10 temperature response, 0-20 C |
| 81 | Q10_other1 | Q10 temperature response, other temp range |
| 82 | Q10_other1_min | Lower bound of temperature range of Q10_other1, C |
| 83 | Q10_other1_max | Upper bound of temperature range of Q10_other1, C |
| 84 | Q10_other2 | Q10 temperature response, other temp range |
| 85 | Q10_other2_min | Lower bound of temperature range of Q10_other2, C |
| 86 | Q10_other2_max | Upper bound of temperature range of Q10_other2, C |
| Ancillary Pools and Fluxes | ||
| 87 | GPP | Annual gross primary production at site, g C m-2 |
| 88 | ER | Annual ecosystem respiration at site, g C m-2 |
| 89 | NEP | Annual net ecosystem production at site, g C m-2 |
| 90 | NPP | Annual net primary production at site, g C m-2 |
| 100 | ANPP | Annual aboveground NPP at site, g C m-2 |
| 101 | BNPP | Annual belowground NPP at site, g C m-2 |
| 102 | NPP_FR | Annual fine root NPP at site, g C m-2 |
| 103 | TBCA | Total belowground carbon allocation at site, g C m-2 |
| 104 | Litter_flux | Annual aboveground litter flux, g C m-2. This is reported very inconsistently (leaf only, leaf and fine woody material, all material, etc). Generally this should not include large woody material |
| 105 | Rootlitter_flux | Annual belowground litter flux, g C m-2 |
| 106 | TotDet_flux | Annual total litter flux, g C m-2. This should be the sum of Litter flux and Rootlitter flux |
| 107 | Ndep | Annual nitrogen deposition, g N m-2 |
| 108 | LAI | Leaf area index at site, m2 m-2. Hemispheric (one-sided) if possible |
| 109 | BA | Basal area at site, m2 ha-1 |
| 110 | C_veg_total | Total carbon in vegetation, g C m-2. This should be the sum of C_AG and C_BG. For this and all "C_" fields, biomass is converted to carbon using a ratio of 0.5 unless study-specific values are available |
| 111 | C_AG | Total carbon in aboveground vegetation, g C m-2 |
| 112 | C_BG | Total carbon in belowground vegetation, g C m-2 |
| 113 | C_CR | Total carbon in coarse roots, g C m-2 |
| 114 | C_FR | Total carbon in fine roots, g C m-2 |
| 115 | C_litter | Total carbon in standing litter, g C m-2 |
| 116 | C_soilmineral | Total carbon in soil organic matter, g C m-2 |
| 117 | C_soildepth | Depth to which soil C recorded, cm |
| 118 | Notes | Notes |
Table 2. Column names and descriptions for srdb-studies-V4.csv.
| Column Number | Column Name | Column Description |
|---|---|---|
| 1 | study_number | Study number; used as a lookup from srdb-data. |
| 2 | authors | Study authors. |
| 3 | title | Study title. |
| 4 | abstract | Abstract. |
| 5 | bp | Beginning page. |
| 6 | citations | Citations. |
| 7 | copy | SRDB Team Member. |
| 8 | de | Data entry: entered into srdb-data (Y/N)? |
| 9 | dld | Downloaded: study acquired (Y/N)? |
| 10 | doi | Digital object identifier. |
| 11 | ep | Ending page. |
| 12 | issue | Issue number. |
| 13 | nonenglish | Is study in a non-English language (Y/N)? |
| 14 | notes | Notes. |
| 15 | pubyear | Publication year. |
| 16 | rank | Rank (1=highly relevant, 4=not relevant). Note this score is not an assessment of the study's scientific merit or validity; it's simply a judgment, based on reading the abstract and title, of how relevant this study is to the database (i.e., is it likely to have appropriate data?) |
| 17 | requested | Study requested. |
| 18 | searchdate | Date search performed (yyyy-mm-dd). |
| 19 | searchterm | Web of Science search term used. |
| 20 | sn | The ISSN, which is the international standardized code for publication. |
| 21 | source | Study source (usually journal name). |
| 22 | tf | Additional publication identifiers to accompany those in column ut. |
| 23 | ut | Additional publication identifiers. |
| 24 | volume | Volume number. |
Companion File Information
- The R script SRDBv4.R containing functions for error-checking, mapping of study locations, summary statistics, and summary graphics are included. Note that this script requires the installation of the following R packages: ggplot2, ggExtra, maps, and mapdata. The script must be run from the same directory that contains the data files: srdb-data-V4.csv and srdb-studies-V4.csv, as well as the companion file srdb-data_fields-V4.txt. Error-checking functions include helper functions to check the valid range and data type of each field. Summary statistics include the breakdown of data by the following fields: Biome, Ecosystem, Rs_annual, R_10, and Q_10. Scripts to create maps are provided for the world map (Fig. 1 above) and regional maps. Summary graphics include Rs summary distributions by Biome and Ecosystem, as well as a plot of Rs_annual vs Rh_annual.
- The file srdb-data_fields-V4.txt contains a list of the fields in srdb-data-V4.csv.
- When it was necessary to calculate or estimate annual flux for one of the studies, these calculations and notes were recorded in an Excel spreadsheet. These spreadsheets are provided as a companion file and have been compiled and compressed into calculations_worksheets_v4.zip.
Application and Derivation
This is a database compiled from published studies about soil surface CO2 flux (soil respiration) measured in the field and intended to serve as a resource for scientific analysis.
The primary soil respiration units used were gC/m2/yr for annual fluxes and umol/m2/s for mean seasonal fluxes. When necessary, the units were converted from those provided in the study. A variety of ancillary data were also entered when provided, including site-related and experimental data, information on ecosystem structure and function, methods used, etc. A ratio of 12:44 was assumed for C to CO2 molecular weights and biomass was assumed to be 50% C unless specified otherwise in the study.
Quality Assessment
Data were crosschecked against a number of other soil respiration data collections and meta-analyses (Hibbard et al., 2005; Chen and Tian, 2005; Burton et al., 2008; Sotta et al., 2004). Quality flags were assigned based on information provided in a given study and best judgment.
Data Acquisition, Materials, and Methods
For the compilation of Version 1.0, investigators collected all available studies in the peer-reviewed scientific literature reporting soil respiration measured in the field; lab incubation studies were not included. Web of Science was used to search for publications through the year 2008, and the search terms included "soil respiration," "soil CO2 evolution," etc. Each study's title and abstract were used to decide whether to acquire it. Approximately 40% of the almost 4700 studies were acquired and examined.
In Version 2.0, publications from 2009, 2010, and from the first half of 2011 were included and Rs data from 164 studies were added. The Google Earth (*.kmz) file of site locations was updated. Values for the "Age_disturbance" field were corrected and completed. The "Partition_method" field was fixed for many records. Finally, three fields "Chamber_method," "CH4_flux," "N2O_flux" were deleted because the fields were inconsistent or almost never used.
In Version 3.0, publications from 2012 and Rs data from a total of 466 new studies were added. Many corrections were made to older data and a new R script for error-checking and mapping was created. The Google Earth (*.kmz) file was removed and the field "CO2_method" was renamed to "Meas_method." Additionally, two new fields titled "Meas_interval" and "Annual_coverage" were added.
In Version 4.0, publications through 2017 were reviewed and more than 1400 observations were added. Many corrections were made to older data.
Short term experiments (i.e., soil respiration measurements made over less than 1-2 weeks) were not entered unless the study authors extrapolated their results to seasonal or annual values; the database is generally not designed to accommodate instantaneous or short-term measurements. In general, no additional research was performed to find older publications that were not listed in the Web of Science. To qualify for inclusion, a study had to report at least one of the following data:
- Annual soil respiration
- Mean seasonal soil respiration
- Annual or seasonal partitioning of soil respiration sources
- Q10 and associated temperature range
- R10 (soil respiration at 10 degrees C)
If at least one of these data was reported or could be calculated with few or no assumptions (e.g., easily estimated from points in a figure), the study was entered into the database. For example, sometimes a study will show monthly soil respiration in a figure but not compute an annual flux, and so estimates were made from the figure. This was noted in a quality flag.
When it was necessary to calculate or estimate annual flux for one of the studies, these calculations and notes were recorded in an Excel spreadsheet (*.xlsx). File names start with the assigned four-digit “Study_number” that indexes the srdb-studies and srdb-data files (e.g., "0020 WitkampEcology 1966.xlsx" and "4634 Webster JGR 2008.xlsx"). These spreadsheets are provided in the file calculations_worksheets_v4.zip.
Data Access
These data are available through the Oak Ridge National Laboratory (ORNL) Distributed Active Archive Center (DAAC).
A Global Database of Soil Respiration Data, Version 4.0
Contact for Data Center Access Information:
- E-mail: uso@daac.ornl.gov
- Telephone: +1 (865) 241-3952
References
Bond-Lamberty, B., and A.M. Thomson. 2010. A global database of soil respiration measurements. Biogeosciences. 7:1321-1344. https://doi.org/10.5194/bgd-7-1321-2010
Burton, A.J., J.M. Melillo, and S.D. Frey. 2008. Adjustment of forest ecosystem root respiration as temperature warms. Journal of Integrative Plant Biology, 50:1467-1483. https://doi.org/10.1111/j.1744-7909.2008.00750.x
Chen, H., and H.Q. Tian. 2005. Does a general temperature-dependent Q(10) model of soil respiration exist at biome and global scale? Journal of Integrative Plant Biology, 47:1288-1302. https://doi.org/10.1111/j.1744-7909.2005.00211.x
Hibbard, K.A., B.E. Law, and J. Sulzman. 2005. An analysis of soil respiration across northern hemisphere temperate ecosystems. Biogeochemistry, 73:29-70. https://doi.org/10.1007/s10533-004-2946-0
Sotta, E.D., P. Meir, Y. Malhi, A.D. Nobre, M. Hodnett, and J. Grace. 2004. Soil CO2 efflux in a tropical forest in the central Amazon. Global Change Biology, 10:601-617. https://doi.org/10.1111/j.1529-8817.2003.00761.x
Dataset Revisions
| SRDB Version | ORNL DAAC Release Date | Number of Records | Study Date Range |
|---|---|---|---|
| Version 4.0 | 2018/11/21 | 6631 | 1961-2016 |
| Version 3.0 | 2014/07/24 | 5173 | 1961-2012 |
| Version 2.0 | 2012/03/01 | 4387 | 1961-2009 |
| Version 1.0 | 2010/04/30 | 3379 | 1961-2007 |
Version 4.0 Data from 1750 studies have been entered into the database, constituting 6631 records. The data span the years 1961-2016 and are dominated by temperate, well-drained forests. The source for Version 4.0 is the GitHub site https://github.com/bpbond/srdb accessed on November 21, 2018.
Version 4.1 The file srdb-studies-V4.csv was updated with the file from the GitHub site https://github.com/bpbond/srdb accessed on December 17, 2018.