Documentation Revision Date: 2020-04-22
Dataset Version: 1
Summary
There is one data file of global hydrologic soil groups (HSGs) at 250-m resolution in GeoTIFF format provided with this dataset. The R script used to generate the dataset is included as a companion file.
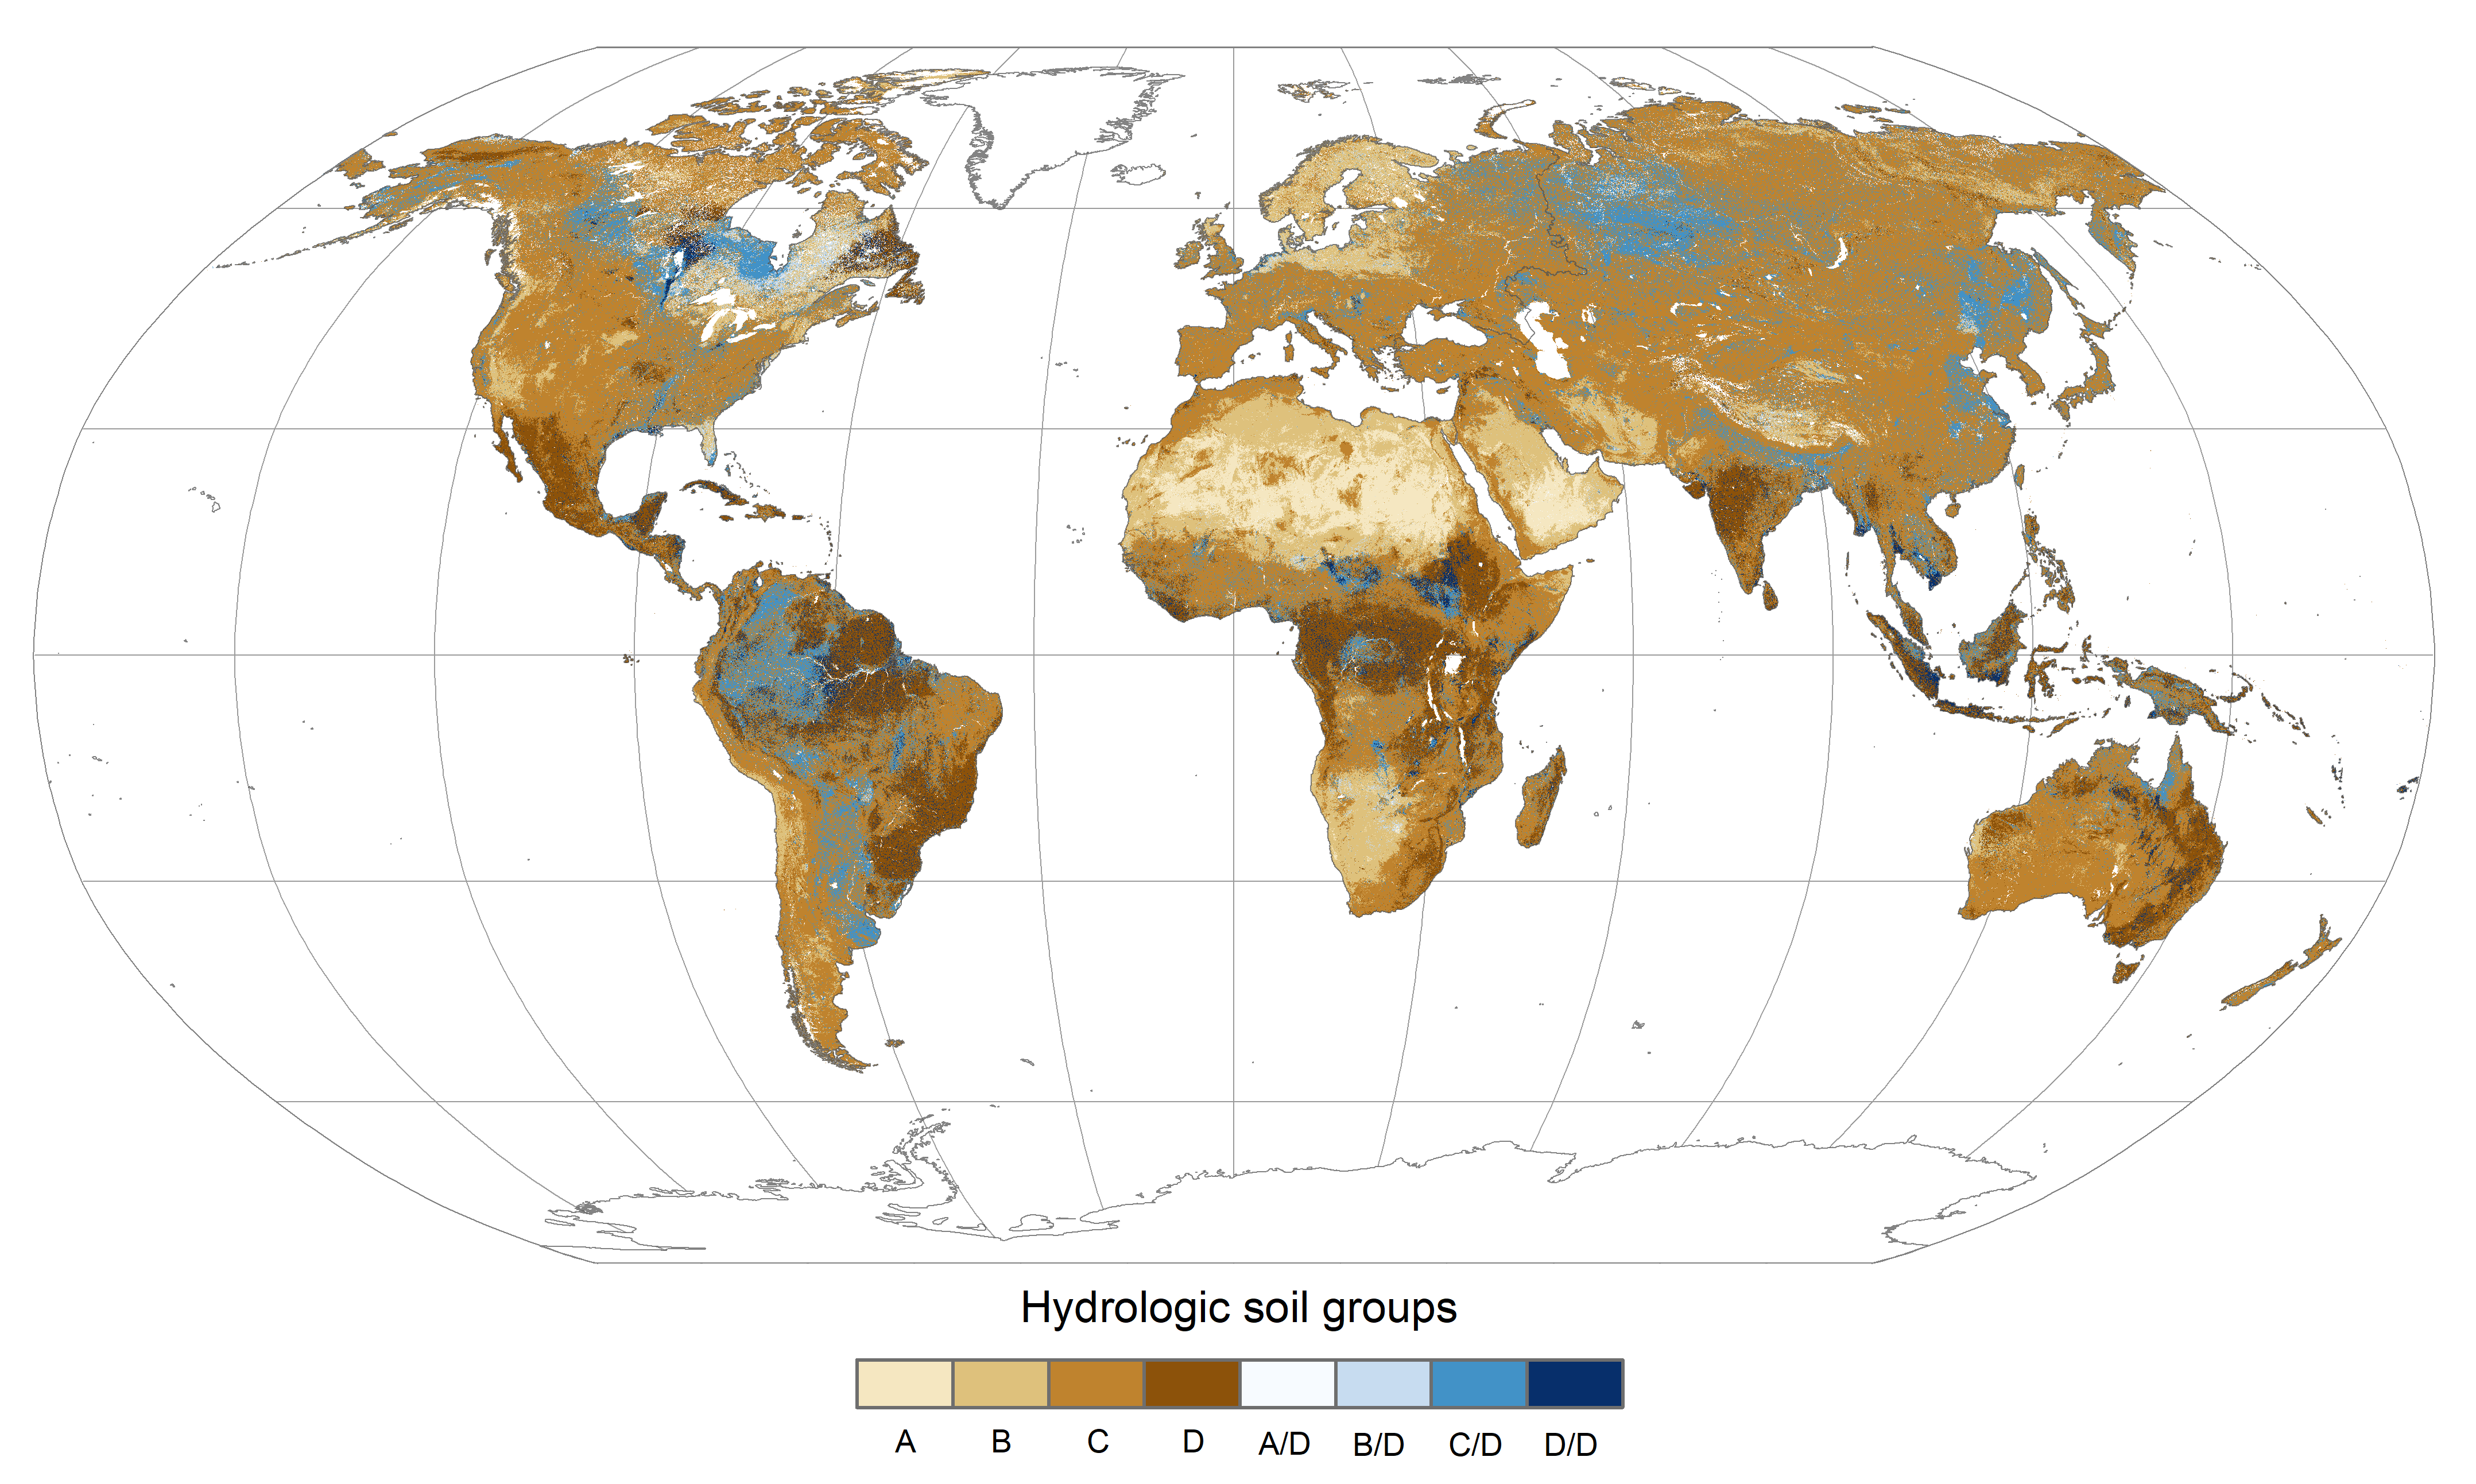
Figure 1. Global distribution of hydrologic soil groups at 250-m spatial resolution. Hydrologic soil groups A, B, C, and D correspond to low, moderately low, moderately high, and high runoff potential, respectively. Wet soils are assigned a dual HSG (e.g., HSG A/D) and have high runoff potential due to the presence of a water table within 60 cm of the surface. A less restrictive group can be assigned if these soils are drained (e.g., HSG-A).
Citation
Ross, C.W., L. Prihodko, J.Y. Anchang, S.S. Kumar, W. Ji, and N.P. Hanan. 2018. Global Hydrologic Soil Groups (HYSOGs250m) for Curve Number-Based Runoff Modeling. ORNL DAAC, Oak Ridge, Tennessee, USA. https://doi.org/10.3334/ORNLDAAC/1566
Table of Contents
- Dataset Overview
- Data Characteristics
- Application and Derivation
- Quality Assessment
- Data Acquisition, Materials, and Methods
- Data Access
- References
Dataset Overview
Hydrologic soil groups (HSGs) are a fundamental component of the USDA curve number (CN) method for estimation of rainfall runoff; yet these data are not readily available in a format or spatial resolution suitable for regional to global scale modeling applications. We developed a globally consistent gridded dataset defining HSGs to fill this gap. The resulting data product—HYSOGs250m—represents rainfall runoff potential at 250-m spatial resolution. The four standard classes—A, B, C, and D—correspond to soils with low, moderately low, moderately high, and high runoff potential, respectively. Wet soils have high runoff potential (regardless of texture) due to the presence of a groundwater table within 60 cm of the surface. These soils receive are assigned dual HSGs, as a less restrictive class group can be assigned (according to texture or KS) if they can be adequately drained.
Related Publication:
Ross, C.W., L. Prihodko, J. Anchang, S. Kumar, W. Ji, and N.P. Hanan. 2018. HYSOGs250m, global gridded hydrologic soil groups for curve-number-based runoff modeling. Scientific Data 5, 180091. https://doi.org/10.1038/sdata.2018.91
Acknowledgements:
This research was supported in part by the US National Aeronautic and Space Administration as part of the NASA Carbon Cycle Science program (Grant # NNX17AI49G).
Data Characteristics
Spatial Coverage: Global
Spatial Resolution: 1/480 decimal degrees (~250 m)
Temporal Coverage: These data are modeled to represent contemporary soil runoff potential. For completeness, the data were given a date range of 1900 to 2015.
Temporal Resolution: One-time estimates
Study Area: (All latitude and longitude given in decimal degrees.)
| Site (Region) | Westernmost Longitude | Easternmost Longitude | Northernmost Latitude | Southernmost Latitude |
|---|---|---|---|---|
| Global | -180 | 179.999 | 83.999 | -56 |
Data File Information:
There is one data file of global HSGs at 250 m resolution in GeoTIFF format provided with this dataset.
Spatial Data Properties: Raster file – HYSOGs250m.tif
Spatial Representation Type: Raster
Pixel Depth: 8 bit
Pixel Type: byte
Number of Bands: 1
Band Information: Global Hydrological Soil Groups
Raster Format: GeoTIFF
No Data Value: 255
Scale Factor: none
Offset: none
Number Columns: 172,800
Column Resolution: 0.002083333 degree
Number Rows: 67,200
Row Resolution: 0.002083333 degree
Extent in the items coordinate system
North: 83.9997222222222
South: -56
West: -180
East: 179.999722222222
xll corner: -180
yll corner: -56
Cell Geometry: area
Point in Pixel: center
| Pixel values | Description |
|---|---|
| 1 | HSG-A: low runoff potential (>90% sand and <10% clay) |
| 2 | HSG-B: moderately low runoff potential (50-90% sand and 10-20% clay) |
| 3 | HSG-C: moderately high runoff potential (<50% sand and 20-40% clay) |
| 4 | HSG-D: high runoff potential (<50% sand and >40% clay) |
| 11 | HSG-A/D: high runoff potential unless drained (>90% sand and <10% clay) |
| 12 | HSG-B/D: high runoff potential unless drained (50-90% sand and 10-20% clay) |
| 13 | HSG-C/D: high runoff potential unless drained (<50% sand and 20-40% clay) |
| 14 | HSG-D/D: high runoff potential unless drained (<50% sand and >40% clay) |
Companion File:
The HSG classification was performed in R. The script (HYSOGs250m_SciDat.R) is included as a companion file.
Application and Derivation
These data were developed to support CN-based runoff modeling for ecological and hydrological models at regional to global scales. Other potential applications include flood risk assessment, and as a covariate for biogeographical analysis of vegetation distributions and dynamics.
Quality Assessment
HYSOGs250m was derived from USDA-based soil texture classes, depth to bedrock, and depth to groundwater table. Soil texture and bedrock depth predictions were obtained from the FAO soilGrids250m system. (Hengl et al., 2017). Groundwater table depth was obtained from Fan et al (2013). A brief description of the technical validation of the texture classes and depth to bedrock predictions are discussed in Ross et al. (2018). However, end-users are referred to the respective publications for a detailed description of modeling and uncertainty assessments of the soilGrids and groundwater table data.
Data Acquisition, Materials, and Methods
Overview
HSGs were derived from texture classes as reported in Table 1 and described in the U.S. Department of Agriculture-Natural Resources Conservation Service (USDA-NRCS) National Engineering Handbook (USDA, 2009). The resulting data product—HYSOGs250m—represents general soil runoff potential suitable for regional, continental, and global scale analyses and is available in a gridded format at a spatial resolution of 250 m (Fig. 1).
- HSG-A has the lowest runoff potential (typically contains more than 90% sand and less than 10% clay),
- HSG-B has moderately low runoff potential (typically contains between 10 to 20% clay and 50 to 90% sand),
- HSG-C has moderately high runoff potential (typically contains between 20 to 40% clay and less than 50% sand), and
- HSG-D has the highest runoff potential (typically contains more than 40% clay and less than 50% sand).
Methods
We classified HSGs from USDA-based soil texture classes, depth to bedrock, and depth to water table as specified in the NEH (NRCS, 2009). Soil texture to 1 m depth was represented with FAO soilGrids250m texture classes at six depths: 0, 5, 15, 30, 60, and 100 cm. The soilGrids were stacked into a multi band raster (textStack) using the raster::stack function. For the purpose of this analysis, we refer to individual grid cells (~ 250-m x 250-m) in the raster stack (1 m depth) as soil pedons. Each grid cell in the raster stack (or pedon) was re-classified into one of four HSGs (hsgStack) according to USDA specifications. This allowed us to infer the water transmissivity of each layer in the profile from the stacked texture classes. Note that integers 1, 2, 3, and 4 were used to represent HSGs A, B, C, and D, respectively. The raster::max function was then used to determine the largest value of each grid cell in the raster stack, allowing us to infer the most restrictive layer in the pedon. This value (maxHSG) was used to assign HSGs for each pixel in the stack, thus representing soil runoff potential for each pedon. Shallow soils (bedrock within 50 cm of the surface) were re-classified to HSG-D (maxHSGR). Dual HSGs were assigned to pedons with shallow water tables ( < 60 cm from the surface) using the depth to groundwater table dataset. Integers 11, 12, 13, and 14 were used to denote dual HSGs A/D, B/D, C/D, and D/D in the dataset.
All computations were performed with the R open source environment for statistical computing and functions from the raster package.
Input Data Availability
Instructions on how to access the Food and Agriculture Organization (FAO) soilGrids250m meta-data, texture classes, and depth to bedrock are described in Hengl et al. (2017). Access to the groundwater table depth16 and associated meta-data are available from Deltares (https://www.deltares.nl/en/projects/glowasis-providing-access-water-scarcity-data/)
Table 1. Classification scheme used to develop hydrologic soil groups (HSGs).
|
HSG |
Soil texture class1 |
Runoff potential |
soilGrids250m texture class value |
|
A |
Sand |
Low |
12 |
|
B |
Sandy loam, Loamy sand |
Moderately low |
9, 11 |
|
C |
Clay loam, Silty clay loam, Sandy clay loam, Loam, Silty loam, Silt |
Moderately high |
4, 5, 6, 7, 8, 10 |
|
D |
Clay, Silty clay, Sandy clay |
High |
1, 2, 3 |
|
A/D |
Sand |
High |
12 |
|
B/D |
Sandy loam, Loamy sand |
High |
9, 11 |
|
C/D |
Clay loam, Silty clay loam, Sandy clay loam, Loam, Silty loam, Silt |
High |
4, 5, 6, 7, 8, 10 |
|
D/D |
Clay, Silty clay, Sandy clay |
High |
1, 2, 3 |
1Soil texture classes that typically comprise hydrologic soil groups (HSGs) (USDA, 2009).
Data Access
These data are available through the Oak Ridge National Laboratory (ORNL) Distributed Active Archive Center (DAAC).
Global Hydrologic Soil Groups (HYSOGs250m) for Curve Number-Based Runoff Modeling
Contact for Data Center Access Information:
- E-mail: uso@daac.ornl.gov
- Telephone: +1 (865) 241-3952
References
Fan, Ying, H Li, and Gonzalo Miguez-Macho. “Global Patterns of Groundwater Table Depth.” Science (New York, N.Y.) 339 (February 22, 2013): 940–43. https://doi.org/10.1126/science.1229881.
Hengl, T. et al. SoilGrids250m: Global gridded soil information based on machine learning. PLOS ONE 12, e0169748 (2017). https://doi.org/10.1371/journal.pone.0169748
Hijmans, R. J. et al. raster: Geographic Data Analysis and Modeling. (2016).
USDA. “Hydrologic Soil Groups.” In National Engineering Handbook: Part 630 - Hydrology, 2009. https://www.nrcs.usda.gov/wps/portal/nrcs/detailfull/national/water/manage/hydrology/?cid=stelprdb1043063.
Ross, C.W., L. Prihodko, J. Anchang, S. Kumar, W. Ji, and N.P. Hanan. 2018. HYSOGs250m, global gridded hydrologic soil groups for curve-number-based runoff modeling. Scientific Data 5, 180091. https://doi.org/10.1038/sdata.2018.91