Documentation Revision Date: 2025-03-10
Dataset Version: 1
Summary
This dataset contains 4 files; one file in comma-separated values (.csv) format with the leaf trait data, two zip folders with jpeg leaf images used for area calculations, and one file (.py) with the processing code used to calculate the leaf area.
This is version 2 of this dataset. Additional data have been added to the CSV file.
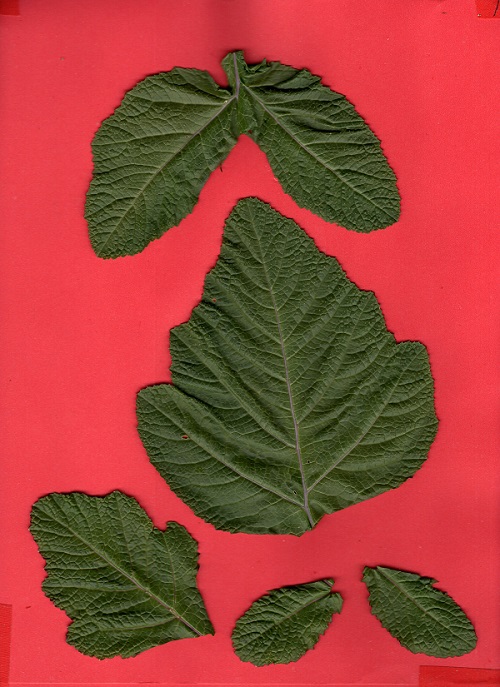
Figure 1. Scanned image of black mustard (Brassica nigra) leaves used for a measurement of leaf area. Source: 001_LMA.jpeg.
Citation
Chadwick, K.D., N. Queally, T. Zheng, J. Cryer, C. Vanden Heuvel, C. Villanueva-Weeks, C. Ade, L. Anderegg, Y. Angel, B. Baker, I. Boving, R.K. Braghiere, P. Brodrick, P. Campbell, K.C. Cushman, F.W. Davis, P.D. Dao, A. Dibartolo, R. Eckert, K. Grant, B. Heberlein, M. Johnson, J. Joutras, C. Kibler, M. Klope, K. Kovach, A. Kreisberg, P. Lovegreen, A.J. Maguire, C.A. Mcmahon, K. Miner, C. Nickles, F. Ochoa, J.P. Ocón, A. Ongjoco, E.M. Ordway, M. Park, R. Pavlick, A.M. Raiho, D.A. Roberts, D.S. Schimel, F.D. Schneider, K. Thompson, P.A. Townsend, E. Vermeer, N. Vinod, and K. Zumdahl. 2023. SHIFT: Photosynthetic and Leaf Traits, Santa Barbara County, 2022. ORNL DAAC, Oak Ridge, Tennessee, USA. https://doi.org/10.3334/ORNLDAAC/2233
Table of Contents
- Dataset Overview
- Data Characteristics
- Application and Derivation
- Quality Assessment
- Data Acquisition, Materials, and Methods
- Data Access
- References
- Dataset Revisions
Dataset Overview
This dataset provides leaf images and measurements of leaf traits (area, wet weight, dry weight, leaf mass per area, leaf water content) and leaf pigments (chlorophyll) and species information as sampled from meadow, shrub, and tree from Santa Barbara California, USA. Samples were collected from plots within the Dangermond Preserve, Sedgwick Reserve, and Carpinteria Salt March Reserve during the period of February 23, 2022 to September 27, 2022 for the 2022 NASA Surface Biology Geology (SBG) High Frequency Time series (SHIFT) campaign. The associated data package contains image scans used for the leaf area calculations as well as python processing code used to calculate the area. A comma-separated value (CSV) formatted file includes plot-level leaf area (cm2), wet weight (g), leaf mass area (LMA, g leaf dry mass per meter square), leaf water content (LWC, (wet weight - dry weight/wet weight, %)), chlorophyll fluorescence ratio (CFR), and chlorophyll content (CHL).
Project
The Surface Biology and Geology (SBG) High Frequency Time Series (SHIFT) was an airborne and field campaign during February to May, 2022, with a follow up activity for one week in September, in support of NASA's SBG mission. Its study area included a 640-square-mile (1,656-square-kilometer) area in Santa Barbara County and the coastal Pacific waters. The primary goal of the SHIFT campaign was to collect a repeated dense time series of airborne Visible to ShortWave Infrared (VSWIR) airborne imaging spectroscopy data with coincident field measurements in both inland terrestrial and coastal aquatic areas, supported in part by a broad team of research collaborators at academic institutions. The SHIFT campaign leveraged NASA's Airborne Visible-Infrared Imaging Spectrometer-Next Generation (AVIRIS-NG) facility instrument to collect approximately weekly VSWIR imagery across the study area. The SHIFT campaign 1) enables the NASA SBG team to conduct traceability analyses related to the science value of VSWIR revisit without relying on multispectral proxies, 2) enables testing algorithms for consistent performance over seasonal time scales and end-to-end workflows including community distribution, and 3) provides early adoption test cases to SHIFT application users and incubate relationships with basic and applied science partners at the University of California Santa Barbara Sedgwick Reserve and The Nature Conservancy's Jack and Laura Dangermond Preserve.
Related datasets:
Queally, N., F.W. Davis, K.D. Chadwick, C. Ade, L. Anderegg, Y. Angel, B. Baker, I. Boving, R.K. Braghiere, P. Brodrick, P. Campbell, J. Cryer, K.C. Cushman, P.D. Dao, A. Dibartolo, R. Eckert, K. Grant, B. Heberlein, M. Johnson, J. Joutras, K. Kerr, C. Kibler, M. Klope, K. Kovach, A. Kreisberg, P. Lovegreen, A.J. Maguire, C.A. Mcmahon, K. Miner, C. Nickles, F. Ochoa, J.P. Ocón, A. Ongjoco, E.M. Ordway, M. Park, R. Pavlick, A.M. Raiho, D.A. Roberts, C.M. Saiki, F.D. Schneider, K. Thompson, P.A. Townsend, E. Vermeer, C. Villanueva-Weeks, N. Vinod, T. Zheng, K. Zumdahl, and D.S. Schimel. 2025. SHIFT: Vegetation Plot Characterization, Santa Barbara County, CA, Version 2, 2022. ORNL DAAC, Oak Ridge, Tennessee, USA. https://doi.org/10.3334/ORNLDAAC/2386
- Provides SHIFT plot locations, descriptions, species, fractional cover, phenophase, and sample identifier data. Plot identifiers are consistent across datasets.
Queally, N., F.W. Davis, K.D. Chadwick, C. Ade, L. Anderegg, Y. Angel, B. Baker, L. Baskaran, I. Boving, R.K. Braghiere, P. Brodrick, P. Campbell, J. Cryer, K.C. Cushman, P.D. Dao, A. Dibartolo, R. Eckert, K. Grant, B. Heberlein, M. Johnson, J. Joutras, K. Kerr, C. Kibler, M. Klope, K. Kovach, A. Kreisberg, P. Lovegreen, A.J. Maguire, C. Mcmahon, K. Miner, C. Nickles, F. Ochoa, J.P. Ocón, A. Ongjoco, E. Ordway, M. Park, R. Pavlick, A.M. Raiho, D.A. Roberts, C.M. Saiki, F.D. Schneider, K. Thompson, P. Townsend, E. Vermeer, C. Villanueva-Weeks, N. Vinod, T. Zheng, K. Zumdahl, and D.S. Schimel. 2024. SHIFT: Vegetation Plot Photos, Santa Barbara, CA, USA, 2022. ORNL DAAC, Oak Ridge, Tennessee, USA. https://doi.org/10.3334/ORNLDAAC/2334
- Provides photographs of the plots where field vegetation sampling was conducted during the 2022 NASA Surface Biology Geology (SBG) High Frequency Time series (SHIFT) campaign
Zheng, T., N. Queally, K.D. Chadwick, J. Cryer, P. Reim, P. Townsend, E. Marsh, M. Berg, Z. Breuer, N. Burkard, A. Hanson, E. Johnson, D. Lacey, A. Lee, L. Pfau, I. Shifrin, B. Skalitzky, S. Stroschein, J. Van beek, C. Vanden heuvel, and A. Williams. 2023. SHIFT: Reflectance Measurements for Dried and Ground Leaf Materials. ORNL DAAC, Oak Ridge, Tennessee, USA. https://doi.org/10.3334/ORNLDAAC/2244
- Provides spectra of dried and ground leaf material
Related Publication:
Chadwick, K.D., et al. 2024. Unlocking ecological insights from subseasonal visible-to-shortwave infrared imaging spectroscopy: The SHIFT Campaign. Ecosphere. (under review)
Acknowledgement:
SHIFT is jointly led by NASA’s Jet Propulsion Laboratory, The Nature Conservancy, and the University of California, Santa Barbara (UCSB).
Data Characteristics
Spatial Coverage: Samples were collected from plots at Dangermond Preserve, Sedgwick Reserve, and Carpinteria Salt Marsh Reserve, all within Santa Barbara County, California, US
Spatial Resolution: Point data
Temporal Resolution: One-time measurements
Temporal Coverage: 2022-02-23 to 2022-09-27
Study Areas: Provided in decimal degrees
| Site | Westernmost Longitude | Easternmost Longitude | Northernmost Latitude | Southernmost Latitude |
|---|---|---|---|---|
| Dangermond Preserve | -120.50 | -120.35 | 34.58 | 34.44 |
| Sedgwick Reserve | -120.07 | -120.01 | 34.74 | 34.68 |
| Carpinteria Salt Marsh Reserve | -119.55 | -119.53 | 34.41 | 34.39 |
Data File Information:
This dataset contains the following files:
SHIFT_Leaf_Traits_LMA_LWC_Chl.csv: Provides the associated leaf traits (wet weight, dry weight, leaf mass per area, leaf water content), leaf pigments (chlorophyll), and species information for each scan. Missing data is indicated by "NA" for text variables and -9999 for numeric variables. Note: For version 2, this file was updated with additional data and the column "ID" was changed to "plot_event_ID" for compatibility with other datasets.
LMAscans.zip: Scanned images of leaves in JPEG (.jpeg) format from which leaf traits were calculated. Numerical portion of the image file name <SampleNumber>_LMA.jpeg corresponds to the <sample_number> field in SHIFT_Leaf_Traits_LMA_LWC_Chl.csv.
ProcessedLMAScans.zip: Final processed leaf images in JPEG (.jpg) format. Numerical portion of file name corresponds to the <sample_number> field in SHIFT_Leaf_Traits_LMA_LWC_Chl.csv.
LeafAreaCalc.py: Processing code, in Python, used to calculate leaf area.
Table 1. Data dictionary for SHIFT_Leaf_Traits_LMA_LWC_Chl.csv. Note: Some variables in this dataset are related to variables in other SHIFT datasets. Please see Figure 2 for additional details.
| Variable | Units | Description |
|---|---|---|
| plot_event_ID | - | Leaf specimen identifier |
| species_or_type | - | Scientific name and common name for leaf specimen |
| sample_number | - | Identifier for each sample |
| sample_date | YYYY-MM-DD | Sample date |
| latitude | degrees north | Latitude of plot in decimal degrees |
| longitude | degrees east | Longitude of plot in decimal degrees |
| plot_name | - | Plot name |
| phenophase | - | Phenophase |
| fractional_coverage | text | Visual estimate of percent coverage of green vegetation for species in field plot |
| wet_weight | g | Weight of leaves before drying |
| dry_weight | g | Weight of dried leaves |
| LWC | percent | Leaf water content: 100*(wet weight - dry weight)/(wet weight) |
| CRF | Chlorophyll Fluorescence Ratio | |
| CHL | mg m-2 | Relative chlorophyll content |
| LMA | g m-2 | Leaf mass per area in grams dry mass per m2 |
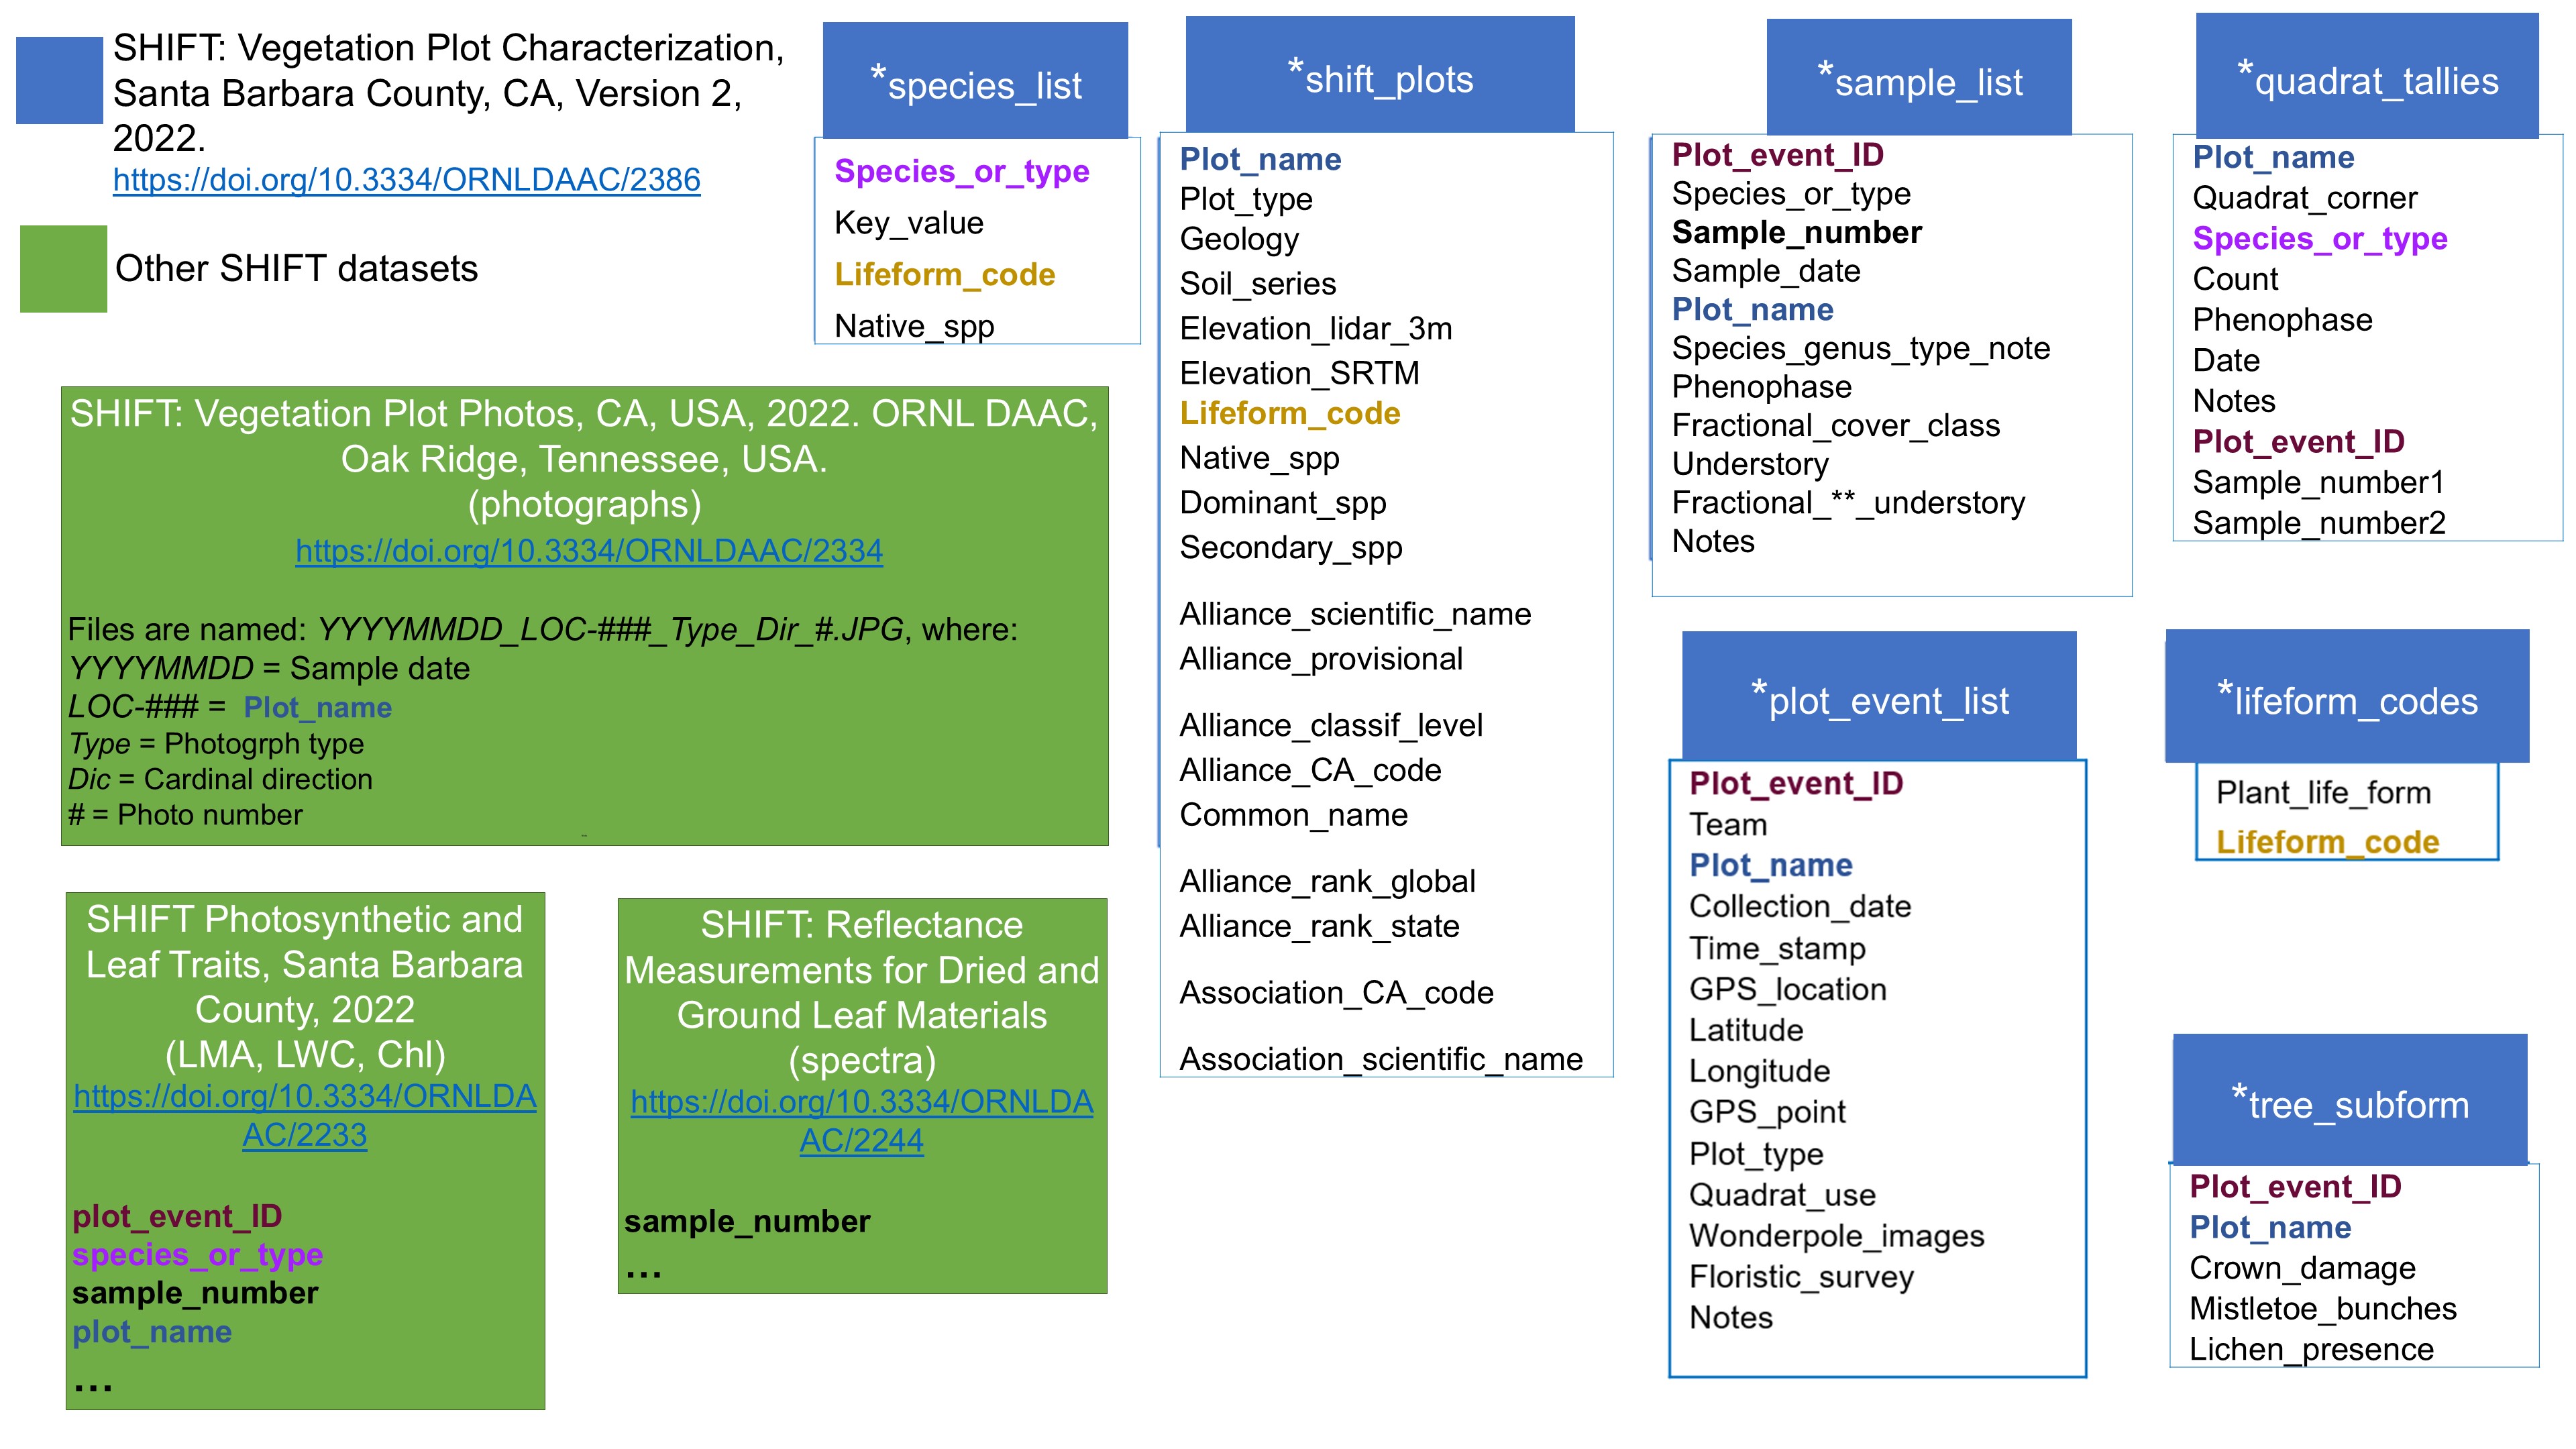
Figure 2. Variable crosswalk table for related SHIFT datasets.
Application and Derivation
This dataset provides measurements of leaf traits (area, wet weight, dry weight, leaf mass per area, leaf water content), leaf pigments (chlorophyll), and species information as sampled from meadow, shrub, and tree sites. The data were collected for the purposes of supporting the SBG SHIFT campaign in efforts to provide accurate information on plant communities over a large region of Santa Barbara County, California.
Quality Assessment
Sample data were manually edited to remove poor quality scans; relative weights were checked to ensure quality.
Data Acquisition, Materials, and Methods
Study sites
Study sites were located in Santa Barbara County, California. Individual plots approximately eight meters squared in area for meadow and shrub plots were sampled within the study sites. For tree plots, a plot was the ground area of a single tree canopy. Sunlit leaves were collected from the meadow, tree, or shrub species in each plot. The percent coverage within the plot for each collected species was visually estimated.
Leaf trait measurements
Species-level leaf trait measurements from meadow, tree, and shrub species were sampled from the study sites across Santa Barbara county. Sunlit leaves at differing canopy scales were sampled and stored in gallon ziplocks and stored in a cooler until processing (within 1-8 hours). After sample collection, [>XX leaves/at least YY grams] of leaves haphazardly selected from the sample were weighed to record the initial wet weight. Leaves in each sample group were then laid out on red or pink solid color background paper to maximize contrast for the image scanning area calculation. Python was used to process these scans and calculate leaf areas. Samples were then dried out in an oven and weighed to measure the dry weight. The wet weight, dry weight, and calculated leaf area were used to determine the LWC of the sample.
Leaf pigment measurements
Five leaves from each sample were measured for chlorophyll in the field immediately after sample collection using an Opti-Sciences CCM-300. The measurements from the five leaves are averaged to obtain the relative chlorophyll content (CHL) and chlorophyll fluorescence ratio (CFR).
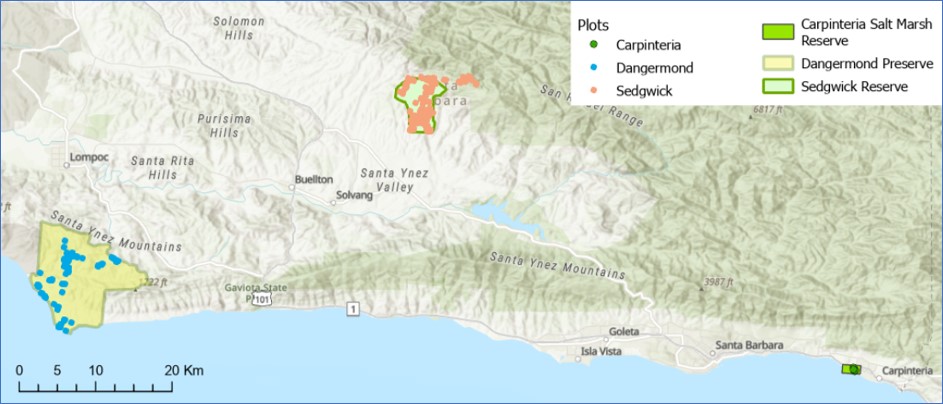
Figure 3. Plot and study area locations in Santa Barbara County in central California,US.
Data Access
These data are available through the Oak Ridge National Laboratory (ORNL) Distributed Active Archive Center (DAAC).
SHIFT: Photosynthetic and Leaf Traits, Santa Barbara County, 2022
Contact for Data Center Access Information:
- E-mail: uso@daac.ornl.gov
- Telephone: +1 (865) 241-3952
References
Chadwick, K.D., et al. 2024. Unlocking ecological insights from subseasonal visible-to-shortwave infrared imaging spectroscopy: The SHIFT Campaign. Ecosphere. (under review)
Chadwick, K.D., N. Queally, T. Zheng, J. Cryer, C. Vanden Heuvel, C. Villanueva-Weeks, C. Ade, L. Anderegg, Y. Angel, B. Baker, I. Boving, R.K. Braghiere, P. Brodrick, P. Campbell, K.C. Cushman, F. Davis, P.D. Dao, A. Dibartolo, R. Eckert, K. Grant, B. Heberlein, M. Johnson, J. Joutras, C. Kibler, M. Klope, K. Kovach, A. Kreisberg, P. Lovegreen, A.J. Maguire, C. Mcmahon, K. Miner, C. Nickles, F. Ochoa, J.P. Ocón, A. Ongjoco, E. Ordway, M. Park, R. Pavlick, A.M. Raiho, D.A. Roberts, D.S. Schimel, F.D. Schneider, K. Thompson, P. Townsend, E. Vermeer, N. Vinod, and K. Zumdahl. 2023. SHIFT Photosynthetic and Leaf Traits, Santa Barbara County, 2022. ORNL DAAC, Oak Ridge, Tennessee, USA. https://doi.org/10.3334/ORNLDAAC/2233
Chadwick, K.D., K. Brodrick, T. Grant, A. Goulden, N. Henderson, N. Falco, H. Wainwright, K.H. Williams, M. Bill, I. Breckheimer, E.L. Brodie, H. Steltzer, C.F.R. Williams, B. Blonder, J. Chen, B. Dafflon, J. Damerow, M. Hancher, A. Khurram, J. Lamb, C.R. Lawrence, M. McCormick, J. Musinsky, S. Pierce, A. Polussa, M.H. Porro, A. Scott, H.W. Singh, P.O. Sorensen, C. Varadharajan, B. Whitney, M. Bizuayehu, K. Maher, and Record, ed., Sydne. Integrating airborne remote sensing and field campaigns for ecology and Earth system science. United Kingdom: N. p., 2020.https://doi.org/10.1111/2041-210X.13463
Gavlak, R., D. Horneck, and R.O. Miller. 2005. Soil, plant and water reference methods for the western region. WCC-103 Publ. Fort Collins, CO.
Queally, N., F.W. Davis, K.D. Chadwick, C. Ade, L. Anderegg, Y. Angel, B. Baker, I. Boving, R.K. Braghiere, P. Brodrick, P. Campbell, J. Cryer, K.C. Cushman, P.D. Dao, A. Dibartolo, R. Eckert, K. Grant, B. Heberlein, M. Johnson, J. Joutras, K. Kerr, C. Kibler, M. Klope, K. Kovach, A. Kreisberg, P. Lovegreen, A.J. Maguire, C.A. Mcmahon, K. Miner, C. Nickles, F. Ochoa, J.P. Ocón, A. Ongjoco, E.M. Ordway, M. Park, R. Pavlick, A.M. Raiho, D.A. Roberts, C.M. Saiki, F.D. Schneider, K. Thompson, P.A. Townsend, E. Vermeer, C. Villanueva-Weeks, N. Vinod, T. Zheng, K. Zumdahl, and D.S. Schimel. 2025. SHIFT: Vegetation Plot Characterization, Santa Barbara County, CA, Version 2, 2022. ORNL DAAC, Oak Ridge, Tennessee, USA. https://doi.org/10.3334/ORNLDAAC/2386
Queally, N., F.W. Davis, K.D. Chadwick, C. Ade, L. Anderegg, Y. Angel, B. Baker, L. Baskaran, I. Boving, R.K. Braghiere, P. Brodrick, P. Campbell, J. Cryer, K.C. Cushman, P.D. Dao, A. Dibartolo, R. Eckert, K. Grant, B. Heberlein, M. Johnson, J. Joutras, K. Kerr, C. Kibler, M. Klope, K. Kovach, A. Kreisberg, P. Lovegreen, A.J. Maguire, C. Mcmahon, K. Miner, C. Nickles, F. Ochoa, J.P. Ocón, A. Ongjoco, E. Ordway, M. Park, R. Pavlick, A.M. Raiho, D.A. Roberts, C.M. Saiki, F.D. Schneider, K. Thompson, P. Townsend, E. Vermeer, C. Villanueva-Weeks, N. Vinod, T. Zheng, K. Zumdahl, and D.S. Schimel. 2024. SHIFT: Vegetation Plot Photos, Santa Barbara, CA, USA, 2022. ORNL DAAC, Oak Ridge, Tennessee, USA. https://doi.org/10.3334/ORNLDAAC/2334
Zheng, T., N. Queally, K.D. Chadwick, J. Cryer, P. Reim, P. Townsend, E. Marsh, M. Berg, Z. Breuer, N. Burkard, A. Hanson, E. Johnson, D. Lacey, A. Lee, L. Pfau, I. Shifrin, B. Skalitzky, S. Stroschein, J. Van beek, C. Vanden heuvel, and A. Williams. 2023. SHIFT: Reflectance Measurements for Dried and Ground Leaf Materials. ORNL DAAC, Oak Ridge, Tennessee, USA. https://doi.org/10.3334/ORNLDAAC/2244
Dataset Revisions
| Version | Release Date | Revision Notes |
|---|---|---|
| 1 | 2024-02-29 | Additional data were added to the CSV file. No data were modified as provided in the first release. In addition, the column heading "ID" was changed to "plot_event_ID" for compatibility with other SHIFT datasets. |
| 1 | 2023-08-22 | First release. |