Documentation Revision Date: 2025-10-03
Dataset Version: 1
Summary
This dataset holds 274 cloud optimized GeoTIFF files, including 260 maps of foliar traits, 13 surface reflectance image by sample date, and one mask file for ocean pixels.
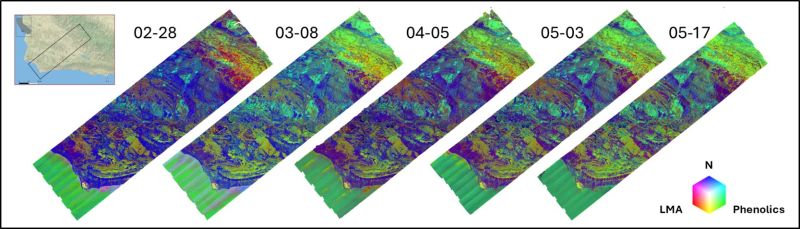
Figure 1. A time-series of leaf mass per area (LMA)-Phenolics-Nitrogen concentration composites for the SHIFT study area from 28 February to 17 May, 2002.
Citation
Zheng, T., N. Queally, C. Ade, P.G. Brodrick, K.D. Chadwick, and P.A. Townsend. 2025. SHIFT: AVIRIS-NG Derived Plant Functional Trait Mosaics. ORNL DAAC, Oak Ridge, Tennessee, USA. https://doi.org/10.3334/ORNLDAAC/2453
Table of Contents
- Dataset Overview
- Data Characteristics
- Application and Derivation
- Quality Assessment
- Data Acquisition, Materials, and Methods
- Data Access
- References
Dataset Overview
This dataset provides maps of 20 plant functional traits across a broad region of Santa Barbara County, California, USA. The maps were derived from AVIRIS-NG imagery collected during the Surface Biology and Geology High-Frequency Time Series (SHIFT) campaign between February and May 2022. Foliar traits were derived from the reflectance product by applying partial least squares regression models. These traits include foliar concentrations of cellulose, lignin, sugar, hemicellulose, aluminum, calcium, manganese, nitrogen, magnesium, potassium, phosphorus, and sulfur. Area content of chlorophylls, leaf dry mass, and leaf water content were estimated. Thirteen maps of surface reflectance (7 bands) by image acquisition date and a mask for ocean pixels are included. With near-weekly temporal resolution, the dataset captures phenological trajectories of plant traits across diverse ecosystems in the region.
Project: Surface Biology and Geology High-Frequency Time Series (SHIFT)
The Surface Biology and Geology (SBG) High Frequency Time Series (SHIFT) was an airborne and field campaign that occurred over several weeks in 2022 in support of NASA's SBG mission. Its study area included a 640-square-mile (1,656-square-kilometer) region in Santa Barbara County and the coastal Pacific waters. The primary goal of the SHIFT campaign was to collect a repeated dense time series of airborne visible to shortwave infrared (VSWIR) airborne imaging spectroscopy data with coincident field measurements in both inland terrestrial and coastal aquatic areas, supported in part by a broad team of research collaborators at academic institutions. The SHIFT campaign leveraged NASA's Airborne Visible-Infrared Imaging Spectrometer-Next Generation (AVIRIS-NG) facility instrument to collect approximately weekly VSWIR imagery across the study area.
Related Datasets:
Brodrick, P.G., R. Pavlick, M. Bernas, J.W. Chapman, R. Eckert, M. Helmlinger, M. Hess-Flores, L.M. Rios, F.D. Schneider, M.M. Smyth, M. Eastwood, R.O. Green, D.R. Thompson, K.D. Chadwick, and D.S. Schimel. 2023. SHIFT: AVIRIS-NG L2A Unrectified Surface Reflectance Version 1. ORNL Distributed Active Archive Center. https://doi.org/10.3334/ORNLDAAC/2376
- AVIRIS-NG surface reflectance used as input for the partial least-squares models.
Chadwick, K.D., N. Queally, T. Zheng, J. Cryer, C. Vanden Heuvel, C. Villanueva-Weeks, C. Ade, L. Anderegg, Y. Angel, B. Baker, I. Boving, R.K. Braghiere, P. Brodrick, P. Campbell, K.C. Cushman, F.W. Davis, P.D. Dao, A. Dibartolo, R. Eckert, K. Grant, B. Heberlein, M. Johnson, J. Joutras, C. Kibler, M. Klope, K.R. Kovach, A. Kreisberg, P. Lovegreen, A.J. Maguire, C.A. Mcmahon, K. Miner, C. Nickles, F. Ochoa, J.P. Ocón, A. Ongjoco, E.M. Ordway, M. Park, R. Pavlick, A.M. Raiho, D.A. Roberts, D.S. Schimel, F.D. Schneider, K. Thompson, P.A. Townsend, E. Vermeer, N. Vinod, and K. Zumdahl. 2023. SHIFT: Photosynthetic and Leaf Traits, Santa Barbara County, 2022. ORNL Distributed Active Archive Center. https://doi.org/10.3334/ORNLDAAC/2233
- Measurements of leaf traits (area, wet weight, dry weight, leaf mass per area, leaf water content) and leaf pigments (chlorophyll) and species information.
Queally, N., F.W. Davis, K.D. Chadwick, C. Ade, L. Anderegg, Y. Angel, B. Baker, I. Boving, R.K. Braghiere, P. Brodrick, P. Campbell, J. Cryer, K.C. Cushman, P.D. Dao, A. Dibartolo, R. Eckert, K. Grant, B. Heberlein, M. Johnson, J. Joutras, K. Kerr, C. Kibler, M. Klope, K.R. Kovach, A. Kreisberg, P. Lovegreen, A.J. Maguire, C.A. Mcmahon, K. Miner, C. Nickles, F. Ochoa, J.P. Ocón, A. Ongjoco, E.M. Ordway, M. Park, R. Pavlick, A.M. Raiho, D.A. Roberts, C.M. Saiki, F.D. Schneider, K. Thompson, P.A. Townsend, E. Vermeer, C. Villanueva-Weeks, N. Vinod, T. Zheng, K. Zumdahl, and D.S. Schimel. 2024, January 1. SHIFT: Vegetation Plot Characterization, Santa Barbara County, CA, 2022. ORNL Distributed Active Archive Center. https://doi.org/10.3334/ORNLDAAC/2295
- Characteristics of field plots with species fractional cover.
Zheng, T., N. Queally, K.D. Chadwick, J. Cryer, P. Reim, C. Villanueva-Weeks, P.A. Townsend, M. Berg, Z. Breuer, N. Burkard, A. Hanson, E. Johnson, E. Kanski, D. Lacey, C. Lapinskas, A. Lee, E. Lisenbee, E. Marsh, L. Pfau, I. Shifrin, B. Skalitzky, S. Stroschein, J. Van beek, C. Vanden heuvel, and A. Williams. 2024, January 1. SHIFT: Laboratory Foliar Chemical Analysis Results for Field Samples, CA, 2022. ORNL Distributed Active Archive Center. https://doi.org/10.3334/ORNLDAAC/2337
- Foliar chemical analyses results for foliar nitrogen (%), phosphorus (%), magnesium (%), potassium (%), calcium (%), sulfur (%), boron (ppm), iron (ppm), manganese (ppm), copper (ppm), zinc (ppm), aluminum (ppm), sodium (ppm), foliar hemicellulose and bound protein (%), cellulose (%), and lignin (%).
Acknowledgements:
The project was supported by NASA's Earth Sciences Division, Surface Biology and Geology mission (Pre-Phase A). Additional funding was provided by the National Science Foundation's ASCEND Biology Integration Institute (BII) (grant DBI 2021898)
Data Characteristics
Spatial Coverage: Santa Barbara County, California, Nevada, U.S.
Spatial Resolution: 5 m
Temporal Coverage: 2022-02-24 to 2022-05-29
Temporal resolution: Approximately weekly
Study Area: (All latitudes and longitudes given in decimal degrees)
| Site | Northernmost Latitude | Southernmost Latitude | Easternmost Longitude | Westernmost Longitude |
|---|---|---|---|---|
| California | 39.9119 | 34.3535 | -119.8658 | -120.6324 |
Data File Information
This dataset holds 274 cloud optimized GeoTIFF files, including 260 maps of foliar traits, 13 surface reflectance images by sample date, and one mask file for ocean pixels.
The foliar trait maps hold mean estimates and uncertainty of the given trait in separate bands. The file naming convention is SHIFT_traits_<date>_<trait>.tif, where
- <date> is imagery date in YYYYMMDD format
- <trait> is the foliar trait abbreviation listed in Table 1.
The surface reflectance GeoTIFFs are named SHIFT_traits_<date>_rgb_mosaic.tif.
There are 7 bands holding reflectance for wavelengths 482.4, 562.5, 662.7, 848.0, 978.2, 1649.4, and 2215.4 nm. Reflectance values were multiplied by 10,000 (valid range 0 to 9999). Negative values are not valid.
SHIFT_traits_ocean_mask.tif is a binary mask that denotes ocean (1) and non-ocean (0) pixels. It can be used to mask out ocean pixels.
GeoTIFF characteristics
- coordinate system: projected coordinates in UTM zone 10N, WGS 84 datum, units = m (EPSG 32610)
- spatial resolution: 5 m
- pixel values: foliar traits: units listed in Table 1, surface reflectance: reflectance x 10,000, ocean mask 0 or 1.
- nodata value: -9999
- number of bands: two bands (mean estimate, uncertainty) in foliar trait maps, seven bands for surface reflectance, and one band for ocean mask.
User Note: The foliar trait maps include pixels over the Pacific Ocean in the southwest portions of the flight lines; however, folar trait estimates are not valid for these ocean pixels.
Table 1. Foliar traits in the GeoTIFF files.
| Foliar trait | Abbreviation | Units | Description |
|---|---|---|---|
| LMA | LMA | g m-2 | leaf dry mass per area |
| LWC | LWC | percent | leaf water content in percent fresh weight |
| LWC (area) | LWC_area | mol m-2 | leaf water content per area |
| Total Carbon | C_perc | percent | total carbon in percent dry mass |
| Nitrogen | nitrogen | mg g-1 | nitrogen concentration |
| Hemicellulose | hemicellulose | mg g-1 | hemicellulose concentration |
| Cellulose | cellulose | mg g-1 | cellulose concentration |
| Lignin | lignin | mg g-1 | lignin concentration |
| Sugars | sugars_mg_g | mg g-1 | sugar concentration |
| Phenolics | phenolics_mg_g | mg g-1 | phenolics concentration |
| Chlorophyll a+b (area) | chl_area | µg cm-2 | chlorophyll a+b per area |
| Calcium | calcium | mg g-1 | calcium concentration |
| Potassium | potassium | mg g-1 | potassium concentration |
| Phosphorus | phosphorus | mg g-1 | phosphorus concentration |
| Magnesium | magnesium | mg g-1 | magnesium concentration |
| Sulfur | sulfur | mg g-1 | sulfur concentration |
| Aluminum | Aluminum_ppm | ppm | aluminum concentration |
| Manganese | Manganese_ppm | ppm | manganese concentration |
| δ13C isotope | d13C | 0.001 | δ13C isotope ratio in per mille |
| δ15N isotope | d15N | 0.001 | δ15N isotope ratio in per mille |
Application and Derivation
The SHIFT campaign collected a dense time series of airborne Visible to ShortWave Infrared (VSWIR) imaging spectroscopy data, accompanied by coincident field measurements across inland terrestrial and coastal aquatic ecosystems (Chadwick et al., 2025). Top-of-canopy foliar functional traits were mapped by linking imaging spectroscopy with field-measured traits. These maps capture key functional attributes related to the physical, physiological, and chemical processes of vegetation. The near-weekly mapping frequency enables tracking of seasonal trajectories of functional traits across diverse ecosystems, providing valuable insights into ecosystem functions such as photosynthesis, nutrient and water use, and resource allocation.
Quality Assessment
Foliar functional traits were estimated using partial least squares regression (PLSR) models. Model performance was evaluated with R², RMSE, and NRMSE (RMSE normalized by the trait range). All traits had testing NRMSE values within 25%, indicating that the models captured the overall magnitude of observations. However, prediction accuracy varied among traits. Most traits were modeled with reasonable confidence (training R² > 0.5 and testing R² > 0.24; Fig. 2, Table 2). In contrast, models for manganese, δ¹³C, calcium, magnesium, aluminum, and sugars showed lower reliability, and the corresponding maps should be interpreted with caution. The large gap between training and testing performance is likely due to the outlier removal step applied to the training dataset (see Section 5).
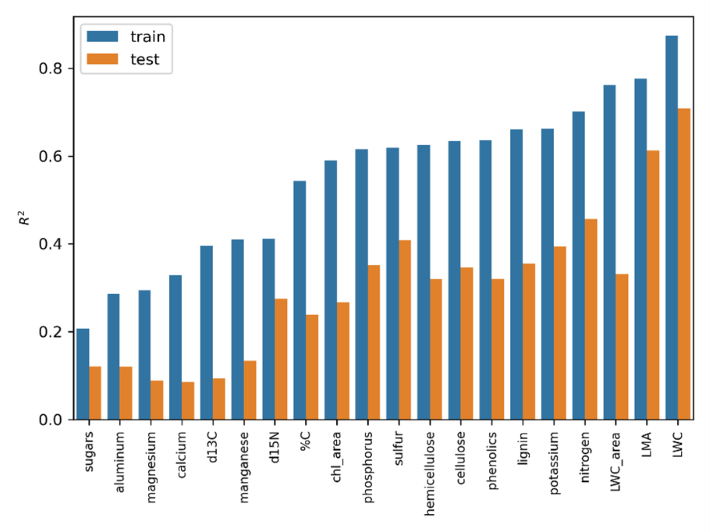
Figure 2. Model R2 for each trait in the dataset
Table 2. Summarized performance for each foliage trait.
| Training | Testing | |||||||
|---|---|---|---|---|---|---|---|---|
| Foliar trait | Wavelengths | Trait transformation | R2 | RMSE | NRMSE (%) | R2 | RMSE | NRMSE (%) |
| LMA | 1000-2400 | square root | 0.78 | 40.54 | 8 | 0.61 | 66.45 | 11.77 |
| LWC | 400-2400 | 1 | 0.87 | 3.82 | 6.88 | 0.71 | 5.86 | 12.49 |
| LWC (area) | 400-2400 | square root | 0.76 | 2.87 | 5.13 | 0.33 | 12.52 | 11.6 |
| Total Carbon | 1000-2400 | 1 | 0.54 | 1.88 | 11.12 | 0.24 | 3.25 | 13.91 |
| Nitrogen | 1000-2400 | 1 | 0.7 | 3.21 | 8.97 | 0.46 | 4.69 | 14.08 |
| Hemicellulose | 1000-2400 | 1 | 0.63 | 33.46 | 11.62 | 0.32 | 47.33 | 17.11 |
| Cellulose | 1000-2400 | 1 | 0.63 | 31.67 | 14.91 | 0.35 | 43.16 | 21.34 |
| Lignin | 1000-2400 | 1 | 0.66 | 27.78 | 11.1 | 0.35 | 42.18 | 16.37 |
| Sugars | 1000-2400 | square root | 0.21 | 18.66 | 16.23 | 0.12 | 24.61 | 16.329 |
| Phenolics | 1000-2400 | 1 | 0.64 | 19.96 | 10.98 | 0.32 | 30.09 | 16.72 |
| Chlorophyll a+b (area) | 400-2400 | 1 | 0.59 | 7.14 | 11.62 | 0.27 | 9.89 | 19.2 |
| Calcium | 1000-2400 | square root | 0.33 | 3.36 | 15.39 | 0.09 | 4.61 | 19.84 |
| Potassium | 1000-2400 | square root | 0.66 | 2.39 | 9.82 | 0.39 | 4.099 | 14.6 |
| Phosphorus | 1000-2400 | square root | 0.62 | 0.55 | 12.55 | 0.35 | 0.81 | 17.38 |
| Magnesium | 1000-2400 | square root | 0.289 | 0.99 | 14.5 | 0.09 | 1.59 | 16.64 |
| Sulfur | 1000-2400 | square root | 0.62 | 0.35 | 7.72 | 0.41 | 0.75 | 11.17 |
| Aluminum | 1000-2400 | square root | 0.289 | 48.98 | 14.64 | 0.12 | 86.46 | 16.399 |
| Manganese | 1000-2400 | square root | 0.41 | 127.14 | 16.58 | 0.13 | 204.16 | 18.899 |
| δ13C | 1000-2400 | 1 | 0.4 | 1.27 | 13.67 | 0.09 | 1.75 | 17.57 |
| δ15N | 1000-2400 | 1 | 0.41 | 1.56 | 12.51 | 0.27 | 2.19 | 14.56 |
Data Acquisition, Materials, and Methods
The trait models in this study are data-driven partial least squares regressions (PLSR) relating AVIRIS-NG reflectance (Brodrick et al., 2003) to field-measured plot traits (Figure 3). Spectra were extracted from all pixels within manually delineated plot polygons (Queally et al., 2024), filtered by NDVI (NDVI>0.5) and reflectance at 978 nm (r978 >0.1) to remove non-green and shaded pixels. The remaining spectra were averaged to calculate a representative plot spectrum. The spectral range of 1000–2400 nm was used for all trait PLSRs except LWC, LWC_area, and chlorophyll content, where 400–2400 nm was included to capture the water absorption as well as the red-edge region.
Plot traits were derived as weighted sums of species traits (Chadwick et al., 2023, Zheng et al., 2024) and their cover fractions within each plot (Queally et al., 2024). SHIFT plots collected between February and May were used to train the models (Fig. 4). Plots sampled in September were excluded because AVIRIS-NG L2A data were not available at the time this dataset was created. For traits with strong right skewness, we applied a square-root transformation during PLSR training; however, all model evaluations and final trait maps were based on values transformed back to the original scale (Table 2).
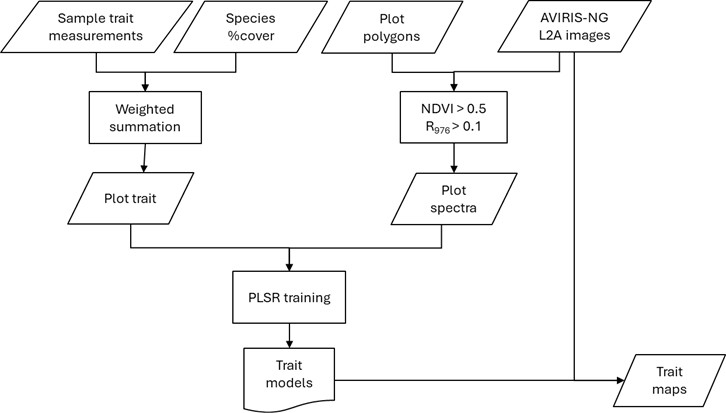
Figure 3. The workflow to create foliar trait maps for the SHIFT study area.
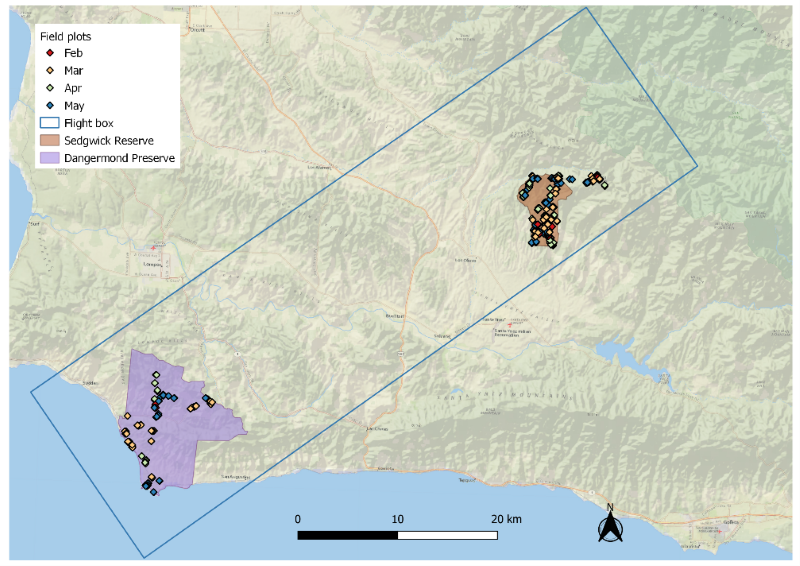
Figure 4. Locations of field plots in the SHIFT study area. Base map ESRI World Imagery
An ensemble approach for PLSR training was employed. The training dataset was first split into 20% testing and 80% training subsets. Outliers in the training subset were identified as the 5% of samples with the highest absolute residuals from 100 cross-validation permutations. After removing outliers, the remaining data were randomly divided into a calibration set (75%) and a validation set (25%). PLSR models were fitted on the calibration set and evaluated on the validation set. For each training subset, 100 permutations were performed, and the prediction residual error sum of squares (PRESS; Chen et al., 2004) was used to determine the optimal number of orthogonal spectral vectors. A final PLSR model was then fitted to the outlier-free training subset using the selected number of components and evaluated on the testing subset. This procedure was repeated across 200 different 20/80 splits, resulting in an ensemble of 200 PLSR models (Figure 5).
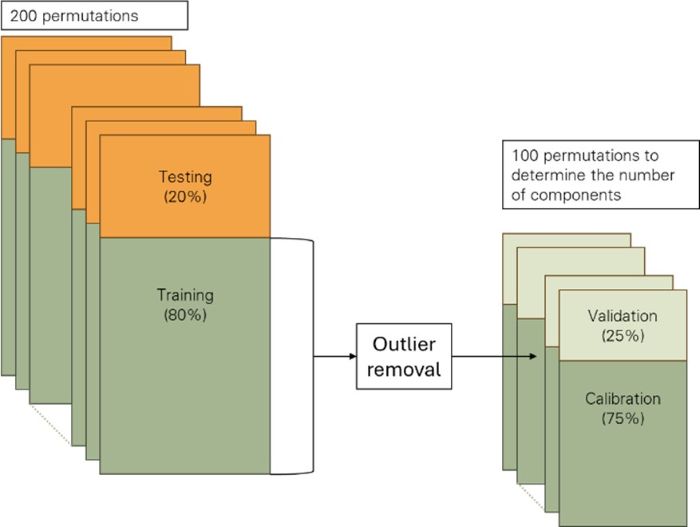
Figure 5. Schematic diagram illustrating the partitioning of training data for PLSR model development.
The 200 trait models were applied to AVIRIS-NG L2A surface reflectance data (Brodrick et al., 2003) to generate trait maps for the study area. For each pixel, the mean of the 200 model predictions was taken as the trait value, and the standard deviation was used as the corresponding prediction uncertainty. Flight-line level trait maps for each acquisition date were mosaicked into a single composite covering the flight box. The number of flight lines included in each mosaic is summarized in Table 5.
Table 5. Acquisition dates of AVIRIS-NG imagery and number of AVIRIS-NG flight lines in the trait mosaic for each date.
| Date | 2022-02-24 | 2022-02-28 | 2022-03-08 | 2022-03-16 | 2022-03-22 | 2022-04-05 | 2022-04-12 |
|---|---|---|---|---|---|---|---|
| Flightlines | 9 | 9 | 9 | 9 | 11 | 9 | 9 |
| Date | 2022-04-20 | 2022-04-29 | 2022-05-03 | 2022-05-11 | 2022-05-17 | 2022-05-29 | |
| Flightlines | 9 | 7 | 9 | 9 | 7 | 8 |
Data Access
These data are available through the Oak Ridge National Laboratory (ORNL) Distributed Active Archive Center (DAAC).
SHIFT: AVIRIS-NG Derived Plant Functional Trait Mosaics
Contact for Data Center Access Information:
- E-mail: uso@daac.ornl.gov
- Telephone: +1 (865) 241-3952
References
Brodrick, P.G., R. Pavlick, M. Bernas, J.W. Chapman, R. Eckert, M. Helmlinger, M. Hess-Flores, L.M. Rios, F.D. Schneider, M.M. Smyth, M. Eastwood, R.O. Green, D.R. Thompson, K.D. Chadwick, and D.S. Schimel. 2023. SHIFT: AVIRIS-NG L2A Unrectified Surface Reflectance Version 1. ORNL Distributed Active Archive Center. https://doi.org/10.3334/ORNLDAAC/2376
Chadwick, K.D., N. Queally, T. Zheng, J. Cryer, C. Vanden Heuvel, C. Villanueva-Weeks, C. Ade, L. Anderegg, Y. Angel, B. Baker, I. Boving, R.K. Braghiere, P. Brodrick, P. Campbell, K.C. Cushman, F.W. Davis, P.D. Dao, A. Dibartolo, R. Eckert, K. Grant, B. Heberlein, M. Johnson, J. Joutras, C. Kibler, M. Klope, K.R. Kovach, A. Kreisberg, P. Lovegreen, A.J. Maguire, C.A. Mcmahon, K. Miner, C. Nickles, F. Ochoa, J.P. Ocón, A. Ongjoco, E.M. Ordway, M. Park, R. Pavlick, A.M. Raiho, D.A. Roberts, D.S. Schimel, F.D. Schneider, K. Thompson, P.A. Townsend, E. Vermeer, N. Vinod, and K. Zumdahl. 2023.SHIFT: Photosynthetic and Leaf Traits, Santa Barbara County, 2022. ORNL Distributed Active Archive Center. https://doi.org/10.3334/ORNLDAAC/2233
Chadwick, K.D., F. Davis, K.R. Miner, R. Pavlick, M. Reynolds, P.A. Townsend, P.G. Brodrick, C. Ade, J. Allen, L. Anderegg, Y. Angel, I. Boving, K.B. Byrd, P. Campbell, L. Carberry, K.C. Cavanaugh, K.C. Cavanaugh, K. Easterday, R. Eckert, M. Gierach, K. Gold, E. Hestir, F. Huemmrich, M. Klope, R.F. Kokaly, P. Lovegreen, K. Luis, C. McMahon, N. Nidzieko, F. Ochoa, A.J. Ongjoco, E. Ordway, M. Pascolini-Campbell, N. Queally, D.A. Roberts, C.M. Saiki, F.D. Schneider, A.N. Shiklomanov, G.D. Silva, J. Snyder, M. Thornton, A.T. Trugman, N. Vinod, T. Zheng, D.M. Avouris, B. Baker, L. Baskaran, T. Bell, M. Berg, M. Bernas, N. Bohn, R.K. Braghiere, Z. Breuer, A.J. Brooks, N. Burkard, J. Burmistrova, K. Cawse-Nicholson, J. Chapman, J. Chazaro-Haraksin, J. Cryer, K.C. Cushman, K. Dahlin, P.D. Dao, A. DiBartolo, M. Eastwood, C.D. Elder, A. Giordani, K. Grant, R.O. Green, A. Hanson, B. Heberlein, M. Helmlinger, S. Hook, D. Jensen, E. Johnson, M. Johnson, M. Kiper, C. Kibler, J.Y. King, K.R. Kovach, A. Kreisberg, D. Lacey, E. Lang, C. Lee, A.M. Lopez, B. Lopez Barreto, A. Maguire, E. Marsh, C. Miller, D.M. T. Nguyen, C. Nickles, J.P. Ocón, E.P. Papen, M. Park, B. Poulter, A. Raiho, P. Reim, T.H. Robinson, F.E. Romero Galvan, E. Shafron, B.R. Skalitzky, S. Stroschein, N.C. Taylor, D.R. Thompson, K. Thompson, C. Tye, J. Van Beek, C. Vanden Heuvel, J. Vellanoweth, E. Vermeer, C. Villanueva-Weeks, K. Zumdahl, and D. Schimel. 2025. Unlocking ecological insights from sub-seasonal visible-to-shortwave infrared imaging spectroscopy: The SHIFT campaign. Ecosphere 16. https://doi.org/10.1002/ecs2.70194
Chen, S., X. Hong, C.J. Harris, and P.M. Sharkey. 2004. Sparse modeling using orthogonal forward regression with PRESS statistic and regularization. IEEE Transactions on Systems, Man and Cybernetics, Part B (Cybernetics) 34:898–911. https://doi.org/10.1109/TSMCB.2003.817107
Queally, N., F.W. Davis, K.D. Chadwick, C. Ade, L. Anderegg, Y. Angel, B. Baker, I. Boving, R.K. Braghiere, P. Brodrick, P. Campbell, J. Cryer, K.C. Cushman, P.D. Dao, A. Dibartolo, R. Eckert, K. Grant, B. Heberlein, M. Johnson, J. Joutras, K. Kerr, C. Kibler, M. Klope, K.R. Kovach, A. Kreisberg, P. Lovegreen, A.J. Maguire, C.A. Mcmahon, K. Miner, C. Nickles, F. Ochoa, J.P. Ocón, A. Ongjoco, E.M. Ordway, M. Park, R. Pavlick, A.M. Raiho, D.A. Roberts, C.M. Saiki, F.D. Schneider, K. Thompson, P.A. Townsend, E. Vermeer, C. Villanueva-Weeks, N. Vinod, T. Zheng, K. Zumdahl, and D.S. Schimel. 2024. SHIFT: Vegetation Plot Characterization, Santa Barbara County, CA, 2022. ORNL Distributed Active Archive Center. https://doi.org/10.3334/ORNLDAAC/2295
Zheng, T., N. Queally, K.D. Chadwick, J. Cryer, P. Reim, C. Villanueva-Weeks, P.A. Townsend, M. Berg, Z. Breuer, N. Burkard, A. Hanson, E. Johnson, E. Kanski, D. Lacey, C. Lapinskas, A. Lee, E. Lisenbee, E. Marsh, L. Pfau, I. Shifrin, B. Skalitzky, S. Stroschein, J. Van beek, C. Vanden heuvel, and A. Williams. 2024, January 1. SHIFT: Laboratory Foliar Chemical Analysis Results for Field Samples, CA, 2022. ORNL Distributed Active Archive Center. https://doi.org/10.3334/ORNLDAAC/2337