Documentation Revision Date: 2024-01-23
Dataset Version: 1
Summary
This archive currently includes data from February to May 2022. Additional AVIRIS-NG data from the SHIFT campaign will be added as they become available.
There are 303 files in this dataset: 152 files in cloud-optimized GeoTIFF format and 151 files in Portable Network Graphics (PNG) format.
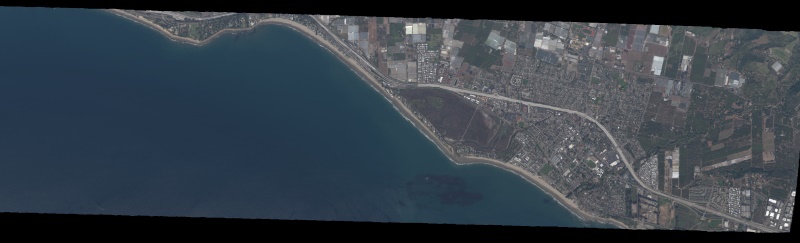
Figure 1. Portion of a full-resolution quick look image from AVIRIS-NG imagery collected on February 24, 2022, for the SHIFT campaign over the California coast at Carpinteria, east of Santa Barbara, California, U.S. Approximately 34.398 latitude, -119.539 longitude. Source: ang20220224t195402_rdn_v2z4_rgb_nr.png
Citation
Brodrick, P.G., R. Pavlick, M. Bernas, J.W. Chapman, R. Eckert, M. Helmlinger, M. Hess-Flores, L.M. Rios, F.D. Schneider, M.M. Smyth, M. Eastwood, R.O. Green, D.R. Thompson, K.D. Chadwick, and D.S. Schimel. 2023. SHIFT: AVIRIS-NG Full-Resolution True Color Images. ORNL DAAC, Oak Ridge, Tennessee, USA. https://doi.org/10.3334/ORNLDAAC/2189
Table of Contents
- Dataset Overview
- Data Characteristics
- Application and Derivation
- Quality Assessment
- Data Acquisition, Materials, and Methods
- Data Access
- References
Dataset Overview
This dataset holds full-resolution 3-band (true color) imagery acquired by NASA's Airborne Visible / Infrared Imaging Spectrometer-Next Generation (AVIRIS-NG) instrument. This imagery was collected as part of the Surface Biology and Geology High-Frequency Time Series (SHIFT) campaign which occurred during February to May, 2022, with a follow up activity for one week in September. The SHIFT campaign leveraged NASA's AVIRIS-NG facility instrument to collect VSWIR data at approximately a weekly cadence across a broad study area, enabling traceability analyses related to the science value of VSWIR revisits. AVIRIS-NG is a pushbroom spectral mapping system with high signal-to-noise ratio (SNR), designed and toleranced for high performance spectroscopy. AVIRIS-NG measures radiance at approximately 5-nm intervals in the Visible to Shortwave Infrared (VSWIR) spectral range from 380-2510 nm. The images in this dataset are true color (RGB) images from the wavelengths centered at approximately 808, 658, and 563 nm, subset from the full spectrum collected by AVIRIS-NG. The spatial resolution matches the native observed resolution (variable depending on the flightline, generally finer than 5 m and down to 2 m). There are two files for each flight line, one in PNG and one in georeferenced cloud-optimized GeoTIFF format; the GeoTIFF contains radiance floating point values while the PNG has been scaled and converted to integers.
Project: Surface Biology and Geology High-Frequency Time Series (SHIFT)
The Surface Biology and Geology (SBG) High Frequency Time Series (SHIFT) was an airborne and field campaign during February to May, 2022, with a follow up activity for one week in September, in support of NASA's SBG mission. Its study area included a 640-square-mile (1,656-square-kilometer) area in Santa Barbara County and the coastal Pacific waters. The primary goal of the SHIFT campaign was to collect a repeated dense time series of airborne Visible to ShortWave Infrared (VSWIR) airborne imaging spectroscopy data with coincident field measurements in both inland terrestrial and coastal aquatic areas, supported in part by a broad team of research collaborators at academic institutions. The SHIFT campaign leveraged NASA's Airborne Visible-Infrared Imaging Spectrometer-Next Generation (AVIRIS-NG) facility instrument to collect approximately weekly VSWIR imagery across the study area. The SHIFT campaign 1) enables the NASA SBG team to conduct traceability analyses related to the science value of VSWIR revisit without relying on multispectral proxies, 2) enables testing algorithms for consistent performance over seasonal time scales and end-to-end workflows including community distribution, and 3) provides early adoption test cases to SHIFT application users and incubate relationships with basic and applied science partners at the University of California Santa Barbara Sedgwick Reserve and The Nature Conservancy's Jack and Laura Dangermond Preserve
Related Datasets
Brodrick, P.G., R. Pavlick, M. Bernas, J.W. Chapman, R. Eckert, M. Helmlinger, M. Hess-Flores, L.M. Rios, F.D. Schneider, M.M. Smyth, M. Eastwood, R.O. Green, D.R. Thompson, K.D. Chadwick, and D.S. Schimel. 2023. SHIFT: AVIRIS-NG L1A Unrectified Radiance. ORNL DAAC, Oak Ridge, Tennessee, USA. https://doi.org/10.3334/ORNLDAAC/2184
Brodrick, P., R. Pavlick, M. Bernas, J.W. Chapman, R. Eckert, M. Helmlinger, M. Hess-Flores, L.M. Rios, F.D. Schneider, M.M. Smyth, M. Eastwood, R.O. Green, D.R. Thompson, K.D. Chadwick, and D.S. Schimel. 2023. SHIFT: AVIRIS-NG L2A Unrectified Reflectance. ORNL DAAC, Oak Ridge, Tennessee, USA. https://doi.org/10.3334/ORNLDAAC/2183
Acknowledgement
SHIFT is jointly led by NASA’s Jet Propulsion Laboratory, The Nature Conservancy, and the University of California, Santa Barbara (UCSB).
Data Characteristics
Spatial Coverage: Santa Barbara County, California and nearby Pacific Ocean
Spatial Resolution: 1 to 5 m
Temporal Coverage: 2022-02-24 to 2022-05-17
Temporal Resolution: Approximately weekly flights over study area
Study Area: (All latitudes and longitudes given in decimal degrees)
| Study Area | Westernmost Longitude | Easternmost Longitude | Northernmost Latitude | Southernmost Latitude |
|---|---|---|---|---|
| Santa Barbara County, California and nearby Pacific Ocean | -120.644 | -119.477 | 34.899 | 34.357 |
Data File Information
There are 303 files in this dataset: 152 files in cloud-optimized GeoTIFF (.tif) format and 151 files in Portable Network Graphics (.png) format. The files are true-color, RGB images with pixel resolution similar to original imagery.
The naming convention for the RGB image files is <flight prefix>_<product>_<ver>_rgb_nr.<ext>, where
- <flight prefix> = flight line identifier, angYYYYMMDDthhmmss, encoding the date and time by year (YYYY), month (MM), day (DD), hour (hh), minute (mm), and second (ss) of the flight (e.g., ang20220405t190223).
- <product> = "rdn" indicates that the RGB image was derived from radiance data.
- <ver> = versioning marker (e.g., “v2z4”) that denotes the software version used in processing the radiance data.
- <ext> = file extension of "tif" denotes a GeoTIFF file, while “png” denotes a PNG file.
Example file names for one flight are: ang20220405t190223_rdn_v2z4_rgb_nr.tif and ang20220405t190223_rdn_v2z4_rgb_nr.png.
GeoTIFF Details:
- cloud-optimized format (COG)
- projection: UTM zone 10N (EPSG: 32610) or UTM zone 11N (EPSG: 32611) using WGS84 datum
- resolution: 1.6 to 4.9-m pixels
- three bands: red, green, and blue.
- data type: Float32
The PNG files are not georeferenced; pixel resolution is same as the GeoTIFF for that flight line.
User note: There is no PNG file for flight ang20220503t203611; a GeoTIFF for that flight is included.
Application and Derivation
A primary goal of the SHIFT campaign was to collect a repeated dense time series of airborne Visible to ShortWave Infrared (VSWIR) airborne imaging spectroscopy data with coincident field measurements in both inland terrestrial and coastal aquatic areas. The AVIRIS-NG instrument collects VSWIR data that will be combined with in-situ measurements of plant diversity and ecophysiology to produce weekly estimates of ecosystem function over the 1,656-km2 study area.
These data document seasonal progressions in these ecosystems. Sampling intervals must be short enough to capture subseasonal changes in phenology with associated changes in ecosystem states and functions. Moreover, the changes occur on varying schedules in terrestrial versus aquatic systems and are influenced by spatial heterogeneity in geology, topography, and ocean currents.
Hyperspectral AVIRIS-NG data provide information on ecosystem functions such as water use. For example, to estimate canopy water content, in-situ measurements of plant water status and leaf spectra were taken >100 native oak (Quercus spp.) trees concurrent with AVIRIS-NG flights. These field data were used to calibrate the relationship between field conditions and hyperspectral imagery. Once known, these models can be applied across the landscape on a given date.
Obtaining global VSWIR observations on a 16-day return interval is one of the technological design challenges of the SBG mission. The high time frequency VSWIR data collected by SHIFT provides the opportunity to evaluate the information gained by high revisit rates and check the stability of analytical algorithms over the seasonal time series.
These images were used by SHIFT's field team to aid in selecting sites for in-situ sampling.
Quality Assessment
The AVIRIS-NG calibration procedure addresses electronic effects involving radiometric responses of each detector, optical effects involving the spatial and spectral view of each detector, and radiometric calibration. A hangar calibration, including a flat field adjustment and wavelength calibration, was performed during the SHIFT campaign and applied to all data. Radiometric correction factors were derived from a combination of hangar calibration data and the use of reflectance spectra collected over calibration targets in the field. Bad pixels are identified and corrected using statistical methods followed by laboratory and field protocols to evaluate effectiveness. Details of calibration methods are available in Chapman et al. (2019).
Geolocation for these images was adjusted using co-registration to a Landsat basemap reference.
Data Acquisition, Materials, and Methods
As a key component of the SBG High Frequency Time Series (SHIFT) campaign, VSWIR data was collected by the Airborne Visible InfraRed Imaging Spectrometer - Next Generation (AVIRIS-NG) weekly across the Mediterranean terrestrial and aquatic environments in Santa Barbara County, California. The study area for the SHIFT campaign covers 1,656 km2 in the vicinity of Santa Barbara, California, US. It stretches from Los Padres National Forest in the east, westward to the Central California coast, and into the coastal ocean (Figure 2).
The Airborne Visible-Infrared Imaging Spectrometer (AVIRIS-NG) was developed to provide continued access to high signal-to-noise ratio imaging spectroscopy measurements in the solar reflected spectral range (Green et al., 1998). AVIRIS-NG is expected to replace the AVIRIS-Classic instrument. AVIRIS-NG measures the wavelength range from 380 nm to 2510 nm with 5-nm sampling. Spectra are measured as images with 600 cross-track elements and spatial sampling from 0.3 m to 4.0 m. AVIRIS-NG has better than 95% cross-track spectral uniformity and >= 95% spectral instantaneous field of view (IFOV) uniformity. AVIRIS-NG was deployed on the B200 King Air. Additional details about the AVIRIS-NG sensor is available from Green et al. (2023).
These true-color images were derived from the AVIRIS-NG radiance data using bands from the visible spectra. The spatial resolution of these images is similar to that of the original imagery. These full resolution true color images were used by SHIFT's field team to aid in selecting sites for in-situ sampling.
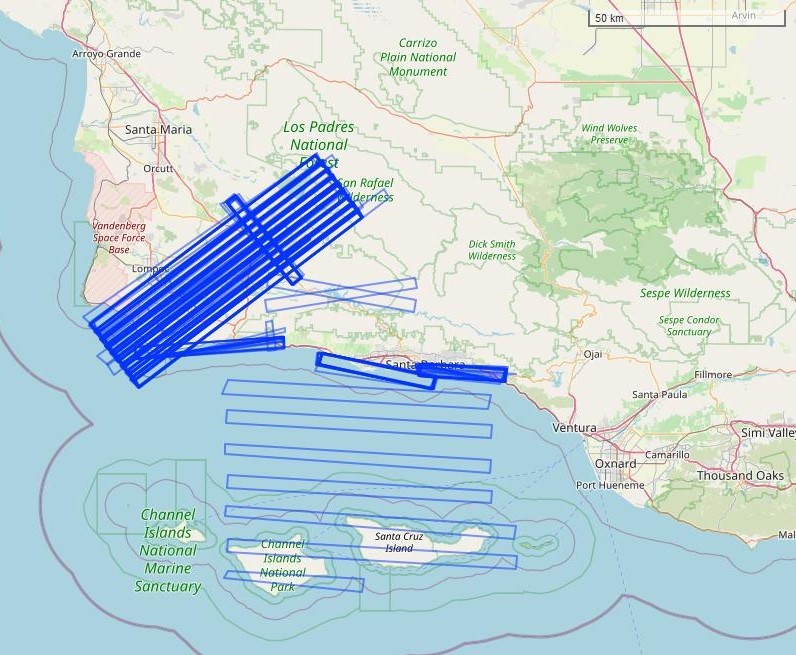
Figure 2. Location of AVIRIS-NG flightlines for SHIFT project in February to May, 2022. Map shows a portion of southern California, US. Footprints of imagery data are shown as blue rectangles.
Data Access
These data are available through the Oak Ridge National Laboratory (ORNL) Distributed Active Archive Center (DAAC).
SHIFT: AVIRIS-NG Full-Resolution True Color Images
Contact for Data Center Access Information:
- E-mail: uso@daac.ornl.gov
- Telephone: +1 (865) 241-3952
References
Brodrick, P.G., R. Pavlick, M. Bernas, J.W. Chapman, R. Eckert, M. Helmlinger, M. Hess-Flores, L.M. Rios, F.D. Schneider, M.M. Smyth, M. Eastwood, R.O. Green, D.R. Thompson, K.D. Chadwick, and D.S. Schimel. 2023. SHIFT: AVIRIS-NG L1A Unrectified Radiance. ORNL DAAC, Oak Ridge, Tennessee, USA. https://doi.org/10.3334/ORNLDAAC/2184
Brodrick, P., R. Pavlick, M. Bernas, J.W. Chapman, R. Eckert, M. Helmlinger, M. Hess-Flores, L.M. Rios, F.D. Schneider, M.M. Smyth, M. Eastwood, R.O. Green, D.R. Thompson, K.D. Chadwick, and D.S. Schimel. 2023. SHIFT: AVIRIS-NG L2A Unrectified Reflectance. ORNL DAAC, Oak Ridge, Tennessee, USA. https://doi.org/10.3334/ORNLDAAC/2183
Chapman, J.W., D.R. Thompson, M.C. Helmlinger, B.D. Bue, R.O. Green, M.L. Eastwood, S. Geier, W. Olson-Duvall, and S.R. Lundeen. 2019. Spectral and radiometric calibration of the Next Generation Airborne Visible Infrared Spectrometer (AVIRIS-NG). Remote Sensing 11: 2129. https://doi.org/10.3390/rs11182129
Green, R.O., M.L. Eastwood, C.M. Sarture, T. G. Chrien, M. Aronsson, B.J. Chippendale, J.A. Faust, B.E. Pavri, C. J. Chovit, M. Solis, M.R. Olah, and O. Williams. 1998. Imaging Spectroscopy and the Airborne Visible/Infrared Imaging Spectrometer (AVIRIS). Remote Sensing of Environment 65:227-248. https://doi.org/10.1016/S0034-4257(98)00064-9