Documentation Revision Date: 2023-08-22
Dataset Version: 1
Summary
This dataset contains 12 files in cloud-optimized GeoTIFF (COG) format and one image file in GIF format.
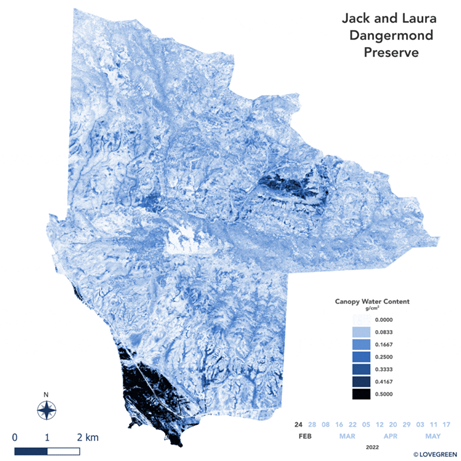
Figure 1. Canopy water content on 2022-02-24 for Dangermond Preserve, Santa Barbara County, California.
Citation
Bohn, N., P.G. Brodrick, D.R. Thompson, R. Eckert, and P. Lovegreen. 2023. SHIFT: AVIRIS-NG Derived Gridded Mosaicked Canopy Water Content, California, 2022. ORNL DAAC, Oak Ridge, Tennessee, USA. https://doi.org/10.3334/ORNLDAAC/2242
Table of Contents
- Dataset Overview
- Data Characteristics
- Application and Derivation
- Quality Assessment
- Data Acquisition, Materials, and Methods
- Data Access
- References
- Dataset Revisions
Dataset Overview
This dataset provides per-pixel vegetation canopy water content (CWC) derived from surface reflectance measured by the Airborne Visible/Infrared Imaging Spectrometer-Next Generation (AVIRIS-NG) instrument from 2022-02-24 to 2022-05-17. This imagery was acquired as part of the Surface Biology and Geology High-Frequency Time Series (SHIFT) campaign. AVIRIS-NG measures reflected radiance in 425 bands at 5-nanometer (nm) intervals in the visible to shortwave infrared spectral range between 380 and 2510 nm. Measurements were radiometrically and geometrically calibrated as well as atmospherically corrected, and are provided at approximately 5-meter spatial resolution. These data include mosaics of several flight lines that were flown on a weekly basis covering a 640-square-mile (1,656-square-kilometer) study area, which stretches from Los Padres National Forest in the east to the Central California coast and into the coastal ocean in the west, including Dangermond Preserve and UCSB's Sedgwick Reserve. These data will help track changes in vegetation characteristics from late winter through early summer by providing insights into health and resilience of ecosystems as California's climate grows drier. In particular, temporal and spatial patterns of CWC will indicate drought stress and increased wildfire risk. The CWC files in this publication were processed by applying a simple fitting of spectral absorption features of liquid water.
Project: Surface Biology and Geology High-Frequency Time Series (SHIFT)
The Surface Biology and Geology (SBG) High Frequency Time Series (SHIFT) was an airborne and field campaign during February to May, 2022, with a follow up activity for one week in September, in support of NASA's SBG mission. Its study area included a 640-square-mile (1,656-square-kilometer) area in Santa Barbara County and the coastal Pacific waters. The primary goal of the SHIFT campaign was to collect a repeated dense time series of airborne Visible to ShortWave Infrared (VSWIR) airborne imaging spectroscopy data with coincident field measurements in both inland terrestrial and coastal aquatic areas, supported in part by a broad team of research collaborators at academic institutions. The SHIFT campaign leveraged NASA's Airborne Visible-Infrared Imaging Spectrometer-Next Generation (AVIRIS-NG) facility instrument to collect approximately weekly VSWIR imagery across the study area. The SHIFT campaign 1) enables the NASA SBG team to conduct traceability analyses related to the science value of VSWIR revisit without relying on multispectral proxies, 2) enables testing algorithms for consistent performance over seasonal time scales and end-to-end workflows including community distribution, and 3) provides early adoption test cases to SHIFT application users and incubate relationships with basic and applied science partners at the University of California Santa Barbara Sedgwick Reserve and The Nature Conservancy's Jack and Laura Dangermond Preserve.
Related Datasets:
Brodrick, P.G., R. Pavlick, K.D. Chadwick, and Jet Propulsion Laboratory. 2023. SHIFT: AVIRIS-NG L1A Unrectified Radiance. ORNL DAAC, Oak Ridge, Tennessee, USA. https://doi.org/10.3334/ORNLDAAC/2184
Brodrick, P., R. Pavlick, K.D. Chadwick, and Jet Propulsion Laboratory. 2023. SHIFT: AVIRIS-NG L2A Unrectified Reflectance. ORNL DAAC, Oak Ridge, Tennessee, USA. https://doi.org/10.3334/ORNLDAAC/2183
Data Characteristics
Spatial Coverage: Central California, US, from Los Padres National Forest in the east to the Central California coast and into the coastal ocean in the west, including Dangermond Preserve and UCSB’s Sedgwick Reserve
Spatial Resolution: 5 m
Temporal Coverage: 2022-02-24 to 2022-05-17
Temporal Resolution: approximately weekly intervals
Study Areas: Latitude and longitude are given in decimal degrees.
| Site | Westernmost Longitude | Easternmost Longitude | Northernmost Latitude | Southernmost Latitude |
|---|---|---|---|---|
| Central California, US | -120.63 | -119.87 | 34.91 | 34.35 |
Data File Information
This dataset includes 12 gridded mosaics, one for each acquisition date, combining retrieved canopy water content (CWC) from several flight lines. The files are available in cloud-optimized GeoTIFF format. Files are named:
File naming convention: YYYYMMDD_cwc_phase.tif, where YYYYMMDD is the flight date (e.g. 20220224_cwc_phase.tif).
Each GeoTIFF file contains one band, populated with per-pixel CWC values in g water per cm2 of ground surface. CWC is liquid water content of the vegetation canopy, derived from the water absorption path length or equivalent water thickness (EWT).
Additionally, CWC_time_series.gif is an animated GIF that displays a time series of CWC for the Dangermond Preserve, Santa Barbara County, California, from 2022-02-24 to 2022-05-17.
Application and Derivation
Per-pixel CWC will help track changes in vegetation characteristics by providing insights into health and resilience of ecosystems as climate changes. In particular, temporal and spatial patterns of CWC indicate drought stress and increased wildfire risk.
The datasets are derived from AVIRIS-NG flights during the SHIFT campaign between February and May 2022 in Southern California (Figure 2). An objective of SHIFT was to generate precise, high-time-frequency data on plant and aquatic communities.
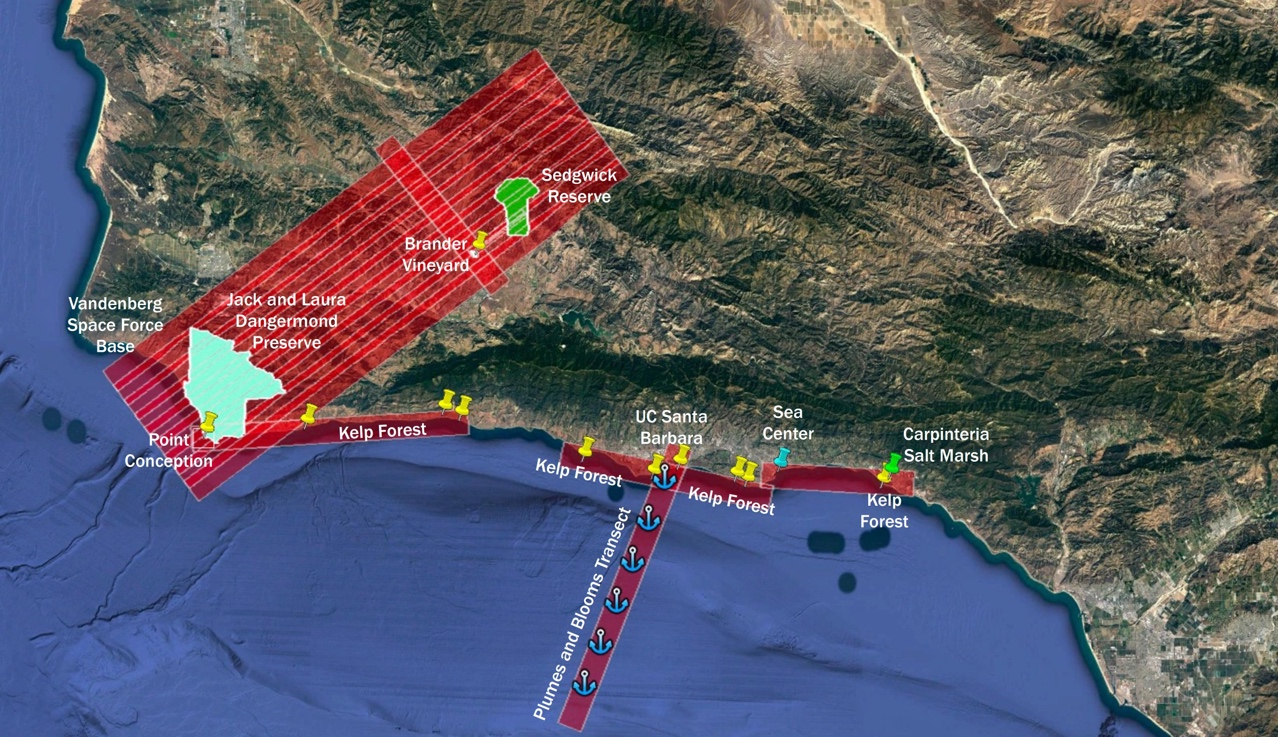
Figure 2. SHIFT flight lines of the AVIRIS-NG instrument during Spring 2022.
Quality Assessment
All AVIRIS-NG data are processed from raw data to surface reflectance by the AVIRIS-NG instrument ground data system at NASA Jet Propulsion Laboratory. Anomalies that were not detected by pre- and post-flight diagnostics are detected through sensor performance evaluation based on a preliminary analysis of the data. Surface reflectance was derived using the Optimal Estimation-based simultaneous modeling of surface and atmosphere through the ISOFIT codebase. Derived surface reflectance spectra were particularly smooth in water absorption bands and include estimates of per-band posterior uncertainties (Thompson et al. 2018).
Canopy water content (CWC) was then derived from surface reflectance by applying a well-validated algorithm based on a physical model (Green et al. 2006; Bohn et al. 2020). Bohn et al. (2020) found a systematic bias in retrieved CWC, which manifests in an almost constant overestimation by a factor of 2.5 - 3.5 (Figure 3). This is mainly caused by not accounting for multiple scattering effects within the canopy by applying the Beer-Lambert model. Beyond 0.5 g cm-2, estimated CWC values tend to converge due to absorption saturation. However, both findings do not impact the overall variability, significance, and interpretability of derived value ranges. Values range from 0.0 to 0.5 g cm-2 in the SHIFT CWC dataset.
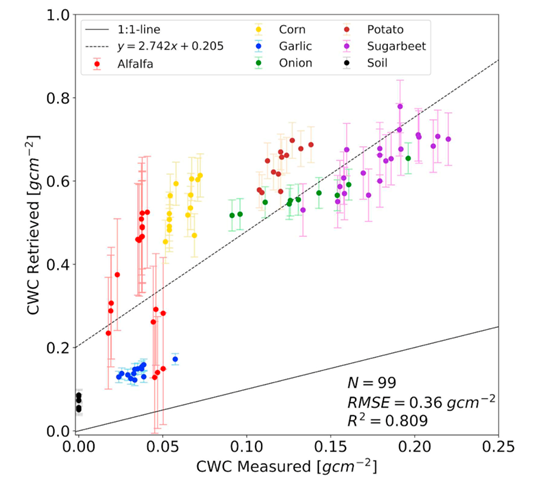
Figure 3: Comparison of retrieved canopy water content (CWC) with measured CWC from the ESA Barrax SPARC'03 field campaign. Error bars indicate the standard deviation of retrieved CWC (Bohn et al. 2020).
Data Acquisition, Materials, and Methods
The Airborne Visible/Infrared Imaging Spectrometer-Next Generation (AVIRIS-NG) is an imaging spectrometer that measures reflected radiance at 5-nm intervals in the visible to shortwave infrared spectral range from 380-2510 nm. AVIRIS-NG was built to support NASA science and applications measuring spectra as images that record the interaction of light with matter. These spectra are used to identify, measure, and monitor constituents of the Earth’s surface and atmosphere. See Thompson et al. (2018) for an explanation of L2 surface reflectance derivation from AVIRIS L1 radiance measurements.
A detailed description of the Beer-Lambert model used to derive CWC from surface reflectance can be found in Green et al. (2006) and Bohn et al. (2020).
AVIRIS-NG was flown on a King Air B200 between February and May 2022 as part of the SHIFT campaign designed to generate the most precise, high-time-frequency data on plant and aquatic communities for characterizing ecosystem structure and function near the height of the growing season. AVIRIS-NG instrument data were processed to L1 radiance and L2 reflectance data cubes and gridded mosaics were produced from the overlapping flight lines. The CWC estimates were then derived from the reflectance mosaics. The flight lines of the SHIFT campaign are depicted in Figure 2.
Data Access
These data are available through the Oak Ridge National Laboratory (ORNL) Distributed Active Archive Center (DAAC).
SHIFT: AVIRIS-NG Derived Gridded Mosaicked Canopy Water Content, California, 2022
Contact for Data Center Access Information:
- E-mail: uso@daac.ornl.gov
- Telephone: +1 (865) 241-3952
References
Bohn, N., L. Guanter, T. Kuester, R. Preusker, and K. Segl. 2020. Coupled retrieval of the three phases of water from spaceborne imaging spectroscopy measurements. Remote Sensing of Environment 242:111708. https://doi.org/10.1016/j.rse.2020.111708
Green, R.O., T.H. Painter, D.A. Roberts, and J. Dozier. 2006. Measuring the expressed abundance of the three phases of water with an imaging spectrometer over melting snow. Water Resources Research 42:W10402. https://doi.org/10.1029/2005WR004509
Thompson, D.R., V. Natraj, R.O. Green, M.C. Helmlinger, B.-C. Gao, and M.L. Eastwood. 2018. Optimal estimation for imaging spectrometer atmospheric correction. Remote Sensing of Environment 216:355–373. https://doi.org/10.1016/j.rse.2018.07.003
Dataset Revisions