Documentation Revision Date: 2018-03-02
Data Set Version: 1
Summary
This application will be updated frequently to include files from additional missions, and new data from ongoing missions such as ACT-America and ATom. For each flight, flight path data is available. Each mission has a combination of the following measurements available: CO2, CO, and CH4 data collected with an infrared cavity ring-down spectrometer system (CRDS; Picarro Inc.); ozone data collected with a dual beam differential UV absorption ozone monitor (Model 205; 2B Technologies); and trace gases collected using Programmable Flask Package (PFP) at various intervals.
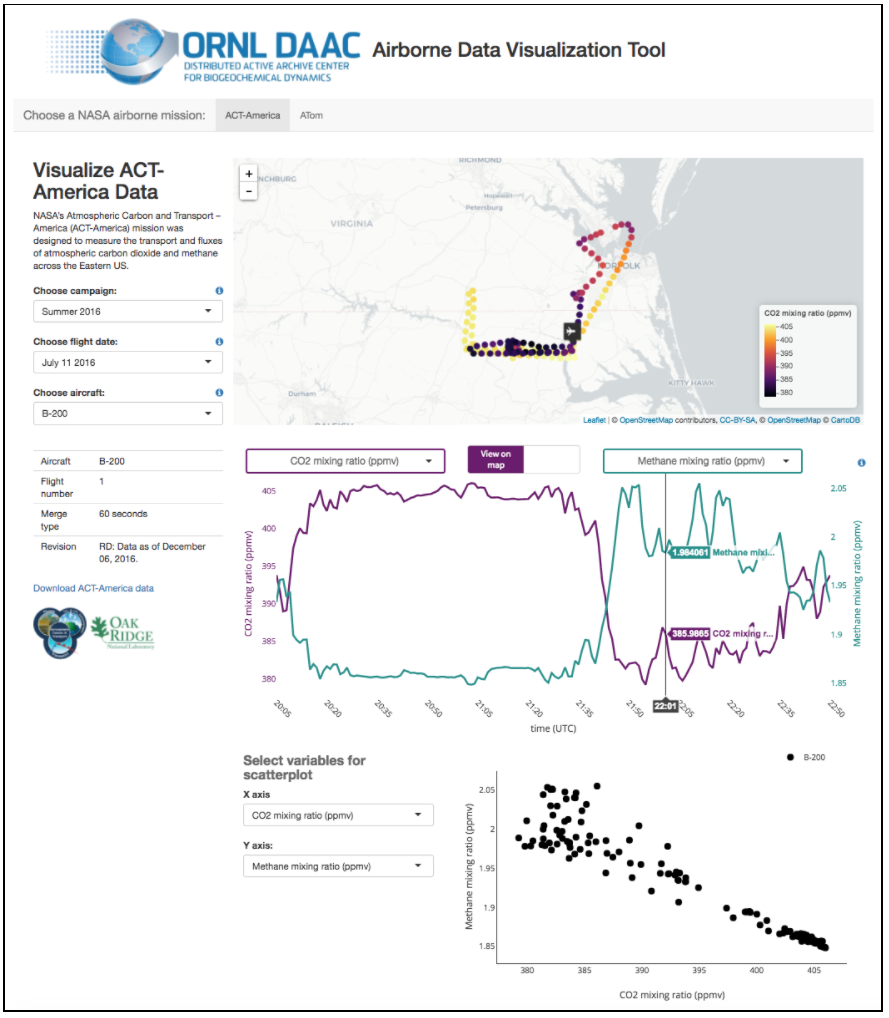
Screenshot of the Airborne Data Visualizer showing CO2 and CH4 concentrations from a flight of the B-200 aircraft on July 11 2016 as part of the ACT-America mission.
Citation
ORNL DAAC. 2018. Airborne Data Visualizer. ORNL DAAC, Oak Ridge, Tennessee, USA. https://doi.org/10.3334/ORNLDAAC/1585
Table of Contents
- Data Set Overview
- Data Characteristics
- Application and Derivation
- Quality Assessment
- Data Acquisition, Materials, and Methods
- Data Access
- References
Data Set Overview
The goal of the Airborne Data Visualizer (ADV) is to allow users to explore data from multiple airborne missions through a single tool. The ADV consists of a web application, based in R Shiny (Chang et al 2017), with menus for selecting individual flight dates and variables to view on a map or on a series of plots. Users can compare the geographic scope of measurements from multiple missions and determine which dataset meets their needs. Users can then follow the links on the page to download individual data granules from the data pool, or they can view the dataset landing page to download larger amounts of data.
This application will be updated frequently to include files from additional missions, and new data from ongoing missions such as ACT-America and ATom. For each flight, flight path data is available. Each mission has a combination of the following measurements available: CO2, CO, and CH4 data collected with an infrared cavity ring-down spectrometer system (CRDS; Picarro Inc.; see Crosson et al 2008); ozone data collected with a dual beam differential UV absorption ozone monitor (Model 205; 2B Technologies); or trace gases collected using Programmable Flask Package (PFP) at various intervals. Data can be explored via an interactive map, a time-series plot, and a scatterplot.
Acknowledgements:
Initial development of this tool was completed by Zoey Werbin during her internship with the Earth Venture Suborbital-2 funded ACT-America project at ORNL DAAC.
Data Characteristics
Spatial Coverage: Global
Temporal Coverage: 20160711 to present. Each data product has different temporal coverage within this overall time period.
Temporal Resolution: Merged data for each flight was used for the Visualizer to allow variables to be compared despite differences in temporal resolution (ex. the Picarro instrument measures gas variables sequentially rather than simultaneously, so merged data is necessary to allow for the comparison of CO2 and CH4). The lowest-resolution merge was selected whenever sufficient for visualizing data, to improve loading times; users can download higher-resolution data from the data pool links.
Spatial Resolution: Latitude/longitude coordinates were taken from temporally merged files, so the spatial resolution of each flight differs based on aircraft speed.
Application and Derivation
This airborne in-situ data can be used to calibrate and validate other atmospheric measurements and to better understand carbon fluxes and their associated uncertainties on a continental and global scale. The Airborne Data Visualizer can help users discern which of the ORNL DAAC's airborne data are most appropriate for their needs, and it can help users discover data from similar missions.
Quality Assessment
Refer to the documentation for each individual data product for quality assessment information.
Data Acquisition, Materials, and Methods
Refer to the documentation for each individual data product for data acquisition information.
Data Access
These data are available through the Oak Ridge National Laboratory (ORNL) Distributed Active Archive Center (DAAC).
Contact for Data Center Access Information:
- E-mail: uso@daac.ornl.gov
- Telephone: +1 (865) 241-3952
References
Chang, W., J. Cheng, J.J. Allaire, Y. Xie, and J. McPherson. 2017. shiny: Web Application Framework for R. R package version 1.0.5. https://CRAN.R-project.org/package=shiny
Crosson, E.R. A cavity ring-down analyzer for measuring atmospheric levels of methane, carbon dioxide, and water vapour. Appl. Phys. B92, 403-408, 2008