Documentation Revision Date: 2018-02-15
Data Set Version: 2
Summary
MAS is an airborne scanning spectrometer that acquires high spatial resolution imagery of cloud and surface features from its vantage point on-board a NASA ER-2 high-altitude research aircraft. The MAS spectrometer collects 50 multispectral bands at 16-bit resolution with a ground resolution of 50 meters from 20,000 meters altitude and a cross track scan width of 85.92 degrees.
There are 291 data files with this dataset in Hierarchical Data Format (.hdf) version 4, from 18 flights. Each flight consisted of several straight-line segments called tracks. There is a MAS multispectral data file for each track. There are companion files (.pdf format) for each flight with flight summary information, mission objectives, track images, flight paths, configuration and calibration data.

Figure 1. Selected MAS bands from Flight 00178, Track 16, on September 21, 2000 over Southern Africa.
Citation
King, M.D., and S.E. Platnick. 2018. SAFARI 2000 MODIS Airborne Simulator Data, Southern Africa, Dry Season 2000. ORNL DAAC, Oak Ridge, Tennessee, USA. https://doi.org/10.3334/ORNLDAAC/832
Table of Contents
- Data Set Overview
- Data Characteristics
- Application and Derivation
- Quality Assessment
- Data Acquisition, Materials, and Methods
- Data Access
- References
- Data Set Revisions
Data Set Overview
This dataset contains the Moderate Resolution Imaging Spectroradiometer (MODIS) Airborne Simulator (MAS) multispectral data collected during the SAFARI 2000 project. The flights were undertaken over Southern Africa by the NASA ER-2 aircraft during August and September, 2000.
MAS is an airborne scanning spectrometer that acquires high spatial resolution imagery of cloud and surface features from its vantage point on-board a NASA ER-2 high-altitude research aircraft. The MAS spectrometer collects 50 multispectral bands at 16-bit resolution with a ground resolution of 50 meters from 20,000 meters altitude and a cross track scan width of 85.92 degrees.
Data Characteristics
Spatial Coverage: Southern Africa
Spatial Resolution: The MAS spectrometer collects 50 multispectral bands at 16-bit resolution with a ground resolution of 50 meters from 20,000 meters altitude and a cross track scan width of 85.92 degrees
Temporal Coverage: 2000-08-17 to 2000-09-25
Temporal Resolution: daily
Study Area: (all latitudes and longitudes given in decimal degrees)
| Site | Westernmost Longitude | Easternmost Longitude | Northernmost Latitude | Southernmost Latitude |
|---|---|---|---|---|
| Southern Africa and the Indian Ocean | 9.06 | 41.07 | -11.81 | -32.67 |
Data File Information
There are 291 data files with this dataset in Hierarchical Data Format (.hdf), version 4. The data are for 18 flights and each flight consisted of several straight-line segments called tracks. All flights do not have the same number of tracks. There is a MAS multispectral data file for each track.
There are companion files (.pdf format) with images and documentation for each flight including flight track maps, browse images, sample RGB images, configuration files, and the ER-2 flight logs.
Data file names
The files are named as MASL1B_FlightNumber_TrackNumber_YYYYMMDD_####_####_V02.hdf
Where:
MASL1B=MAS Level 1B
FlightNumber=Flight number 00XXX
TrackNumber=track number. These vary within each flight.
YYYYMMDD=date of the flight
V02=granule version 2 data
####_####=Numbers- part of the granule producers id. Refer to the global attributes in the companion files MAS_Flight_Summary
Example file name:
MASL1B_00148_01_20000820_0722_0731_V02.hdf: MAS data for flight 00148, track 1, August 20, 2000.
Table 2. Flights, number of tracks, and overall extents of the scanline nadir pixels.
| Flight number-number of tracks | Flight date | East | West | North | South |
|---|---|---|---|---|---|
| 00147-10 | 2000-08-17 | 34.65 | 29.46 | -23.63 | -32.67 |
| 00148-16 | 2000-08-20 | 30.89 | 26.2 | -21.65 | -26.08 |
| 00149-13 | 2000-08-22 | 32.35 | 27.01 | -22.84 | -28.35 |
| 00150-9 | 2000-08-24 | 39.5 | 36.92 | -13.5 | -19.74 |
| 00151-16 | 2000-08-25 | 28.62 | 22.99 | -12.17 | -23.14 |
| 00152-16 | 2000-08-27 | 28.48 | 21.53 | -17.96 | -24.49 |
| 00153-17 | 2000-08-29 | 33.84 | 27.93 | -22.37 | -28.56 |
| 00155-16 | 2000-09-01 | 28.68 | 22.91 | -13.85 | -24.16 |
| 00156-10 | 2000-09-04 | 31.18 | 22.34 | -19.88 | -24.71 |
| 00157-17 | 2000-09-06 | 28.15 | 23.03 | -13.21 | -24.04 |
| 00158-19 | 2000-09-07 | 34.5 | 29.7 | -23.11 | -27.98 |
| 00160-24 | 2000-09-11 | 29.69 | 11.21 | -17.89 | -27.91 |
| 00175-19 | 2000-09-13 | 27.56 | 11.44 | -17.61 | -24.07 |
| 00176-21 | 2000-09-14 | 27.86 | 9.06 | -14.44 | -23.48 |
| 00177-18 | 2000-09-17 | 29.33 | 19.25 | -18.39 | -27.03 |
| 00178-17 | 2000-09-21 | 36.79 | 28.64 | -18.95 | -26.29 |
| 00179-13 | 2000-09-23 | 32.53 | 26.17 | -23.43 | -29.57 |
| 00180-21 | 2000-09-25 | 41.07 | 26.28 | -11.81 | -27.11 |
Companion File Information
Table 3. Companion file names and descriptions
| File name | Description |
|---|---|
| MAS_Flight_00-xxx.pdf | 18 flight summaries (one for each flight) with flight start and ending times, latitude, longitude, solar zenith and azimuth, flight data (altitude, head degrees, scan lines), flight mission objectives, images, and global attributes. xxx represents the flight number |
Application and Derivation
These data were designed for validation of the MODIS instrument.
Quality Assessment
All SAFARI 2000 MAS flight data have been fully processed with final calibrations. The flight summaries, calibration, configurations and images associated with each flight are provided as companion files.
Data Acquisition, Materials, and Methods
Moderate Resolution Imaging Spectroradiometer (MODIS) Airborne Simulator (MAS) multispectral data were collected during 18 flights for the SAFARI 2000 project. The flights were conducted over Southern Africa by the NASA ER-2 aircraft during August and September, 2000.
MAS is an airborne scanning spectrometer that acquires high spatial resolution imagery of cloud and surface features from its vantage point on-board a NASA ER-2 high-altitude research aircraft. The MAS spectrometer collects 50 multispectral bands at 16-bit resolution with a ground resolution of 50 meters from 20,000 meters altitude and a cross track scan width of 85.92 degrees.
All SAFARI 2000 MAS flight data have been fully processed with final calibrations. The flight summaries, paths, mission descriptions, calibration, configurations and images associated with each flight are provided in companion files.
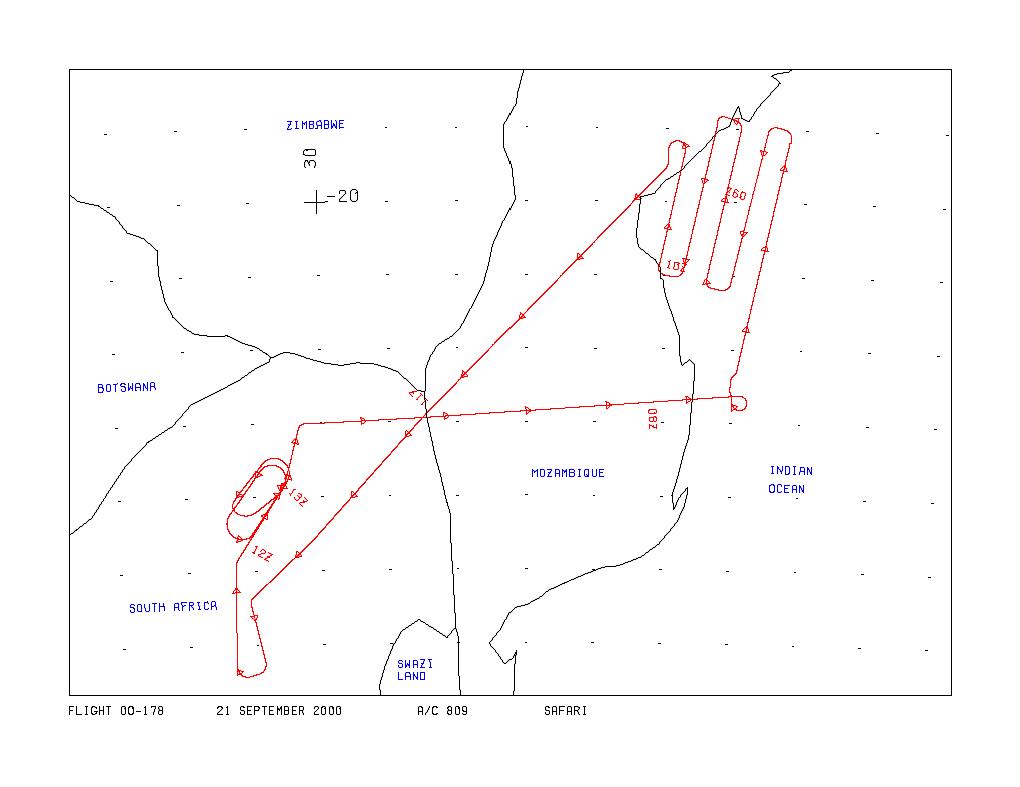
Figure 2. Flight path for 00-178, Sept 21, 2000.
Flight path overviews provided by flight numbers and flight dates- refer to the companion PDFs described in Section 2 of this document for additional information.
00147 (2000-08-17): Surface sites at Skukuza (start and return flights), the lowveld of Kruger National Park and Swaziland.
00148 (2000-08-20): The Rustenburg Platinum mines, Madikwe, Selibe-Phikwe, Pilansberg, and Waterkloof, then to a prescribed burn of the Madikwe Game Reserve.
00149 (2000-08-22): Skukuza over a prescribed burn in Satara, and later over Witbank and downtown Johannesburg. The RC-10 camera was turned on for flights over the Limpopo River, Kruger National Park, Durnacol, Witbank, Johannesburg, and Pretoria. The ER-2 cut across Swaziland and flew a southerly flight track over Durnacol coal mines in Kwazulu-Natal, before proceeding north and turning to overfly the Witbank coal-fired power plants of the highveld.
00150 (2000-08-24): South Africa to Indian Ocean over Inhaca Island, northeastern Mozambique, Malawi, the Zambezi River, and northern Kruger National Park. During the final part of the flight, the ER-2 flew west over southern Mozambique and turned south along a geological feature in the northern part of Kruger National Park, before turning back to Pietersburg.
00151 (2000-08-25): Francistown and Sowa Pan, Kaoma, the copper belts in northern Zambia, the Zambezi River from Zambezi through to the Caprivi Strip, and over Maun. The ER-2 then did a pass over the Maun Tower in Botswana.
00152 (2000-08-27): Francistown en route to the Terra overpass of the Sowa Pan MISR ground site. The final flight leg took it once again over the Maun Tower en route to two sites that were characterized in detail during the Kalahari Transect in March (Okwa River Crossing and Tsane).
00153 (2000-08-29): Skukuza and Inhaca Island.
00155 (2000-09-01): Zambia on transit to 18 minute leg (220 km) centered Mongu airport.
00156 (2000-09-04): Sua Pan PARABOLA instrument site on a NW-SE oriented 12 minute line for AirMISR. Then overfly Maun, Tshane and the Okwa River, finishing by over flying the Murchisan Lineament.
00157 (2000-09-06): Mongu tower and Mongu airfield, burn scars and a small controlled fire launch near Kaoma, returned to Mongu airfield line for a final overpass of MPL and on to Senanga site. The ER-2 then proceeded on a flyby of Matimba power station near Ellisras.
00158 (2000-09-07): The Timbavati 1000-3000 hectare controlled burn, Skukuza airfield to the east on a line parallel to the Timbavati fire line, Inhaca Island, and the Phalaborwa industrial site and N-S run crossing the Oliphants river valley.
00160 (2000-09-11): The west coast of Namibia.
00175 (2000-09-13): The Namibian coast during a Terra overpass of Etosha National Park (ENP), Namibia, and overfly of the Okwa River and Tshaney SAVE sites in Botswana.
00176 (2000-09-14): The Namibian and Angolan coast, the Okaukuejo Camp at Etosha National Park (ENP), the Brandenberg crater and other geology on the northern Namibian coast, and the Serowe SAVE site in Botswana.
00177 (2000-09-17): The Maun tower site, the large burn scar and possibly active fire in northeast Namibia, the power plants east of Johannesburg (Witbank, Secunda and Tutuka), industrial sites south of Johannesburg along with the Vredefort dome (ancient impact crater site), and the Thabazimibia-Murchinson Lineament.
00178 (2000-09-21): The Mozambique Channel, power plants east of Johannesburg (Witbank, Secunda and Tutuka), along with industrial sites south of Johannesburg and the Vredefort dome (ancient impact crater site).
00179 (2000-09-23): The Skukuza tower site, Katse Dam and Malibamatso River catchment, power plants east of Johannesburg, including Witbank, Secunda and Tutuka (third attempt), industrial sites south of Johannesburg along with the Vredefort dome (ancient impact cratersite), and the Merensky Nature Reserve.
00180 (2000-09-25): Interior Moazambique, up through Malawi, then east to the Mozambique Channel and south down along the coast, to observe aerosol transport through the northeastern section of the SAFARI study region, Inhaca Island, Mozambique and the Skukuza tower in Kruger National Park, the power plants east of Johannesburg and the industrial sites to the south. This was the final flight.
Data Access
These data are available through the Oak Ridge National Laboratory (ORNL) Distributed Active Archive Center (DAAC).
SAFARI 2000 MODIS Airborne Simulator Data, Southern Africa, Dry Season 2000
Contact for Data Center Access Information:
- E-mail: uso@daac.ornl.gov
- Telephone: +1 (865) 241-3952
References
King, M. D., W. P. Menzel, P. S. Grant, J. S. Myers, G. T. Arnold, S. E. Platnick, L. E. Gumley, S. C. Tsay, C. C. Moeller, M. Fitzgerald, K. S. Brown and F. G. Osterwisch, 1996: Airborne scanning spectrometer for remote sensing of cloud, aerosol, water vapor and surface properties. J. Atmos. Oceanic Technol., 13, 777-794.
Data Set Revisions
This dataset was initially published as:
King, M.D., and S.E. Platnick. 2006. SAFARI 2000 MODIS Airborne Simulator Data, Southern Africa, Dry Season 2000. ORNL DAAC, Oak Ridge, Tennessee, USA. http://dx.doi.org/10.3334/ORNLDAAC/832
For this revision, Version 2, the special data viewer was removed and the documentation was updated. Data files are unchanged.