Get Data
Summary:
This data set contains five data files, in comma-separated format (.csv), derived from the Walker Branch Watershed (WBW) vegetation inventory in eastern Tennessee. Field studies of permanent vegetation plots were conducted using one sampling design over a 40-year period (1967 to 2006). The data set contains long-term measurements of diameter at breast height (DBH) determined on stratified randomly-located inventory plots within the 4 different vegetation types (oak-hickory, pine-oak-hickory, pine, and mesophytic hardwoods) located in the WBW in 1967.
The WBW plot-level vegetation DBH data are provided in four files. One file contains the complete set of inventory records (139,806 observations). To accommodate spreadsheet use, the complete inventory is split into three files, one containing 52,110 observations and the other two containing 48,231 and 39,465 observations, respectively.
The fifth file contains the WBW vegetation species inventory with species names, the numeric species code for each species, a species group designation, the scientific name for each species, and the literature-derived ratio of g lignin/g N for leaves of each species.
NPP values have been reported for various forest stands at different locations within the WBW by Olson et al. (2012a, b; DeAngelis et al. (1997); and Esser (1998). Total NPP values range from 380 gC/m2/yr for forest stands dominated by yellow poplar to 790 gC/m2/yr for forest stands dominated by oaks.
Revision Notes: This updated vegetation inventory data set includes results of the 2006 survey and updates to previous results based on the latest survey. The 1967-2006 data set completely supersedes the 1967-1997 data set. If you downloaded the 1967-1997 data set before September 3, 2013, you should download the 1967-2006 version at your earliest convenience.
Additional Documentation:
The Net Primary Productivity (NPP) data collection contains field measurements of biomass, estimated NPP, and climate data for terrestrial grassland, tropical forest, temperate forest, boreal forest, and tundra sites worldwide. Data were compiled from the published literature for intensively studied and well-documented individual field sites and from a number of previously compiled multi-site, multi-biome data sets of georeferenced NPP estimates. The principal compilation effort (Olson et al., 2001) was sponsored by the NASA Terrestrial Ecology Program. For more information, please visit the NPP web site at http://daac.ornl.gov/NPP/npp_home.html.
Links to Supplemental Information:
Curlin, J.W., and D.J. Nelson. 1968. Walker Branch Watershed project: Objectives, facilities, and ecological characteristics. ORNL/TM-2271. Oak Ridge National Laboratory, Oak Ridge, TN.
http://daac.ornl.gov/daacdata/npp/temperate_forest/comp/WBW_Curlin_Nelson_TM2271.pdf
Olson, R.J., K.R. Johnson, D.L. Zheng, and J.M.O. Scurlock. 2001.
Global and Regional Ecosystem Modeling: Databases of Model Drivers and Validation
Measurements. ORNL Technical Memorandum TM-2001/196. Oak Ridge National Laboratory,
Oak Ridge, Tennessee, U.S.A.
Additional site ancillary data for the Walker Branch Watershed are available on the FLUXNET project web site: http://fluxnet.ornl.gov/. Investigators collected data on site vegetation, soil, hydrologic, and meteorological characteristics at the flux tower sites.
More information can also be found at the ORNL Walker Branch Watershed Web site: http://walkerbranch.ornl.gov/
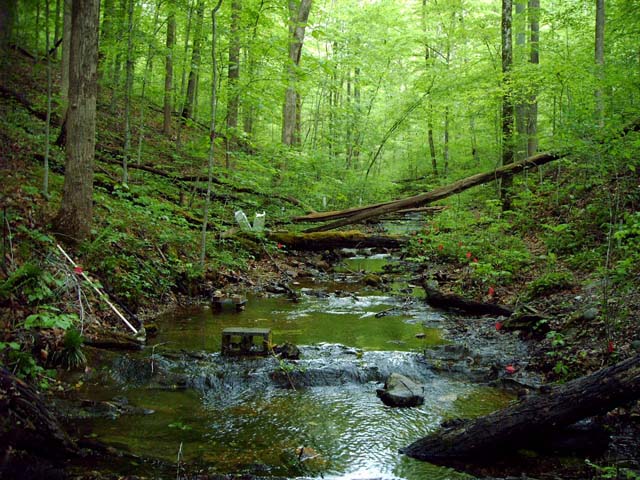
Figure 1. Spring Canopy Closure Above Stream (Photograph taken by B. J. Roberts on 20050427 as part of a series which presents a time sequence of spring leaf out along the West Fork from 30 March to 27 April 2005. Additional photographs can be found at the ORNL Walker Branch Watershed Web site: http://walkerbranch.ornl.gov) (photos_leafout_progression_20050427.jpg)
Data Citation:
Cite this data set as follows:
Huston, M.A., D.W. Johnson, D.E. Todd, J.W. Curlin, and F.W. Harris. 2013. Walker Branch Watershed Vegetation Inventory, 1967-2006, R1. Data set. Available on-line [http://daac.ornl.gov] from Oak Ridge National Laboratory Distributed Active Archive Center, Oak Ridge, Tennessee, USA. doi:10.3334/ORNLDAAC/819.
This data set was originally published as:
Huston, M.A., D.W. Johnson, D.E. Todd, J.W. Curlin, and F.W. Harris. 2005. Walker Branch Watershed Vegetation Inventory, 1967-1997. Data set. Available on-line [http://daac.ornl.gov] from Oak Ridge National Laboratory Distributed Active Archive Center, Oak Ridge, Tennessee, U.S.A.
Table of Contents:
- 1 Data Set Overview
- 2 Data Description
- 3 Applications and Derivation
- 4 Quality Assessment
- 5 Acquisition Materials and Methods
- 6 Data Access
- 7 References
1. Data Set Overview:
Project: Net Primary Productivity (NPP)
The original objectives of the long-term vegetation survey of the Walker Branch Watershed in eastern Tennessee (WBW; Curlin and Nelson, 1968) was to quantify the standing crop of vegetation through time including measures of tree/plant size distribution, species composition, above-ground biomass, and chemical balance. Field studies of permanent vegetation plots using one sampling design were conducted over a 40-year period (1967 to 2006), and observations continue with funding from the U.S. Department of Energy, Office of Science, Biological and Environmental Research.
This data set consists of long-term measurements of diameter at breast height (DBH) determined on randomly located permanent inventory plots within the 4 different vegetation types (oak-hickory, pine-oak-hickory, pine, and mesophytic hardwoods) located in the WBW. There is one file containing the entire inventory and three files containing subsets of the complete inventory. A separate file contains the WBW field plot species names, the numeric species code for each species, a species group designation, the scientific name for each species, and literature-derived lignin to nitrogen content in leaves (g lignin/g N of leaf tissue) for species present in the WBW.
2. Data Description:
This data set contains five comma-separated (.csv) data files derived from the WBW vegetation inventory in eastern Tennessee. The inventory was conducted using one sampling design on the same permanent vegetation plots at three to nine year intervals from 1967 to 2006. One file contains the complete set of inventory records (139,806 observations). Each record contains plot number, tree ID tag number, numeric species code, species name, species group, year of measurement, DBH, and tree status. The complete inventory is split into three subset files for spreadsheet import. A separate file contains the WBW field plot vegetation species list with species names, numeric species code for each species, a species group designation, scientific name for each species, and literature-derived ratio of g lignin/g N for each species leaves.
Spatial Coverage
Site: Walker Branch, Tennessee, USA
Site Boundaries:(All latitude and longitude given in decimal degrees)
| Site (Region) | Westernmost Longitude | Easternmost Longitude | Northernmost Latitude | Southernmost Latitude | Elevation (m) |
|---|---|---|---|---|---|
| Walker Branch, Tennessee, USA | -84.3 | -84.3 | 35.90 | 35.90 | 265-351 |
Site Information
The 97.5 ha WBW is located on the U. S. Department of Energy's Oak Ridge Reservation near Oak Ridge, in Anderson County, Tennessee. Walker Branch drains into an embayment of the Tennessee Valley Authority's Melton Hill Reservoir which was formed by the impoundment of the Clinch River. The outlet of Walker Branch is 33 miles above the confluence of the Clinch and Tennessee Rivers.
The watershed consists of two subcatchments, the West Fork being 38.4 ha and the East Fork 59.1 ha. The catchment basin is bounded on the north by Chestnut Ridge which reaches an elevation of 350.5 m and slopes rapidly southward to an elevation of 265 m in the valley at the confluence of the two forks.
The climate is typical of the humid southern Appalachian region. The forest soils are acidic, very cherty, infertile, and permeable. They are formed over dolomitic bedrock, but retain little evidence of their carbonate parent material.
The overstory forest vegetation is primarily an oak-hickory association with lesser amounts of pine-oak-hickory and pure pine associations present. Small areas of mesophytic hardwoods are found in sheltered coves and stream valleys. Prior to 1942, 44% of area within the West Fork watershed was cleared for agriculture (primarily pasture) while only 13% was cleared on the East Fork watershed. Since acquisition of the Oak Ridge Reservation in 1942, the area has been virtually undisturbed except for pine beetle infestation. Natural plant succession has restored these areas to well-stocked forest conditions.
The percentage distribution of area in oak-hickory and mesophytic hardwood forest types are similar on both watersheds. The East Fork subwatershed contains a much larger percentage of pine-oak-hickory type while the West Fork watershed contains more pine type. The West Fork subwatershed has a larger area classified as open because of a southern pine beetle (Dendroctonus frontalis) control operation in 1965 which removed the overstory vegetation. This area is now in an initial stage of succession. The southern pine beetle epidemic was also responsible for conversion of a moderate acreage of pine and pine-hardwood type to low density, short stand-height mesophytic hardwoods and oak-hickory on the East Fork subwatershed.
The Walker Branch watershed has been the site of long-term, intensive environmental studies since the late-1960's by staff from the Environmental Sciences Division at Oak Ridge National Laboratory (ORNL), staff from the Atmospheric Turbulence and Diffusion Division, Air Resources Laboratory, National Oceanic and Atmospheric Administration, and many visiting university researchers.
Spatial Resolution
The watershed is 97.5 ha in size. A total of 306 concentric circular plots were established in the study area, 123 plots in the West Fork subwatershed and 183 plots in the East Fork subwatershed. A nested concentric plot design was used to permit sampling of the various tree diameter classes with approximately the same precision (Figure 2). Since the number of stems per unit area is proportional to stem diameter, sample plot area is directly proportional to stem diameter so that trees greater than or equal to 24 .4 cm (9.6 in) DBH (diameter at breast height) were sampled on 0.81 ha (0.2 acres) while stems less than or equal to 12.7 mm (0.5 in) DBH were sampled on 0.004 ha (0.001 acre). Stems in other size classes were sampled on intermediate size plots. Each woody stem greater than or equal to 15.24 mm (0.6 in) DBH was assigned a number and tagged at 1.37 m (4.5 feet) above the ground. Diameter and species were recorded on forms for subsequent computer processing and tabulation. Tree height was measured in 1967. In that year, stems less than or equal to 12.7 mm (0.5 in) were recorded by frequency within 0.6-m (2-ft) height classes by species.
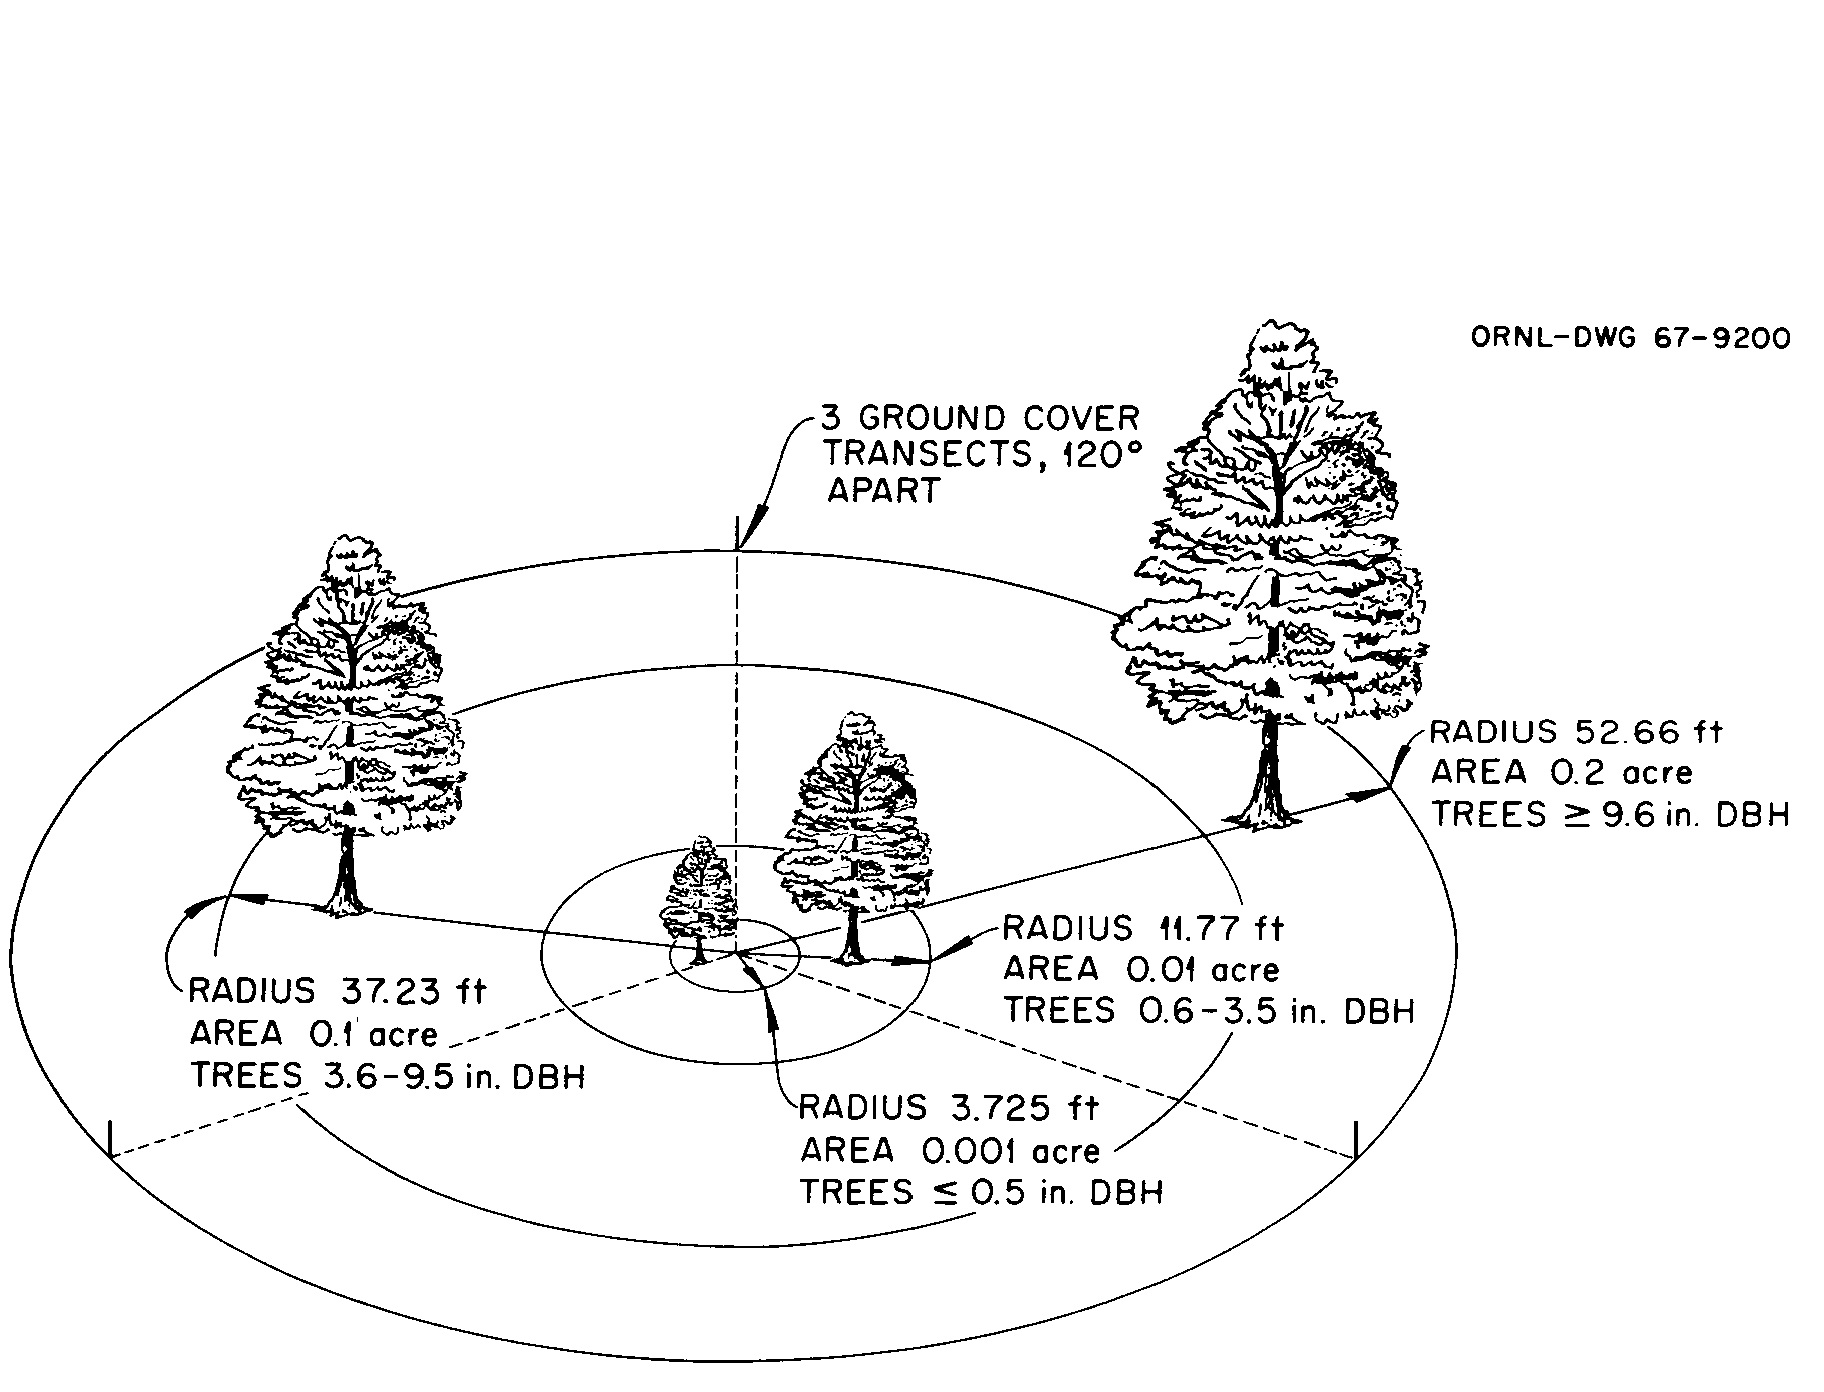
Figure 2. Sample plot configuration (from Curlin and Nelson, 1968).
Temporal Coverage
Measurements of DBH were taken in 1967, 1970, 1973, 1979, 1983, 1987, 1991, 1997, and 2006. Not all plots were measured every census year.
Temporal Resolution
Annual at three to nine year intervals, but not all plots were measured every census year.
Data File Information
The WBW vegetation inventory data are provided in four .csv files.
Table 1.
| FILE NAME | TEMPORAL COVERAGE | FILE CONTENTS |
|---|---|---|
| WBW_veg_inventory all_20100629.csv | 1967/01/01 - 2006/12/31 | Complete set of inventory records (139,806 observations) |
| WBW_veg_inv_1_100_20100629.csv | 1967/01/01 - 2006/12/31 | Inventory records subset by plot for spreadsheet import (records 1-100; (52,110 observations) |
| WBW_veg_inv_101_200_20100629.csv | 1967/01/01 - 2006/12/31 | Inventory records subset by plot for spreadsheet import (records 101-200; (48,231 observations) |
| WBW_veg_inv_201_298_20100629.csv | 1967/01/01 - 2006/12/31 | Inventory records subset by plot for spreadsheet import (records 201-298; (39,465 observations) |
| WBW_veg_species_2006.csv | 1967/01/01 - 2006/12/31 | Vegetation species in WBW inventory plots |
Vegetation Inventory Data File Description. The WBW vegetation inventory data are provided in four ASCII files, in comma-separated-value format. One file, WBW_veg_inventory all_20100629.csv, contains the complete set of inventory records (139,806 observations representing 15,534 / inventory year, 9 inventories). Number of observations with non-zero or non-missing DBH values is 66,581. To accommodate spreadsheet use, the complete inventory was split into three files: WBW_veg_inv_1_100_20100629.csv (52,110 observations); WBW_veg_inv_101_200_20100629.csv (48,231 observations); WBW_veg_inv_201_298_20100629.csv (39,465 observations).
Table 2. Vegetation inventory data file structure, column descriptions, and possible values
| Column Name | Description | Range of Values | Missing Value |
|---|---|---|---|
| PLOT | ID number of field sampling plot | 1-298 | none |
| TAG | ID tag number attached to individual vegetation stem within a plot | 0-9996 (not continuous) | -999 |
| CODE | Numeric vegetation species code | 1-103, 700, 800, 900 | 800 Unknown 999 Missing |
| SPECIES | Vegetation species name | Character values | Unknown Missing |
| YEAR | Measurement year (YYYY) | 1967, 1970, 1973, 1979, 1983, 1987, 1991, 1997, 2006 | none |
| DBH | Diameter (cm) at breast height (1.3 meters above the ground) | 0.0-102.9 | -999 |
| STATUS | Status code of tagged individual | 0 =
live 1 = standing dead 2 = dead on ground 9999 = missing Merged Stem STATUS Values: · 3xxx = stems merged, measurements for TAG xxx continue · 4yyy = stems merged, measurements for TAG yyy end; record contains missing values hereafter New ID TAG STATUS Values: · 5zzz = Previous TAG lost; data transferred to new TAG number zzz |
-999 |
Discussion of Vegetation Inventory Data:
Missing DBH Data:
Data can be missing for several reasons.
• The plot was not sampled that year, so the DBH was not measured.
• Plot was sampled, but that tree was missed.
• Since trees of STATUS 1 and 2 are not measured, a value of zero was sometimes assigned. A value of zero is obviously not a real value, any more than a value of -999.
Trees with STATUS=1 and STATUS=2:
Note that after trees die, there still needs to be an entry in that record, so all the trees will have the same number of entries. Since trees of STATUS 1 and 2 were not measured, there is no true diameter for them. However, they are not actually missing since they were observed. Unfortunately, there may be differences between years in how the diameters for such trees were entered. One should interpret the trees with a DBH of zero as observed but not measured, and the DBH of -999 as not observed (for any one of several reasons mentioned above) and therefore not measured.
There may be some inconsistency with the use of STATUS = 2, since once a tree falls it will be dead and decomposing on the ground for several years. The value of this STATUS is in recording the approximate length of time a dead tree remains standing. The first entry of STATUS = 2 is the critical one, since it marks the first time the tree was observed not to be standing. One may assume that for all subsequent inventories the tree will also be dead on the ground. Although this information is not particularly useful, it is true, and the tree is not actually missing, but we know it’s dead and on the ground.
There appears to have been a change in the way 'standing dead' (STATUS=1) and 'dead on the ground' (STATUS=2) trees were identified in 1997. In previous years these two classes were a small proportion of the total recorded and were listed as STATUS = missing (-999). In 1997, there are many dead trees listed with DBH of zero.
For analyses, treat DBH = 0 and -999 as equivalent, and use the STATUS to determine if the tree is dead or alive. Ultimately, all trees end up as STATUS 2.
Adding a Tree:
Each stem has an inventory record that starts in 1967 and continues through 2006. Any tree that entered the inventory after 1967 will have a record that should list missing DBH data from the 1967 inventory until the time it was first measured.
A tree added in 2006 was given a complete record (all missing) back to 1967. Therefore, each tree (TAG) has the same number of records and each year’s inventory has the same number of observations – currently 15,534.
Merged Stem STATUS Example:
TAG=27 and STATUS=3028: This indicates that the stem with TAG number “27” has merged with the stem with TAG number “28”. TAG 27 will continue to be measured.
TAG=28 and STATUS=4027: This indicates that the stem with TAG number “28” will no longer be measured and the record will contain missing values hereafter. DBH is -999 and STATUS is -999.
| PLOT TAG CODE SPECIES YEAR DBH STATUS 27 27 25 White Oak 1967 6.2 0 27 27 25 White Oak 1970 6.4 0 27 27 25 White Oak 1973 6.9 0 27 27 25 White Oak 1979 12.7 3028 27 27 25 White Oak 1983 13.1 0 27 27 25 White Oak 1987 13.7 0 27 27 25 White Oak 1991 13.9 0 27 27 25 White Oak 1997 15 0 27 28 25 White Oak 1967 6.5 0 27 28 25 White Oak 1970 6.6 0 27 28 25 White Oak 1973 7.1 0 27 28 25 White Oak 1979 -999 4027 27 28 25 White Oak 1983 -999 -999 27 28 25 White Oak 1987 -999 -999 27 28 25 White Oak 1991 -999 -999 27 28 25 White Oak 1997 -999 -999 |
New ID TAG STATUS Example:
TAG=79 and STATUS=5121 indicates that the ID tag number “79” was lost. The stem has been assigned a new TAG of 121. The complete measurement record has been transferred to TAG =121. DBH and STATUS for TAG = 79 have all been set to missing.
| PLOT TAG CODE SPECIES YEAR DBH STATUS 288 79 34 Red Maple 1967 -999 -999 288 79 34 Red Maple 1970 -999 -999 288 79 34 Red Maple 1973 -999 -999 288 79 34 Red Maple 1979 -999 -999 288 79 34 Red Maple 1983 -999 -999 288 79 34 Red Maple 1987 -999 -999 288 79 34 Red Maple 1991 -999 -999 288 79 34 Red Maple 1997 -999 5121 288 121 34 Red Maple 1967 -999 -999 288 121 34 Red Maple 1970 5.1 0 288 121 34 Red Maple 1973 5.8 0 288 121 34 Red Maple 1979 -999 -999 288 121 34 Red Maple 1983 -999 -999 288 121 34 Red Maple 1987 -999 -999 288 121 34 Red Maple 1991 8.7 0 288 121 34 Red Maple 1997 9.5 0 |
Sample Data Records:
Selected data records from WBW_veg_inv_1_100_20100629.csv data file:
| PLOT,TAG,CODE,SPECIES,YEAR,DBH,STATUS 1,1,3,Virginia Pine,Pinus,1967,36.8,0 1,1,3,Virginia Pine,Pinus,1970,-999.0,-999 1,1,3,Virginia Pine,Pinus,1973,-999.0,-999 1,1,3,Virginia Pine,Pinus,1979,40.4,0 1,1,3,Virginia Pine,Pinus,1983,42.2,0 1,1,3,Virginia Pine,Pinus,1987,-999.0,-999 1,1,3,Virginia Pine,Pinus,1991,43.9,0 1,1,3,Virginia Pine,Pinus,1997,46.5,0 1,1,3,Virginia Pine,Pinus,2006,0.0,1 1,2,2,Shortleaf Pine,Pinus,1967,26.2,0 … 100,864,34,Red Maple,Acer,2006,9.4,0 100,865,34,Red Maple,Acer,1967,-999.0, 100,865,34,Red Maple,Acer,1970,-999.0, 100,865,34,Red Maple,Acer,1973,-999.0, 100,865,34,Red Maple,Acer,1979,-999.0, 100,865,34,Red Maple,Acer,1983,-999.0, 100,865,34,Red Maple,Acer,1987,-999.0, 100,865,34,Red Maple,Acer,1991,-999.0, 100,865,34,Red Maple,Acer,1997,-999.0, 100,865,34,Red Maple,Acer,2006,10.4,0 |
Vegetation Species Data File Description. A separate file, WBW_veg_species_2006.csv, contains the WBW field plot species names, the numeric species code for each species, a species group designation, the scientific name for each species, along with the literature-derived ratio of g lignin / g N for each species leaves.
Vegetation Species (common names listed in alphabetical order). DBH measurements were made on 65 different species.
| Ailanthus Apple Aralia Ash Basswood Beech Black Cherry Black Gum Black Jack Oak Black Locust Black Oak Black Walnut Black Willow Blueberry Box Elder Buckeye Buckthorn |
Chestnut Chestnut Oak Cucumber Magnolia Dogwood E. Red Cedar Elm Euonymus Hazelnut Hemlock Hickory Hornbeam (Carpinus) Huckleberry Hydrangea Ironwood (Ostrya) Laurel Loblolly Pine Magnolia spp |
Missing Mulberry Northern Red Oak Oak Species Paulonia Persimmon Plum Post Oak Red Maple Redbud Sassafras Scarlet Oak Serviceberry Shortleaf Pine Shumard Oak Silverbell Sourwood |
Southern Red Oak Spicebush Sugar Maple Sumac Sweet Gum Sweetbay Magnolia Sycamore Tulip Poplar Unknown Virginia Pine White Oak White Pine Winged Elm Witch Haze |
Sample Data Record from WBW_veg_species_2006.csv data file:
| Species Code Species Name Species Group Leaf Lignin / N Ratio
Scientific Name CODE,SPECIES,SPCGRP,Leaf_Lignin_N_Ratio,Scientific_Name 1,Loblolly Pine,Pinus,50,Pinus taeda L. 2,Shortleaf Pine,Pinus,63,Pinus echinata Mill. 3,Virginia Pine,Pinus,63,Pinus virginiana Mill. 4,White Pine,Pinus,50,Pinus strobus L. 5,E. Red Cedar,Juniperus,63,Juniperus virginiana L. 6,Hemlock,Misc.,25,Eastern Hemlock (Tsuga canadensis (L.) Carr.) 7,Black Oak,Quercus,29,Quercus velutina Lam. 9,Northern Red Oak,Quercus,29,Quercus rubra L. 10,Shumard Oak,Quercus,29,Quercus shumardii Buckl. … … … 92,Hydrangea,Misc.,12,Hydrangea arborescens L. 93,Euonymus,Misc.,12,Euonymus atropurpureas Jacq. 95,Sumac,Misc.,12,Rhus glabra L. 96,Huckleberry,Misc.,12,Gaylussacia spp. 99,Hazelnut,Misc.,12,Corylus americana Walt. 102,Laurel,Misc.,35,Kalmia latifolia L. 103,Aralia,Misc.,12,Aralia spinosa L. 700,Oak Species,Quercus,30,Quercus spp. 800,Unknown,Misc.,12, 999,Missing,Misc.,12, |
3. Data Application and Derivation:
The WBW Project began in 1967 under sponsorship of the U. S. Atomic Energy Commission (now the U. S. Department of Energy). Initially, the project centered primarily on the geologic and hydrologic processes that control the amounts and chemistry of water moving through the watershed.
Past projects have included, among others:
- the International Biological Program Eastern Deciduous Forest Biome Project;
- U. S. Department of Energy funded studies of watershed hydrology and forest nutrient dynamics;
- National Oceanic and Atmospheric Administration funded studies of forest micrometeorology;
- studies of atmospheric deposition under the National Atmospheric Deposition Program;
- Electric Power Research Institute funded studies of the effects of acidic deposition on canopy processes and soil chemistry;
- National Science Foundation sponsored studies of trace element cycling, stream nutrient spiraling, and stream nitrogen cycling using 15N additions; and
- U. S. Department of Energy funded projects on forest responses to changing precipitation regimes.
These projects have all contributed to a more complete understanding of how forest watersheds function and have provided insights into the solution of energy-related problems associated with air pollution, contaminant transport, and forest nutrient dynamics. This is one of a few sites in the world characterized by long-term, intensive environmental studies.
4. Quality Assessment:
Data Processing:
A data file containing the 1997-2006 survey measurement data for field plots was obtained from the data custodian, Pat Mulholland, in February 2010. Files containing the 1967- 1997 survey data (previously archived as Huston et al., 2005) and the new 2006 survey data were read into SAS™ and quality checks performed.
Updates to Previous Survey Results:
All survey results were combined and exported to MSExcel™. All records were reviewed and updated using the complete set of field measurement forms as necessary. Processing notes were added to edited observations and this file is available for future reference. During the 2006 field work, particular attention was given to verifying measured tree species identification. This resulted in the correction of several misidentifications. As a result, 10 species were removed from the observed species list. These changes may impact all years of measurement results. It is possible that a tree first (mis) identified in 1967 has now been corrected and all measurements are now linked to a different species. Updates to 1997 measurement results were also made during the preparation of the 2006 data by the field team. The data custodian resolved several quality issues.
Additional quality assurance measures are described in Section 5 below and in Curlin and Nelson (1968).
5. Data Acquisition Materials and Methods:
A stratified random design with sample plots assigned to each overstory stratum in proportion to its area contribution was used as the basis for development of stand tables and species-frequency data. On the basis of variance estimates calculated from forest management data collected on Oak Ridge Reservation (Curlin and Nelson, 1968; Harris et al., 1973) plus practical considerations, it was determined that approximately 300 plots were needed to estimate the required stand information within plus/minus 15% on the watershed. The 38.4 ha West Fork subwatershed received 123 plots while the 59.1 ha East Fork received 183 plots.
Plots were assigned by a computer randomizing routine in conjunction with the forest cover map developed by MIACS (Amidon, 1964). The routine generated random numbers which were referenced to a two dimensional array in which the coded forest cover map was stored. If a sample was needed in the stratum covering the generated position, a plot was allocated, and the coordinates of the selected point were listed. This sequence was repeated on each subwatershed separately until the number of plots needed in each stratum was filled. Location of the plots superimposed over the cover map is shown in Figure 3. Sample plot allocation per stratum is listed in Table 3. Plots were not assigned to strata of less than 0.6 total acres.
Concentric circular plots were established at each sample point. Configuration, dimensions, and sampling criteria are shown in Figure 2. Plot radii were corrected for maximum slope at the sample point. Plot centers were marked with orange fluorescent stakes tagged with the grid coordinates of the sample point. The nested concentric plot design permits sampling of the various tree diameter classes with approximately the same precision. Since the number of stems per unit area is proportional to stem diameter, sample plot area is directly proportional to stem diameter so that trees greater than or equal to 9.6 in (24 .4 cm) DBH (diameter at breast height) were sampled on 0.2 acres (0.81 ha) while stems less than or equal to 0.5 in (12.7 mm) DBH were sampled on 0.001 acre (0.004 ha). Stems in other size classes were sampled on intermediate size plots. Each woody stem greater than or equal to 0.6 in DBH was assigned a number and tagged at 4.5 feet above the ground (DBH). Diameter and species were recorded on forms for subsequent computer processing and tabulation. Tree height was measured in 1967. In that year, stems less than or equal to 0.5 in are recorded by frequency within 2-ft height classes by species.
Understory vegetation was inventoried on radial line point transects spaced 120 degrees apart. Each transect was the length of the 0.2 acre plot radius and marked by aluminum stakes on the plot perimeter. The transects were inventoried by stretching a nylon cord marked at one foot intervals between plot center and the perimeter stake. At each interval, a point observation was taken and species occurrence was recorded. Percentage occurrence based on 159 potential strikes per plot was computed by species for each stratum.
Measurements of DBH were taken in 1967, 1970, 1973, 1979, 1983, 1987, 1991, 1997, and 2006. Not all plots were measured every year.
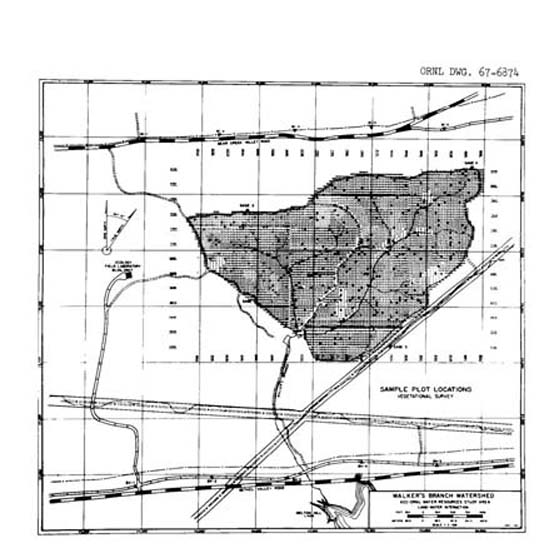
Figure 3. Sample plot locations superimposed on forest cover map (Curlin and Nelson, 1968).
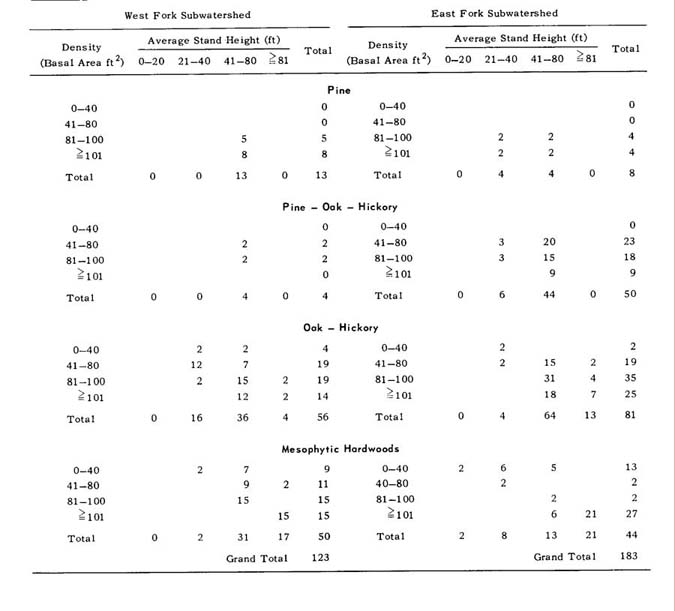
Table 3. Number of sample points allocated in each stratum (from Curlin and Nelson 1968).
6. Data Access:
This data set is available through the Oak Ridge National Laboratory (ORNL) Distributed Active Archive Center (DAAC).
Data Archive:
Web Site: http://daac.ornl.gov
Contact for Data Center Access Information:
E-mail: uso@daac.ornl.gov
Telephone: +1 (865) 241-3952
7. References:
Curlin, J. W., and D. J. Nelson. 1968. Walker Branch Watershed project: Objectives, facilities, and ecological characteristics. ORNL/TM-2271. Oak Ridge National Laboratory, Oak Ridge, TN.
Olson, R.J., K.R. Johnson, D.L. Zheng, and J.M.O. Scurlock. 2001. Global and Regional Ecosystem Modeling: Databases of Model Drivers and Validation Measurements. ORNL Technical Memorandum TM-2001/196. Oak Ridge National Laboratory, Oak Ridge, Tennessee, U.S.A.
Additional Sources of Information:
Amidon, Elliot L. 1964. A computer-oriented system for assembling and displaying land management information, U.S. Forest Service Research Paper PSW-17.
DeAngelis, D.L., R.H. Gardner, and H.H. Shugart. 1997. NPP Multi-Biome: Global IBP Woodlands Data, 1955-1975. Data set. Available on-line [http://daac.ornl.gov] from Oak Ridge National Laboratory Distributed Active Archive Center, Oak Ridge, Tennessee, U.S.A. doi:10.3334/ORNLDAAC/198
Esser, G. 1998. NPP Multi-Biome: Global Osnabruck Data, 1937-1981. Data set. Available on-line [http://daac.ornl.gov] from Oak Ridge National Laboratory Distributed Active Archive Center, Oak Ridge, Tennessee, U.S.A. doi:10.3334/ORNLDAAC/214
Harris, W.F., R.A. Goldstein, and G.S. Henderson. 1973. Analysis of forest biomass pools,annual primary production, and turnover of biomass for a mixed deciduous forest watershed. P. 41-64. IN: H. Young, IUFRO biomass studies, mensuration, growth, and yield. University of Maine Press, Orono.
Huston, M.A., D.W. Johnson, D.E. Todd, J.W. Curlin, and F.W. Harris. 2005. Walker Branch Watershed Vegetation Inventory, 1967-1997. Data set. Available on-line [http://daac.ornl.gov] from Oak Ridge National Laboratory Distributed Active Archive Center, Oak Ridge, Tennessee, U.S.A.
Huston M.A., D.E. Todd, and D.G. Barlar. 2003. Long-term forest dynamics and tree growth at the TDE site on Walker Branch Watershed, pp. 417-432. In: Hanson, P.J., and S.D. Wullschleger (eds.). North American Temperate Deciduous Forest Responses to Changing Precipitation Regimes. Springer, New York.
Johnson, D. W., G. S. Henderson, and W. F. Harris. 1987. Changes in aboveground biomass and nutrient content on Walker Branch Watershed from 1967 to 1983, pp. 487-496. In: Hay, (R.L., F.W. Woods, and H. DeSelm (eds.). Sixth Central Hardwood Forest Conference, University of Tennessee Press, Knoxville, Tennessee.
Johnson, D. W., R. J. Olson, L. K. Mann, and D. E. Todd. 1989. Changes in forest biomass and nutrient distribution in Walker Branch Watershed from 1967 to 1987, pp. 122-136. In: Gessel, S.P., D.S. La Cate, G.F. Weetman, and R.F. Powers (eds.). Sustained Productivity of Forest Soils. Proceedings, Seventh North American Forest Soils Conference, July 25-28, 1988, Vancouver, B.C. University of British Columbia, Vancouver, B.C.
Kardol, P., D.E.Todd, P.J. Hanson, and P.J. Mulholland. 2010. Long-term successional forest dynamics: species and community responses to climatic variability. Journal of Vegetation Science 21: 627-642.
Olson, R.J., J.M.O. Scurlock, S.D. Prince, D.L. Zheng, and K.R. Johnson (eds.). 2012a. NPP Multi-Biome: Global Primary Production Data Initiative Products, R2. Data set. Available on-line [http://daac.ornl.gov] from the Oak Ridge National Laboratory Distributed Active Archive Center, Oak Ridge, Tennessee, U.S.A. doi:10.3334/ORNLDAAC/617
Olson, R.J., J.M.O. Scurlock, S.D. Prince, D.L. Zheng, and K.R. Johnson (eds.). 2012b. NPP Multi-Biome: NPP and Driver Data for Ecosystem Model-Data Intercomparison, R2. Data set. Available on-line [http://daac.ornl.gov] from the Oak Ridge National Laboratory Distributed Active Archive Center, Oak Ridge, Tennessee, U.S.A. doi:10.3334/ORNLDAAC/615