Get Data
Summary:
This data set includes five ASCII files (.txt format). Three files contain above- and below-ground biomass and net primary productivity (NPP) data, one file for each tropical forest study site near San Carlos de Rio Negro, Venezuela. The study sites are located along an ecosystem gradient from riverine to lateritic hill: Tall Amazon Caatinga forest on coarse sandy spodosols close to river level; Bana vegetation on sandy soils less prone to flooding; and Tierra Firme mixed forest on clay oxisols of higher ground. Bioelement concentrations are also provided. The other two files contain climate data from a weather station in San Carlos village.
ANPP for the Tierra Firme forest is estimated at 1,590 g/m2/year, including woody biomass increment of 600 g/m2/year, and BNPP values in the range of 201-1,117 g/m2/year, suggesting a minimum estimate of TNPP of 1,800-2,700 g/m2/year. ANPP of a nearby cut-and-burned oxisol plot attained 1,940 g/m2 in the fifth year following clearing. ANPP of Tall Amazon Caatinga is estimated at 1,150 g/m2/year, with root turnover of 120 g/m2/year, giving a minimum estimate of TNPP of 1,270 g/m2/year. TNPP estimate for Bana vegetation, based on annual litterfall accumulation plus root production, is 478 g/m2/year.
Revision Notes: The NPP files for San Carlos have been revised to replace previously missing values, add additional root data, and add additional primary references. Leaf litter nutrient values for the Tall Amazon Caatinga forest, and LAI, litter accumulation, and dead wood biomass data for the Bana forest were also added. Please see the Data Set Revisions section of this document for detailed information.
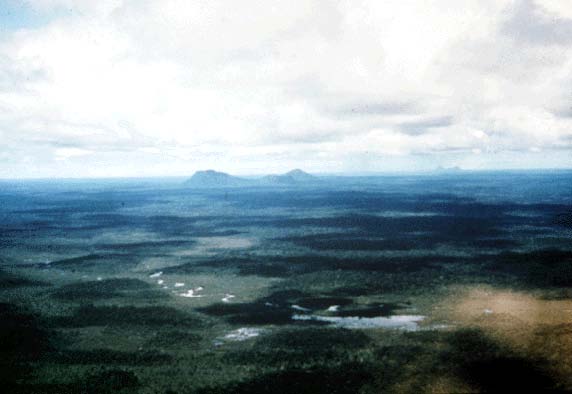
Figure 1. Aerial view of the terrain near the San Carlos de Rio Negro tropical forest site, Venezuela. (Patches of dark green are caused by distinctive vegetation on Oxisol hills which contrasts with the lighter caatinga vegetation between the hills. Photograph reproduced by kind permission of Prof. C.F. Jordan, University of Georgia, U.S.A.). (SCR2-1.jpg)
Additional Documentation:
The Net Primary Productivity (NPP) data collection contains field measurements of biomass, estimated NPP, and climate data for terrestrial grassland, tropical forest, boreal forest, and tundra sites worldwide. Data were compiled from the published literature for intensively studied and well-documented individual field sites and from a number of previously compiled multi-site, multi-biome data sets of georeferenced NPP estimates. The principal compilation effort (Olson et al., 2001) was sponsored by the NASA Terrestrial Ecology Program. For more information, please visit the NPP web site at http://daac.ornl.gov/NPP/npp_home.html.
Data Citation:
Cite this data set as follows:
Jordan, C.F., E. Cuevas, and E. Medina. 2013. NPP Tropical Forest: San Carlos de Rio Negro, Venezuela, 1975-1984, R1. Data set. Available on-line [http://daac.ornl.gov] from Oak Ridge National Laboratory Distributed Active Archive Center, Oak Ridge, Tennessee, U.S.A. doi:10.3334/ORNLDAAC/479 .
This data set was originally published as:
Jordan, C.F., E. Cuevas, and E. Medina. 1999. NPP Tropical Forest: San Carlos de Rio Negro, Venezuela, 1970-1971. Data set. Available on-line [http://daac.ornl.gov] from Oak Ridge National Laboratory Distributed Active Archive Center, Oak Ridge, Tennessee, U.S.A.
Table of Contents:
- 1 Data Set Overview
- 2 Data Description
- 3 Applications and Derivation
- 4 Quality Assessment
- 5 Acquisition Materials and Methods
- 6 Data Access
- 7 References
- 8 Data Set Revisions
1. Data Set Overview:
Project: Net Primary Productivity (NPP)
The study area is a moist tropical forest near the confluence of the Casiquiare River and the Rio Negro in the Amazon Territory of Venezuela where well-differentiated vegetation-soil associations occur along a topological gradient from gently rolling hills (< 40 m) to the surrounding lowlands and floodplains. The data set presented here contains biomass dynamics, nutrient flux, and NPP component data for three San Carlos study sites located along this forest sequence.
For the non-flooded mixed forest on oxisols (Tierra Firme forest), a minimum total NPP estimate is based on field measurements of total annual litterfall accumulation + increase in woody biomass increment + a partial determinations of below-ground NPP (root biomass increment and root production). For the nutrient-poor, less flood-prone forest on spodosols (Tall Amazon Caatinga forest), a minimum NPP estimate is based on field measurements of annual leaf and branch litterfall accumulation + increase in branch and trunk biomass increment + root production. For the low Bana forest, where there is frequent alternation of flooded and dry periods, a minimum NPP estimate is based on field measurements of annual litterfall accumulation (leaf + wood + fruit/flower) plus root production. Other field data presented in the data files, where measured, include stand height, average basal area, above- and below-ground biomass, LAI, litter decomposition rates, and nutrient concentrations in live vegetation (above- and below-ground) and in litterfall components. These studies were conducted at the Tierra Firme and Bana sites from 1975 to 1984, and at the Tall Caatinga site from 1975 to 1983.
Two ASCII files containing climate data are also provided in this data set. Monthly and annual precipitation amount, average temperature, and maximum/minimum temperature (and their mean values) are derived from measurements at a weather station in San Carlos village over several time periods (1950-1958, 1970-1978, 1975-1981, and 1950-1991).
ANPP, BNPP, and TNPP values for San Carlos are also reported in Olson et al. (2012a, b), Scurlock and Olson (2012), and Clark et al. (2001a, b). Some of these values differ from the values presented herein due to different calculation methods (Table 1).
Table 1. ANPP, BNPP, and TNPP values reported by various published data sources
| File Name or Description | Data Source(s) | Sub-Site | ANPP | BNPP | TNPP |
|---|---|---|---|---|---|
| gC/m2/year | |||||
| scr1_npp_r1.txt | Jordan (1989)1
|
scr oxisol (tierra firme)
|
795 | 340 | 1,125 |
| scr2_npp_r1.txt | scr spodosol (tall caatinga)
|
575 | 60 | 635 |
|
| scr3_npp_r1.txt | scr bana
|
NA | NA | 239 |
|
NPP_Multibiome_EnvReview | Scurlock and Olson (2012) based on Jordan (1989) |
scr oxisol |
795 | 559 | 1,354 |
| GPPDI_ClassA_NPP_162_R2.csv | Olson et al. (2012a); Clark et al. (2001a)2 based on Jordan (1989) |
Class A Site 33 (MI 36) (not identified but probably oxisol)
|
577 | 402 | 979
|
Olson et al. (2012a);Clark et al. (2001a)2 based on Klinge and Herrera (1983), Jordan and Herrera (1981) |
Class A Site 34 (MI 37) (spodosol)
|
522 | 364 | 886
|
|
| EMDI_ClassA_NPP_81_R2.csv | Olson et al. (2012b); Clark et al. (2001a)2 based on Jordan (1989) |
Class A Site 33 (av. of two sites from GPPDI) |
500 | 383 | 933 |
| Table 1 in Clark et al. (2001a) | Clark et al. (2001a)2 based on Jordan (1989), Klinge and Herrera (1983), and Jordan and Herrera (1981)
|
San Carlos (oxisol) |
580 | 120-690 (av 405) | 690-1,270 (av 980) |
San Carlos (tall caatinga - spodosol) |
520 | 100-630 (av 365) | 630-1,150 (av 890) |
||
| Appendix A in Clark et al. (2001a) | Raich et al. (1991) |
Lowland mixed "tierra firme" forests with predominantly evergreen or weakly seasonal species |
NA | NA | 1,310 |
Alvarez-Sanchez (1991) based on Jordan and Escalante (1980) |
620 | NA | NA |
||
Clark et al. (2001a)2 |
NA | NA | 690-1,270 (av 980) |
||
| tropfornapp.csv | Clark et al. (2001b)3 based on Jordan (1989)1
|
Venezuela - San Carlos (Oxisol) |
682 |
NA |
NA |
| Clark et al. (2001b)3 based on Klinge and Herrera 1983, Herrera and Jordan 1981 |
Venezuela-San Carlos tall caatinga |
298 |
NA |
NA |
|
Notes: NA = Not available. MI = Measurement ID number in GPPDI files. The differences in NPP values reported in this table are mainly due to differences in calculation methods, as explained in these notes. Please consult original references for details. Revised data sets (R1, R2, etc) are accompanied by ORNL DAAC Data Set Change Information files. Please see the corresponding documentation for reasons why the data values were revised. 1For this table, NPP data from the original data source were converted from grams of dry weight per meter square per year to grams of carbon per meter square per year using a conversion factor of 0.5. The NPP estimates are based on field measurement. See above paragraph for measurement components. 2Clark et al. (2001a) used a different approach to calculate net primary production values. ANPP was calculated by summing reported above-ground biomass increment + reported fine litterfall + estimated losses to consumers + estimated VOC emissions. BNPP was calculated by summing 0.2 x estimated ANPP for a low BNPP estimate + 1.2 x estimated ANPP for a high BNPP estimate. TNPP was calculated as the range between the low and high values of ANPP + BNPP. Average BNPP and TNPP estimates were also calculated. See Clark et al. (2001a) for a discussion of calculation methods, including how unmeasured components of ANPP were estimated and the basis for setting bounds on BNPP. 3ANPP estimate is the sum of litterfall + branch fall + above-ground biomass increment.
2. Data Description:
Spatial Coverage
Site: San Carlos De Rio Negro, Venezuela
Site Boundaries: (All latitude and longitude given in decimal degrees)
| Site (Region) | Westernmost Longitude | Easternmost Longitude | Northernmost Latitude | Southernmost Latitude | Elevation (m) |
|---|---|---|---|---|---|
| San Carlos De Rio Negro, Venezuela | -67.05 | -67.05 | 1.93 | 1.93 | 117-122 |
Site Information
The San Carlos study area (1.93 N 67.05 W) is situated near the confluence of the Casiquiare River and the Rio Negro in the Amazon Territory of Venezuela. It is about 4 km east of the village of San Carlos, 1,000 km south of Caracas, and close to the common border between Venezuela, Colombia, and Brazil. Annual rainfall is relatively high at 3,565 mm (based on the 1950-1981 time series in this data set). In spite of the high monthly rainfall, a clear seasonality in phenological behavior of the dominant tree species has been observed (Cuevas and Medina, 1986). Although the area is very remote and apparently free from anthropogenic disturbance, there is some evidence of burning around the year 1750.
The study area is classified as humid tropical forest (Bailey ecoregion #423). As is typical for much of the central part of the Amazon Basin, the soils near San Carlos are very low in nutrients as a result of both intensive leaching under humid tropical conditions for millions of years, and the lack of unweathered parent material as a source of nutrients. The terrain is gently rolling, with hills up to 40 m higher than the surrounding lowland. The hills and valleys are a reflection of the surface of underlying granitic bedrock. On the top of the hills, where the clay formed from the granite is exposed at or near the soil surface, the soils are classified as oxisol. The soils in the areas between the hills is comprised of coarse sands or spodosols.
The study area consists of three sub-sites representing three well-differentiated soil types along the topological gradient in San Carlos:
- Tierra Firme mixed forest on the clay oxisols of the higher ground is characterized by species of Apocynaceae (Aspidosperma spp.), Burseracease (Protium spp.), Caryocaraceae (Caryocar spp.), Chrysobalanaceae (Licania spp.), legumes (Swartzia spp.), Moraceae (Eschweilera spp.), Palmae (Jessenia bataua, Iryanthera sp.), and Vochysiaceae (Vochysia spp.);
- Tall Amazon Caatinga forest complex on the coarse sandy spodosols between the rolling hills close to river level is characterized by highly sclerophyllous species which show particular change in tree density and species dominance along subtle changes in relief and drainage. The canopy trees have a medium stature and relatively small maximum diameter. Characteristic species include Eperua leucantha, Glycoxylon inophyllum, Hevea spp., Manilkara sp., and Micrandra spruycei;
- Bana or "low Amazon caatinga" on sandy soils less prone to shallow flooding has a low tree and shrub layer characterized by Mauritia carana (a palm), Aspidosperma album, Clusia spp., and several species of Bombacaeae (Rodognaphalopsis spp., Catostemma spp.), Rubiaceae (Calycophyllum obovatum, Remigia involucrata, Retiniphyllum spp.), and Melastomataceae (Mouriri uncitheca). The open-structured and stunted vegetation is represented by low above-ground biomass, while the composite root mass is, relative to the above-ground biomass, extremely high. During heavy rains, the soil becomes soaked with water. Since the drainage is good due to both the topographical position and the sandy nature of the soil, the soil is rapidly drained after rainfall ceases and may even become exposed to drought.
An idealized transect (Figure 2) shows variation in soils as a function of topography and how vegetation is correlated with topography, soil, and water table. In the forests on the oxisol hills, species diversity is high and there is no strong dominance of any one species. The height diameter of the trees and biomass of the forest is not particularly large. On the sides of the hills on ultisols, the trees are taller and larger in diameter, but the diversity is low and often just one or a few species are dominant.
The vegetation occurring on the spodosols depends primarily on the depth of the water table. Where the water table is deepest, a very reduced vegetation or 'bana' occurs. With decreasing depth of the water table along the transect, bana grades into intermediate vegetation, sometimes called campina or low caatinga, and then into high caatinga. The caatinga of the Rio Negro region is called 'Amazon caatinga' to distinguish it from the caatinga of the arid region of northeastern Brazil. Amazon caatinga forests resemble the so-called heath forests, Kerangas, of Southeastern Asia.
The climate of San Carlos de Rio Negro is humid tropical with mean annual rainfall of 3,565 mm and mean annual temperature of 26 C (based on the mean values for 1950-1958 and 1970-1978 time periods in this data set). A less rainy season (200-300 mm per month) lasts from July to March, while the real rainy season is characterized by 300-500 mm rain per month. The climate data in this data set are from a government weather station in the village of San Carlos.
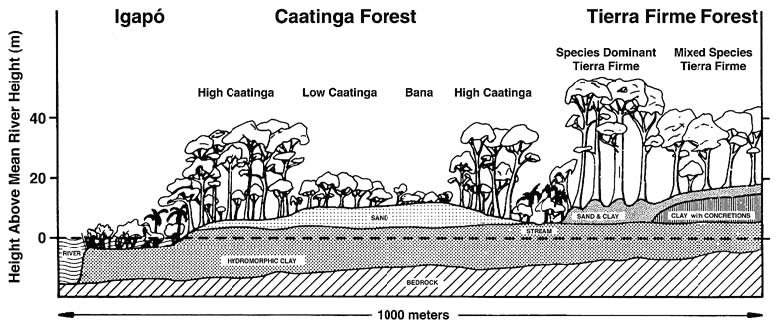
Figure 2. Idealized transect along a gradient from river to lateritic hill. The igapo forest on the banks of the Rio Negro on the left is flooded for part of the year. Where coarse sand has been deposited, caatinga forest occurs with shallow water table and bana occurs with deeper water table. Where bedrock forms hills, as towards the right of the diagram, granite grades into clay which comprises the subsoil. In places, the clay reaches the surface, but at the study site it was covered with a shallow layer of fine sand. On the shoulders of the hills, there sometimes occurs a mixture of fine sand and clay which supports a forest dominated by one or a few species. Figure reproduced by kind permission of Dr. C.F. Jordan, UNESCO and the Parthenon Publishing Group. (SCRD-1.jpg)
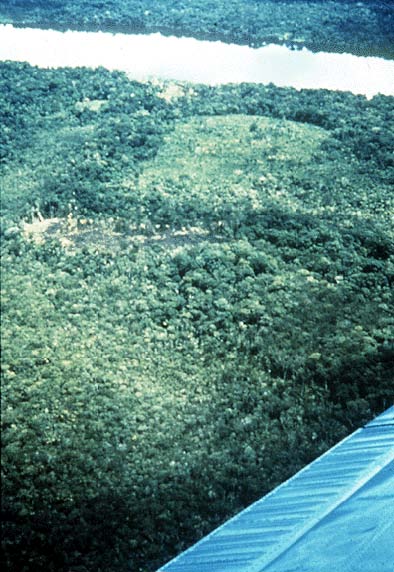
Figure 3. Aerial view of the terrain near the San Carlos de Rio Negro tropical forest site, Venezuela. (A recently abandoned agricultural site is visible near the river, and a recently cut and burned site near the center of the photograph. Both sites are on an Oxisol hill. A lower area, supporting caatinga forest on Spodosol, lies to the left and bottom of the picture. Photograph reproduced by kind permission of Prof. C.F. Jordan, University of Georgia, USA). (SCR3-1.jpg)
Spatial Resolution
The Tierra Firme study area was approximately 1 ha in size. The Tall Amazon Caatinga study area was 10 ha in size (200 x 500 m). The Bana study areas ranged from 0.9 to 18 ha in size. See Table 2 for details about study plots.
Table 2. Spatial resolution of the study plots at San Carlos, by parameter
SITE |
ABOVE-GROUND BIOMASS |
BELOW- GROUND BIOMASS |
LITTERFALL |
LITTER |
NUTRIENTS | LITTER DECOMP (k) | LAI |
| Tierra Firme (oxisol) | 1 ha with 5 x 20 m "control" plots1, 2 | 0.25 sq. m to 40-50 cm depth3, 8; 10 cm x 7.5 cm diameter ingrowth cylinders4; 25 x 25 cm pits to 50 cm depth16 | Ten 0.5 sq. m baskets5; forty-three 32.5 cm x 37.7 cm baskets8 | Ten 0.5 sq. m baskets5 | Ten 0.5 sq. m litter baskets5; samples of plant biomass8
|
20 x 20 cm mesh bags randomly placed over 30 x 30 m area4 | 50-100 leaves from each felled tree in "experiment" plot analyzed for weight-area relationship6 |
| Tall Amazon Caatinga (spodosol) | 10 ha with ten 10 x 10 m inventory and harvest plots7, 15 | 10 cm x 7.5 cm diameter ingrowth cylinders4; 0.25 sq. m (50 x 50 cm monolith) down to water table depth in 10 plots7; 25 x 25 cm pits to 50 cm depth16 | Ten 0.5 sq. m baskets5; forty-three 32.5 cm x 37.7 cm baskets8 | 50 x 50 cm areas7 | 10 cm x 7.5 cm diameter ingrowth cylinders4, 13 | 20 x 20 cm mesh bags randomly placed over 30 x 30 m area4 | Within each of the thirteen 100 sq. m plots7 |
| Bana (tall, low, and open) | 18 ha with seven 5 x 5 m harvest plots9, 10; 1 ha inventory plot11; 0.9 ha with three 10 x 10 m inventory and harvest plots7, 15 | 10 cm x 7.5 cm diameter ingrowth cylinders4; 0.25 sq. m soil pits, one on raised ground and one in a depression, on seven plots9, 10; 0.25 sq. m area at 3 harvest plots7, 15; 25 x 25 cm pits to 50 cm depth16 | Ten 0.5 sq. m baskets5 | Two to five 0.25 sq. m sample areas on each of nine plots9, 12 | Ten 0.5 sq. m baskets5, 13 |
20 x 20 cm mesh bags randomly placed over 30 x 30 m area4 |
Within each of the seven 25 sq. m plots9, 10 |
Notes: 1Uhl and Jordan (1984). 2Jordan (1984). 3Stark and Spratt (1977). 4Cuevas and Medina (1988). 5Cuevas and Medina (1986). 6Jordan and Uhl (1978). 7Klinge and Herrera (1978; 1983). 8Jordan (1989). 9Bongers et al. (1985). 10From two plots in Tall Bana, three in Low Bana, and two in Open Bana. 11Veillon (pers. comm. in Klinge and Herrera (1983). 12From two in Tall Bana, five in Low Bana, and two in Open Bana. 13Medina and Cuevas (1989). 14Three replicates per species, per treatment, and per collection. See Methods section for details. 15Klinge and Herrera (1978). 16Sanford (1989).
Temporal Coverage
NPP measurements were made at the Tierra Firme and Bana study sites from 1975 to 1984, and at the Tall Caatinga site from 1975 to 1983. See Table 3 for details.
Climate data are available for several time periods, from 1950 through 1992.
Table 3. Temporal coverage of the studies at San Carlos, by parameter
SITE |
ABOVE- GROUND BIOMASS |
BELOW-GROUND BIOMASS |
LITTERFALL |
LITTER |
NUTRIENTS | LITTER DECOMP (k) | LAI |
| Tierra Firme (oxisol) | 19751 |
19753, 8 |
57 weeks, 09/1980-09/19815; monthly average, 1975-19808 | 57 weeks, 09/1980-09/19815 | 09/1980-01/1981 & 05/1981-08/19814; 09/1975-07/19838; 1984(?)11 | 09/1980-01/1981 & 05/1981-08/19814 | 19756 |
| Tall Amazon Caatinga (spodosol) | 1975(?)7, 13; 1975-198112; 1981-198312 | 1975(?)7, 13; 09/1980-01/1981 & 05/1981-08/19814 | Monthly average, 1975-19808 | Prior to phytomass harvest (1975)7 | 09/1980-01/1981 & 05/1981-08/19814 | 09/1980-01/1981 & 05/1981-08/19814 | 1975(?)7 |
| Bana (tall, low, and open) | 1975(?)7, 13; 03/1978-04/19789, 10 | 1975(?)7, 13; 09/1980-01/19814; 03/1978-04/19789 | 57 weeks, 09/1980-09/19815 | Prior to phytomass harvest (1978)9 | 09/1980-01/19814; 1983-1984(?)11 |
09/1980-01/19814 |
19789 |
Notes: 1Uhl and Jordan (1984). 2Jordan (1984). 3Stark and Spratt (1977). 4Cuevas and Medina (1988). 5Cuevas and Medina (1986). 6Jordan and Uhl (1978). 7Klinge & Herrera (1983). 8Jordan (1989). 9Bongers et al. (1985). 10Veillon (pers. comm. in Klinge and Herrera (1983). 11Medina and Cuevas (1989). 12Jordan (1989). 13Klinge and Herrera (1978).
Temporal Resolution
NPP measurements were made on different occasions at each study location (see Table 4). All NPP estimates are based on plant dry matter accumulation, expressed as g/m2/year (dry matter weight).
Climate data are expressed as mean monthly and annual precipitation amounts (mm), mean monthly and annual average temperature (C), and mean monthly and annual maximum/minimum temperature (C) for various time periods.
Table 4. Temporal resolution of the studies at San Carlos, by parameter
SITE |
ABOVE- GROUND BIOMASS |
BELOW GROUND BIOMASS |
LITTER-FALL |
LITTER |
NUTRIENTS | LITTER DECOMP (k) | LAI |
| Tierra Firme (oxisol) | Once1, 12; Four times2 | Once3; Two experiments (samples collected every 30 days)4 | Weekly5 | Weekly5 | Two experiments (samples collected every 30 days)4; once8 | Analyzed at 14, 32, 71, 132, 242, and 482 days4 | Once6 |
| Tall Amazon Caatinga (spodosol) | Once7, 12 | Once7, 12; Two experiments (samples collected every 30 days)4 | Monthly8 | Once7 | Two experiments (samples collected every 30 days)4; Once7, 11 | Analyzed at 14, 32, 71, 132, 242, and 482 days4 | Once7 |
| Bana (tall, low, and open) | Once9, 10, 12 | Once7, 12; One experiment (samples collected every 30 days)4; Once9 | Weekly5 | Once9 | One experiment (samples collected every 30 days)4 |
Analyzed at 14, 32, 71, 132, 242, and 482 days4 |
Once9 |
Notes: 1Uhl and Jordan (1984). 2Jordan (1984). 3Stark and Spratt (1977). 4Cuevas and Medina (1988). 5Cuevas and Medina (1986). 6Jordan and Uhl (1978). 7Klinge & Herrera (1983). 8Jordan (1989). 9Bongers et al. (1985). 10Veillon (pers. comm. in Klinge and Herrera (1983). 11Medina and Cuevas (1989). 12Klinge and Herrera (1978).
Data File Information
Table 5. Data files in this data set archive
FILE NAME |
FILE SIZE |
TEMPORAL COVERAGE | FILE CONTENTS |
scr1_npp_r1.txt |
10.2 KB |
1975/01/01-1984/12/31 | NPP data for Tierra Firme (oxisol) forest at San Carlos, Venezuela |
scr2_npp_r1.txt |
5.0 KB |
1975/01/01-1983/12/31 | NPP data for Tall Amazon Caatinga (spodosol) forest at San Carlos, Venezuela |
scr3_npp_r1.txt |
3.7 KB |
1975/01/01-1984/12/31 | NPP data for tall, low, and open Bana at San Carlos, Venezuela |
scr1_cli.txt |
2.2 KB |
1950/01/01-1981/12/31 | Mean monthly and annual precipitation amount and mean monthly and annual average temperature data from weather station in San Carlos village, Venezuela |
scr2_cli.txt |
1.5 KB |
1951/01/01-1992/12/31 | Mean values for precipitation amount, maximum/minimum temperature, and average temperature for different time periods from weather station in San Carlos village, Venezuela |
NPP Data. NPP estimates for the San Carlos site are provided in three ASCII text files (Table 5), one for each sub-site. The variable values are delimited by semi-colons. The first 18 lines are metadata; data records begin on line 19. The value -999.9 is used to denote missing values. Biomass and NPP units are in g/m2 and g/m2/year (dry matter weight), respectively.
Table 6. Column headings in NPP files
COLUMN HEADINGS |
DEFINITION |
UNITS |
Site |
Site where data were gathered (code refers to site identification) | Text |
Treatmt |
Study area (sub-site) or forest subsystem type where measurements were made: oxisol = Tierra Firme; spodosol = Tall Caatinga; bana = tall bana, low bana, or open bana, as indicated in References / comments column | Text |
Year |
Year in which data were collected | Numeric |
Month |
Month in which data were collected | Numeric |
Day |
Day on which data were collected | Numeric |
parameter |
Parameters measured (see definitions in Tables 6, 7, and 8) | Text |
amount |
Data values | Numeric |
| units | Unit of measure | Text |
| References / comments | Primary and secondary references plus explanatory comments | Text |
Table 7. Parameter definitions in <scr1_npp_r1.txt> (Tierra Firme Oxisol Forest)
PARAMETER |
DEFINITION |
UNITS |
SOURCE |
height |
Forest canopy height | cm |
average from various sources |
leaves |
Predicted leaf biomass | g/m2 |
Table 2.2, Jordan (1989) |
leaves |
Leaf biomass in "control" plot1 | g/m2 |
Table 6, Uhl & Jordan (1984) |
branches_+_trunks |
Wood and bark biomass in "control" plot1 | g/m2 |
Table 6, Uhl & Jordan (1984) |
AGbiomass |
Above-ground biomass in "control" plot (sum of leaf plus stem biomass)1 | g/m2 |
Uhl & Jordan (1984), by addition |
AGbiomass |
Above-ground biomass ("control" plot) | g/m2 |
Table 2.2 & Table C.2.4, Jordan (1989) |
AGbiomass |
Above-ground biomass, mixed tierra firme forest ("experimental" plot before cutting in slash-and-burn experiment) | g/m2 |
Table 2.2 & Table C.2.4, Jordan (1989) |
AGbiomass |
Above-ground biomass ("control" plot) OVERESTIMATE, later revised | g/m2 |
Jordan & Uhl (1978) |
AGbiomass |
Above-ground biomass ("control" plot) OVERESTIMATE, later revised | g/m2 |
Jordan & Uhl (1978) |
Totlitter |
Total fine litter biomass | g/m2 |
Table 6, Uhl & Jordan (1984) |
deadwood |
Dead wood biomass | g/m2 |
Table 6, Uhl & Jordan (1984) |
Totroots |
Pre-burn forest total root biomass [sum of below-ground root mass measured in a nearby mature forest (Stark and Spratt, 1977) + above-ground root mass measured in the intensive "experimental" study site (C. F. Jordan, pers. comm.)] | g/m2 |
Table 6, Uhl & Jordan (1984) |
Totroots |
Below-ground root biomass, including roots in both sand and clay horizons | g/m2 |
Stark & Spratt (1977) |
Totroots |
Total root biomass in nearby undisturbed oxisol forest (sum of humus and root mass + "Horizon 2" root mass + "Horizon 3" root mass) | g/m2 |
Stark & Spratt (1977), Table C.2.3, Jordan (1989) |
Totroots |
Total root biomass in "control" plot (sum of above-ground root mass + below-ground root mass) | g/m2 |
Table C.2.1, Jordan (1989) |
Totroots |
Total root biomass (sum of surface root mass + below-ground root mass to 50 cm depth) | g/m2 |
Table 2, Sanford (1989) |
LAI |
Leaf area index | m2/m2 |
Jordan & Uhl (1978); Putz (1983) |
LAI |
Leaf area index | m2/m2 |
Table 2.2, Jordan (1989) |
leaflitter_C/N |
Biomass carbon/nitrogen ratio of leaf litterfall (biomass = 50% carbon) | g/g |
Table 2.2, Jordan (1989) |
leaflitter_C/P |
Biomass carbon/phosphorus ratio of leaf litterfall (biomass = 50% carbon) | g/g |
Table 2.2, Jordan (1989) |
leaflitter-N |
Nitrogen concentration in freshly fallen leaf litter; values are averages of ten collection periods (every 3 weeks) with 15 baskets per collection (Cuevas, 1983) | percent |
Table 9, Medina & Cuevas (1989); Cuevas & Medina (1986) |
leaflitter-P |
Phosphorus concentration in freshly fallen leaf litter; values are averages of ten collection periods (every 3 weeks) with 15 baskets per collection (Cuevas, 1983) | percent |
Table 9, Medina & Cuevas (1989); Cuevas & Medina (1986) |
leaflittfall |
Average leaf litterfall rate | g/m2/year |
P. G. Murphy (pers. comm.) in Jordan and Escalante (1980) |
woodlittfall |
Average wood litterfall rate | g/m2/year |
P. G. Murphy (pers. comm). in Jordan and Escalante (1980) |
leaflittfall |
Annual leaf litter production | g/m2/year |
Table 1, Cuevas & Medina (1986) |
woodlittfall |
Annual small wood litter production | g/m2/year |
Table 1, Cuevas & Medina (1986) |
flofrtlittfall |
Annual flower + fruit litter production | g/m2/year |
Table 1, Cuevas & Medina (1986) |
Totlittfall |
Total annual litter production | g/m2/year |
Table 1, Cuevas & Medina (1986) |
leaflittfall |
Average monthly fall of leaves and of twigs < 1 cm diameter | g/m2/month |
Table C.3.2, Jordan (1989) |
leaflittfall |
Net annual leaf and twig (< 1 cm) litter production | g/m2/year |
Table 2.6, Jordan (1989) |
trunk_+_branch_incr |
Net annual stem and branch production | g/m2/year |
Table 2.6, Jordan (1989) |
roots_incr |
Annual root growth in the surficial mat and in mineral soil | g/m2/year |
Jordan and Escalante (1980); Table 2.6, Jordan (1989) |
root_production |
Annual fine root production in litter and superficial soil layers (in ingrowth cylinders to 10 cm depth) | g/m2/year |
Table 9, Cuevas & Medina (1988) |
leaflittfall |
Annual leaf litter production in "control" site (during the one year pre-cultivation period) | g/m2/year |
Table 5.1, Jordan (1989) |
trunk_+_branch_incr |
Net annual stem and branch production in "control" site (during the one year pre-cultivation period) | g/m2/year |
Table 2.6, Jordan (1989) |
Total_NPP |
Net annual primary production in "control" site (during the one year pre-cultivation period; NPP value does not include net root production of 201.0 g/m2/year, which was measured only once during pre-cultivation period | g/m2/year |
Table 2.6, Jordan (1989) |
leaflittfall |
Annual leaf litter production in "control" site (during the first year of cultivation period) | g/m2/year |
Table 5.1, Jordan (1989) |
trunk_+_branch_incr |
Net annual stem and branch production in "control" site (during the first year of cultivation period) | g/m2/year |
Table 5.1, Jordan (1989) |
Total_NPP |
Net annual primary production in "control" site (during the first year of cultivation period; NPP value does not include net root production) | g/m2/year |
Table 5.1, Jordan (1989) |
leaflittfall |
Annual leaf litter production in "control" site (during the second year of cultivation period) | g/m2/year |
Table 5.1, Jordan (1989) |
trunk_+_branch_incr |
Net annual stem and branch production in "control" site (during the second year of cultivation period) | g/m2/year |
Table 5.1, Jordan (1989) |
Total_NPP |
Net annual primary production in "control" site (during the second year of cultivation period; NPP value does not include net root production) | g/m2/year |
Table 5.1, Jordan (1989) |
leaflittfall |
Annual leaf litter production in "control" site (during the third year of cultivation period) | g/m2/year |
Table 5.1, Jordan (1989) |
trunk_+_branch_incr |
Net annual stem and branch production in "control" site (during the third year of cultivation period) | g/m2/year |
Table 5.1, Jordan (1989) |
Total_NPP |
Net annual primary production in "control" site (during the third year of cultivation period; NPP value does not include net root production) | g/m2/year |
Table 5.1, Jordan (1989) |
trunk_+_branch_incr |
Net annual stem and branch production in "control" site (during the first year of post-cultivation period) | g/m2/year |
Table 6.1, Jordan (1989) |
trunk_+_branch_incr |
Net annual stem and branch production in "control" site (during the second and third year of post-cultivation period; wood production for these years us the average over the period) | g/m2/year |
Table 6.1, Jordan (1989) |
leaflittfall |
Annual leaf litterfall production | g/m2/year |
Table 10, Medina & Cuevas (1989)2 |
branchlittfall |
Annual stem + branch litterfall production | g/m2/year |
Table 10, Medina & Cuevas (1989)2 |
trunk_+_branch_incr |
Annual wood increment | g/m2/year |
Table 10, Medina & Cuevas (1989)2 |
ANPP |
Above-ground net primary production | g/m2/year |
summed from Table 10, Medina & Cuevas (1989), above |
leaflittfall-N |
Nitrogen concentration in freshly fallen leaf litter; values are averages of ten collection periods (every 3 weeks) with 15 baskets per collection (Cuevas, 1983) | percent |
Table 9, Medina & Cuevas (1989) |
leaves-N |
Nitrogen concentration in leaves | percent |
Table 6, Uhl & Jordan (1984); Table 7, Medina & Cuevas (1989) |
leaves-N |
Nitrogen concentration in leaves of felled trees | percent |
Table 6, Uhl & Jordan (1984); Table C.5.1, Jordan (1989) |
branches_+_trunks-N |
Nitrogen concentration in tree branches and trunks (including bark), as a percent of dry stem biomass (wood + bark) | percent |
Table 6, Uhl & Jordan (1984) |
Totlitter-N |
Nitrogen concentration in fine litter | percent |
Table 6, Uhl & Jordan (1984) |
deadwood-N |
Nitrogen concentration in dead tree trunks | percent |
Table 6, Uhl & Jordan (1984); Table C.5.1, Jordan (1989) |
Totroots-N |
Nitrogen concentration in roots of felled trees | percent |
Table 6, Uhl & Jordan (1984); Table C.5.1, Jordan (1989) |
fineroots-N |
Nitrogen concentration in fine roots grown in vermiculite-filled cylinders inserted in upper 10 cm of soil | percent |
Table 8, Medina & Cuevas (1989) |
leaflittfall-P |
Phosphorus concentration in freshly fallen leaf litter; values are averages of ten collection periods (every 3 weeks) with 15 baskets per collection (Cuevas, 1983) | percent |
Table 7, Medina & Cuevas (1989) |
leaves-P |
Phosphorus concentration in leaves of felled trees | ppm |
Table 7, Medina & Cuevas (1989) |
leaves-P |
Phosphorus concentration in leaves | ppm |
Table 6, Uhl & Jordan (1984); Table C.5.1, Jordan (1989) |
branches_+_trunks-P |
Phosphorus concentration in tree branches and trunks (including bark), as a proportion of dry stem biomass (wood + bark) | ppm |
Table 6, Uhl & Jordan (1984) |
Totlitter-P |
Phosphorus concentration in fine litter | ppm |
Table 6, Uhl & Jordan (1984) |
deadwood-P |
Phosphorus concentration in dead tree trunks | ppm |
Table 6, Uhl & Jordan (1984); Table C.5.1, Jordan (1989) |
Totroots-P |
Phosphorus concentration in roots of felled trees | percent |
Table 6, Uhl & Jordan (1984); Table C.5.1, Jordan (1989) |
fineroots-P |
Phosphorus concentration in fine roots grown in vermiculite-filled cylinders inserted in upper 10 cm of soil | percent |
Table 8, Medina & Cuevas (1989)3 |
N_fixation |
Nitrogen fixation | g/m2/year |
p. 232, Medina & Cuevas (1989)4 |
leaflitter_decomp_k |
Leaf litter decomposition constant | 1/year |
Table 2.2, Jordan (1989) |
litter_decomp_k |
Litter decomposition constant | 1/year |
Table 10, Cuevas & Medina (1988) |
litter_decomp_k |
Litter decomposition constant | 1/year |
Table 11, Medina & Cuevas (1989)5 |
Notes: 1Forest aboveground biomass values for this site, as reported in Jordan and Uhl (1978), were overestimated because of drying difficulties. Correct values from Table 6 of Uhl & Jordan (1984) are included in this data file. 2Jordan & Murphy (unpublished); Jordan & Uhl (1978); and Cuevas & Medina (1986). 3From Cuevas & Medina (unpublished). 4From Jordan et al. (1982). 5From Cuevas (1983).
Sample NPP Data Record <scr1_npp_r1.txt> (Tierra Firme Oxisol Forest)
Site; Treatmt; Year; Month; Day; parameter; amount; units; Reference/ comments scr; oxisol; 1975?; -999.9; -999.9; height; 3000; cm; average various |
Table 8. Parameter definitions in <scr2_npp_r1.txt> (Tall Amazon Caatinga)
PARAMETER |
DEFINITION |
UNITS |
SOURCE |
basal area |
Basal area of trees > 10 cm dbh in the vicinity of the study site | m2/ha |
J. P. Veillon, pers. comm. in Klinge & Herrera (1983) |
leaves |
Leaf biomass (standing crop of green foliage) | g/m2 |
Table 6, Klinge & Herrera (1978) |
leaves |
Leaf biomass (standing crop of green foliage) | g/m2 |
Table 2.2, Jordan (1989) |
leaves |
Leaf biomass (dry foliage, averaged for 13 plots) | g/m2 |
Table 13, Klinge & Herrera (1983) |
leaves |
Leaf biomass, eliminating outlier plots as suggested by authors | g/m2 |
Table 2, Medina & Cuevas, 1989)1 |
AGbiomass |
Above-ground biomass | g/m2 |
Table 2.2, Jordan (1989) |
AGbiomass |
Total above-ground living phytomass (dry matter, eliminating outlier plots as suggested by authors) | g/m2 |
Table 7, Klinge & Herrera (1983); Table 2, Medina & Cuevas (1989) |
AGbiomass |
Total above-ground living phytomass (dry matter, sum of components averaged for 13 plots)2 | g/m2 |
Tables 5, Klinge & Herrera (1983) |
totroots |
Composite root biomass (average of 13 plots, including 3 plots in Bana forest) | g/m2 |
p. 93, Klinge and Herrera (1978); Table 5, Klinge & Herrera (1983); Table 2.2, Jordan (1989) |
totroots |
Total root biomass (sum of surface root mass + below-ground root mass to 50 cm depth) | g/m2 |
Table 2, Sanford (1989) |
BGbiomass |
Total below-ground biomass (dry matter, eliminating outlier plots as suggested by authors | g/m2 |
Table 7, Klinge & Herrera (1983); Table 2, Medina & Cuevas, 1989) |
BGbiomass |
Total below-ground biomass (dry matter, sum of components averaged for 13 plots)3 | g/m2 |
Table 5, Klinge & Herrera (1983) |
Totbiomass |
Total living phytomass (dry matter, sum of above- and below-ground biomass averaged for 13 plots) | g/m2 |
Table 5, Klinge & Herrera (1983) |
LAI |
Average leaf area index of 13 plots | m2/m2 |
Table 13, Klinge & Herrera (1983) |
LAI |
Average leaf area index of 13 plots, eliminating outlier plots as suggested by authors | m2/m2 |
Table 2, Medina & Cuevas (1989) |
leaflitter_C/N |
Biomass carbon/nitrogen ratio of leaf litterfall (biomass = 50% carbon) | g/g |
Table 2.2, Jordan (1989) |
leaflitter_C/P |
Biomass carbon/phosphorus ratio of leaf litterfall (biomass = 50% carbon) | g/g |
Table 2.2, Jordan (1989) |
leaflitter-N |
Nitrogen concentration in leaf litterfall | percent |
Table 3, Cuevas and Medina (1986) |
leaflitter-P |
Phosphorus concentration in leaf litterfall | ppm |
Table 3, Cuevas and Medina (1986) |
leaflittfall |
Average monthly fall of leaves and of twigs < 1 cm diameter | g/m2/month |
Table C.3.2, Jordan (1989) |
leaflittfall |
Annual leaf litter production (1980-81) | g/m2/year |
Table 1, Cuevas & Medina (1986) |
woodlittfall |
Annual small wood litter production (1980-81) | g/m2/year |
Table 1, Cuevas & Medina (1986) |
flofrtlittfall |
Annual flower + fruit litter production (1980-81) | g/m2/year |
Table 1, Cuevas & Medina (1986) |
Totlittfall |
Total annual litter production (1980-81) | g/m2/year |
Table 1, Cuevas & Medina (1986) |
leaflittfall |
Net annual leaf and twig (< 1 cm) litter production (1976-78) | g/m2/year |
Table 2.6, Jordan (1989) |
leaflittfall |
Annual leaf litterfall production | g/m2/year |
Table 10, Medina & Cuevas (1989)4 |
branchfall |
Annual stem + branch litterfall production | g/m2/year |
Table 10, Medina & Cuevas (1989)4 |
trunk_+_branch_incr |
Annual wood increment | g/m2/year |
Table 10, Medina & Cuevas (1989)4 |
trunk_+_branch_incr |
Net annual stem + branch litter production | g/m2/year |
Table 2.6, Jordan (1989) |
ANPP |
Net annual above-ground production | g/m2/year |
Summed from Table 10, Medina & Cuevas (1989) |
root_production |
Annual fine root production in litter and superficial soil layers (in ingrowth cylinders to 10 cm depth) | g/m2/year |
Table 9, Cuevas & Medina (1988) |
stdead |
Standing dead wood, averaged for 13 plots | g/m2 |
Table 16, Klinge & Herrera (1983) |
bolelitt |
Bole wood litter on forest floor, averaged for 13 plots | g/m2 |
Table 16, Klinge & Herrera (1983) |
branchlitt |
Branch wood litter on forest floor, averaged for 13 plots | g/m2 |
Table 16, Klinge & Herrera (1983) |
twiglitt |
Twig wood litter on forest floor, averaged for 13 plots | g/m2 |
Table 16, Klinge & Herrera (1983) |
leaflitt |
Leaf litter on forest floor, averaged for 13 plots | g/m2 |
Table 16, Klinge & Herrera (1983) |
Totlitt |
Total dead above-ground phytomass (standing dead plus litter on forest floor), averaged for 13 plots | g/m2 |
Table 16, Klinge & Herrera (1983) |
finelittfall |
Annual fine litterfall accumulation | g/m2/year |
Medina et al. (1980) |
rawhumus |
Standing crop of raw humus to depths of 4-12 cm, averaged for 13 plots | kg/m2 |
Table 1, Klinge & Herrera (1978) |
fineroots-N |
Nitrogen concentration in fine roots grown in vermiculite-filled cylinders inserted in upper 10 cm of soil | percent |
Table 2, Cuevas & Medina (1988); Table 8, Medina & Cuevas (1989) |
fineroots-P |
Phosphorus concentration in fine roots grown in vermiculite-filled cylinders inserted in upper 10 cm of soil | ppm |
Table 2, Cuevas & Medina (1988); Table 8, Medina & Cuevas (1989) |
leaflitt_decomp_k |
Leaf litter decomposition constant | 1/year |
Table 2.2, Jordan (1989) |
litter_decomp_k |
Litter decomposition constant | 1/year |
Table 10, Cuevas & Medina (1988) |
Notes: 1Data from Klinge and Herrera (1983). 2The components of above-ground biomass include: trees (> 1 cm in dbh and < cm in dbh), climbers (> 1 cm in dbh and < cm in dbh), epiphytes, moss, and groundflora. 3The components of below-ground biomass include: composite root mass, tap roots of trees mainly between 1 and 5 cm in dbh, and roots of trees < 1 cm in dbh. 4Based on Herrera (1979).
Sample NPP Data Record <scr2_npp_r1.txt> (Tall Amazon Caatinga)
Site; Treatmt; Year; Month; Day; parameter; amount; units; Reference/ comments scr; caatinga; 1975; 05; 05; basal_area; 29.4; m2/ha; Veillon pers. comm. (05/05/1978) in Klinge and Herrera (1983) scr; spodosl; 1975; -999.9; -999.9; leaves; 1027; g/m2; Medina et al. (1978) |
Table 9. Parameter definitions in <scr3_npp_r1.txt> (Bana)
PARAMETER |
DEFINITION |
UNITS |
SOURCE |
basal area |
Basal area of trees > 10 cm dbh in the vicinity of the study site | m2/ha |
J. P. Veillon, pers. comm. in Klinge & Herrera (1983) |
AGbiomass |
Above-ground biomass | g/m2 |
Table 5, Klinge & Herrera (1978); Table C.2.4, Jordan (1989) |
AGbiomass |
Above-ground biomass (tall bana, mean of 2 plots; low bana, mean of 5 plots; and open bana, one plot) | g/m2 |
Table 3, Bongers et al. (1985); Table 2, Medina & Cuevas (1989) |
leaflitter |
Leaf litter biomass (tall bana, mean of 2 plots; low bana, mean of 5 plots; and open bana, one plot) | g/m2 |
Table 10, Bongers et al. (1985) |
woodlitter |
Wood litter biomass (tall bana, mean of 2 plots; low bana, mean of 5 plots; and open bana, one plot) | g/m2 |
Table 10, Bongers et al. (1985) |
Totlitter |
Total litter biomass (tall bana, mean of 2 plots; low bana, mean of 5 plots; and open bana, one plot) | g/m2 |
Table 10, Bongers et al. (1985) |
deadwood |
Standing dead wood biomass including stumps (tall bana, mean of 2 plots; low bana, mean of 5 plots; and open bana, one plot) | g/m2 |
Table 10, Bongers et al. (1985) |
Totroots |
Total composite below-ground root biomass (Ao + A1 + A2 horizons; without distinction of dead and alive roots and plant species involved) | g/m2 |
Table 3 (Plot XIII) and p. 103, Klinge & Herrera (1978); Table C.2.4, Jordan (1989) |
Totroots |
Below-ground root biomass, tall bana | g/m2 |
Table 2, Medina & Cuevas (1989) |
Totroots |
Below-ground root biomass, low bana | g/m2 |
Table 2, Medina & Cuevas (1989) |
Totroots |
Below-ground root biomass, open bana | g/m2 |
Table 2, Medina & Cuevas (1989) |
Totroots |
Total root biomass (sum of surface root mass + below-ground root mass to 50 cm depth) | g/m2 |
Table 2, Sanford (1989) |
LAI |
Leaf area index (LAI measured in tall, low, and open bana, and mean of 3 types) | m2/m2 |
Table 1, Bongers et al. (1985); Table 2, Medina & Cuevas (1989) |
leaflittfall |
Annual leaf litterfall | g/m2/year |
Table 1, Cuevas & Medina (1986) |
woodlittfall |
Annual small wood litterfall | g/m2/year |
Table 1, Cuevas & Medina (1986) |
flofrtlittfall |
Annual flower + fruit litterfall | g/m2/year |
Table 1, Cuevas & Medina (1986) |
Totlittfall |
Total annual litterfall | g/m2/year |
Table 1, Cuevas & Medina (1986) |
root_production |
Annual fine root production in litter + superficial soil layers (in ingrowth cylinders to 10 cm depth), low bana | g/m2/year |
Table 9, Cuevas & Medina (1988) |
leaves-N |
Nitrogen concentration in leaf litter | percent |
Table 3, Cuevas & Medina (1986) |
leaves-N |
Nitrogen concentration in leaves | percent |
Table 7, Medina & Cuevas (1989) |
leaflittfall-N |
Nitrogen concentration in freshly fallen leaf litter; values are averages of ten collection periods (every 3 weeks) from 15 baskets per collection (Cuevas, 1983) | percent |
Table 9, Medina & Cuevas (1989) |
leaves-P |
Phosphorus concentration in leaf litter | ppm |
Table 3, Cuevas & Medina (1986) |
leaves-P |
Phosphorus concentration in leaves | ppm |
Table 7, Medina & Cuevas (1989) |
leaflittfall-P |
Phosphorus concentration in freshly fallen leaf litter; values are averages of ten collection periods (every 3 weeks) from 15 baskets per collection (Cuevas, 1983) | ppm |
Table 9, Medina & Cuevas (1989) |
fineroots-N |
Nitrogen concentration in fine roots grown in vermiculite-filled cylinders inserted in upper 10 cm of soil | percent |
Table 2, Cuevas & Medina (1988); Table 8, Medina & Cuevas (1989) |
fineroots-P |
Phosphorus concentration in fine roots grown in vermiculite-filled cylinders inserted in upper 10 cm of soil | ppm |
Table 2, Cuevas & Medina (1988); Table 8, Medina & Cuevas (1989) |
litter_decomp_k |
Litter decomposition constant (range), low bana | 1/year |
Table 10, Cuevas & Medina (1988) |
Sample NPP Data Record <scr3_npp_r1.txt> (Bana)
Site; Treatmt; Year; Month; Day; parameter; amount; units; Reference/ comments scr; bana; -999.9; -999.9; -999.9; basal_area; 13.0; m2/ha; Veillon pers. comm. (05/05/1978) in Klinge and Herrera (1983) scr; bana; 1975; -999.9; -999.9; AGbiomass; 8500; g/m2; Klinge and Herrera (1978), Jordan (1989) p. 137 |
Climate Data. Climate data are provided in two ASCII files (.txt format). The first 18 lines are metadata; data records begin on line 19. The variable values are delimited by semi-colons. The value -999.9 is used to denote missing values.
Sample Climate Data Record <scr1_cli.txt>
Site;Temp;Parm; Jan; Feb; Mar; Apr; May; Jun; Jul; Aug; Sep; Oct; Nov; Dec; Year Where, |
Sample Climate Data Record <scr2_cli.txt>
Site;Temp;Parm; Jan; Feb; Mar; Apr; May; Jun; Jul; Aug; Sep; Oct; Nov; Dec; Year Where, N.B. precipitation data for 1951-58 are from a different weather station located at 1.90 N 67.07 W and elevation 65 m |
3. Data Application and Derivation:
The accumulation of biomass, or NPP, is the net gain of carbon by photosynthesis that remains after plant respiration. While there are many fates for this carbon, this data set accounts for a minimum estimate of NPP at each of three sites, mainly based on above-ground growth or litterfall, and below-ground root production. These are considered the major components of NPP.
Much of the research at San Carlos was conducted in order to fill gaps in ecological knowledge available to support forest management. To address these deficiencies, research projects were organized by the Center of Ecology at the Venezuelan Institute for Scientific Research (IVIC), with the participation of the Institute of Ecology of the University of Georgia (U.S.A.) and the Max-Planck Institute of Limnology (Germany), to study forest composition and structure, and nutrient cycling and conservation in Amazonian forests. Additional research was carried out under the auspices of an international UNESCO Man and the Biosphere (MAB) project.
The tropical forest biomass dynamics data for the San Carlos site are provided for comparison with models and estimation of NPP. Climate data are provided for use in driving ecosystem/NPP models.
4. Quality Assessment:
Comparisons of biomass estimations for the forests at San Carlos should take into account the fact that the methods of determining biomass are not the same in all cases. In mixed forests, estimations were based on regressions developed from felled trees in a size range class (Jordan and Uhl, 1978), while in caatinga and bana forests estimations were based on clear felling and weighing of plots of 100 m2 or less (Klinge and Herrera, 1983; Bongers et al., 1985).
The above- and below-ground biomass values for San Carlos caatinga and oxisol forests are compared by Jordan (1989) and Klinge & Herrera (1983) with the biomass estimates for other tropical evergreen forests. The relatively low above-ground biomass and the relatively high below-ground biomass of the San Carlos forests suggest that both the caatinga and oxisol forests are under greater stress than many other tropical forests. Lower biomass accumulation in these forests is probably related to the frequent alternation of flooded and dry periods in the Amazon caatinga, while nutrients seem to be the most important factor in the mixed forest (Medina and Cuevas, 1989).
The above- and below-ground biomass values for San Carlos tall caatinga and bana are compared to data for a seasonal evergreen rainforest and a campina at Manaus, a cloud forest in Venezuela, and the tierra firme forest at San Carlos (Klinge and Herrera, 1978). These four forests are richer in above-ground biomass on average than the Amazon caatinga and have relative root amounts below 20%. This value can be considered normal for tropical forests. The relative amount of root biomass in the Amazon caatinga ranges from 22-33% to as high as 45% in the intergrades between caatinga and bana. The bana has a strikingly higher root percentage which may reach over 60% (62% in Klinge and Herrera, 1978).
At the time of these studies, data for the phytomass of other tropical rainforests supported by spodosols was available only for a heath forest in Cambodia (Hozumi et al., 1969) where both above- and below-ground phytomass was lower than that measured at the Tall Amazon Caatinga site.
Sources of Error
Above-ground biomass data for Tierra Firma site from Jordan and Uhl (1978) were overestimated because of drying difficulties and later revised in Uhl and Jordan (1984). Correct values appear in this archived data set.
5. Data Acquisition Materials and Methods:
Tierra Firme (Oxisol) Forest
Above-ground Biomass and Production
- Algometric Regressions and Tree Biomass (Jordan and Uhl, 1978; Uhl and Jordan, 1984; Jordan, 1989; Saldarriaga, 1985). Forty-two trees were harvested, and leaf and wood biomass was measured and regressed on diameter squared times height times density of wood. Total biomass on a hectare basis was calculated by multiplying average biomass per size class calculated from the regression times the number of trees in each diameter-height-size class per hectare, and summing the products.
Above-ground biomass estimates in Jordan and Uhl (1978) were overestimated because of drying difficulties. That report gave a species-weighted wood density of 0.96. Since then, a corrected wood density value of 0.71 was calculated and the earlier estimates were revised (Uhl and Jordan, 1984; Jordan, 1989). The correct values appear in this data set along with the overestimates, for comparison.
- Control and Experimental Plot Biomass (Uhl and Jordan, 1984; Jordan, 1989). To obtain data on entire forest structure, two 1 ha study areas containing mature forest similar in species composition, height, and above-ground biomass were selected. One site was designated as a "control" plot for studies of nutrient input and output, tree growth, and litter accumulation; the other plot was designated "experimental" for experimental treatments and studies on secondary succession following forest cutting and burning. The control plot was used to determine if any variation in productivity or nutrient dynamics during cutting and cultivation of the experimental plot were attributed to variables external to the experiment. The total number of trees in each 5 cm diameter class for trees > 10 cm dia. was counted and their height estimated in the control, and the experimental plot before cutting. In the control and experimental plots, trees 5-10 cm dbh were measured over transects totaling 4,000 m2 and trees 1-5 cm dbh were measured over transects totaling 1,525 m2. Standing dead trees were counted separately. Putz (1983) determined liana biomass in the control forest.
- Above-ground Wood Production (Jordan, 1989).
- Single 1981-1983 Growth Increment. A method employing a diameter tape precisely positioned on the trees > 10 cm dia. was used for a single 1981-1983 growth increment interval. Diameter increment was converted to above-ground biomass increment using allometric equations which predict biomass as a function of diameter, height and wood density (Jordan and Uhl, 1978). Height increment was determined as a function of diameter increment using Uhl's (unpublished) data on the height and diameter of 1,123 trees on the Tierra Firme site.
- Four Year Growth Increment. The annual diameter of 120 trees on the Tierra Firme control plot (and 120 trees on the Tall Caatinga plot) were measured between 1975 and 1981 with a dendrometer for trees > 10 cm dia., and veneer calipers for trees < 10 cm dia.
- Leaf and Wood Litterfall (Jordan and Escalante, 1980). Annual leaf litterfall (=leaf sloughing, in source) was determined by sampling 42 litter traps monthly for 4 years. Annual wood litterfall (=sloughing of bark and branches, in source) was determined by sampling a 2 x 800 m transect quarterly for 3 years.
- Total Litterfall and Litterfall Nutrient Content (Cuevas and Medina, 1986; Medina and Cuevas, 1989). Ten 0.5 m wire mesh baskets 15 cm above the forest floor were distributed over 400 m2 plots in the Tierra Firme site (as well as in Tall Caatinga and Bana sites). Accumulated litter was collected weekly for a period of 57 weeks. Frequent collections were carried out in order to reduce nutrient losses due to leaching and decomposition in the basket. Collected litter was oven-dried at 60 C for a minimum of 5 days and later separated into leaves, flowers + fruits, and small wood fractions. Ten replicates of the leaf fraction per collection were analyzed for N, P, Ca, Mg, and K concentrations.
- Monthly and Annual Litterfall (Jordan, 1989). The rate of fall of leaves and of twigs < 1 cm dia. was determined from monthly collections in 42 plastic receptacles (32.5 cm x 37.7 cm x 20 cm deep) between 1975 and 1980 in the Tierra Firme (as well as in the Tall Caatinga site). The average monthly and annual dry weight leaf + twig litterfall accumulation is given in this data set.
- Leaf Litter (Jordan 1989; Medina and Cuevas, 1989). Dry mass of leaf and twig litter on the soil surface was estimated by collecting this material in six randomly located 0.25 m2 plots in the pre-burn experimental mature forest. Subsamples were taken from three plots for nutrient analysis.
- Litter and Deadwood (Uhl and Jordan, 1984). Litter biomass and dead wood biomass data are from the pre-burn experimental mature forest (C. F. Jordan, pers. comm.; subsequently published in Jordan, 1989). See Nutrients in Plant Biomass section.
- Leaf Area Index (Jordan and Uhl, 1978). In addition to the leaves collected for dry weight determinations, 50-100 leaves were taken at random from every tree and pressed for weight-area determinations. The pressed leaves were spread on top of light sensitive paper which was then exposed. The leaf images were then cut and the weight compared to an uncut sheet of paper of known area, and from this, leaf area was calculated.
Below-ground Biomass and Production
- Pre-burn Forest Root Biomass (Uhl and Jordan, 1984). Root biomass values are the sum of below-ground root mass measured in soil pits in the mature forest site (see Stark and Spratt, 1977 below) and above-ground root mass measured in the pre-burn "experimental" site (C. F. Jordan, pers. comm.; Jordan, 1989).
- Below-ground Root Biomass (including roots in both sand and clay horizons; Stark and Spratt, 1977). In order to not to disturb the Jordan (1989) control and experimental areas, Stark and Spratt (1977) studied root biomass on two additional half-hectare plots on two nearby oxisol hills. Roots located below 50 x 50 cm rigid quadrats (0.25 m2) were removed from 18 soil pits to the surface of the mineral soil, to the bottom of the sand layer, and to 40-50 cm depth into the oxisol. Each horizon was weighed wet in the field and subsampled for moisture content and fine roots. The roots and other organic matter were separated by hand and weighed separately. The root samples were air dried, shaken lightly to remove sand and clay, and then dried at around 100 C for 48 hours. The dried roots were re-weighed.
- Below-ground Root Biomass (Sanford, 1989). A 210 m N-S transect was set up in the intensive study forest area that Brunig et at. (1979) and Herrera (1979) used to delineate forest types and forest soil correlations. The transect begins in tierra firme forest, passes through caatinga forest and terminates in bana forest. At 10 m intervals along the transect 25 x 25 cm pits were excavated to 50 cm depth. The root mat (consisting of roots that grow above the mineral soil) was cut out with a knife and sorted separately. Roots in these forests tend to be concentrated near or above the surface of the mineral soil; hence the uppermost 5 cm of mineral soil was excavated by hand with machete and shovel. A second 5 cm layer was excavated similarly. Thereafter, the soil was excavated in 10 cm depth increments to a maximum depth of 50 cm. The roots from each depth were sorted from the soil with a 2 x 2 mm screen mesh. A l0% (by volume) soil subsample from each depth was passed through a 0.5 mm screen mesh for retrieval of very fine roots. All root material was washed and subsequently sorted into nine diameter size classes: <1, 1<2, 2<5, 5<10, 10<20, 20<30, 30<40, 40<50 and >50 mm. Diameter was determined at the midpoint of each root segment. Roots were dried for 72 h at 80 C and weighed to the nearest 0.01 g.
- Root Growth Experiments (Jordan and Escalante, 1980). Root growth in the surficial root mat was measured by determining the rate at which roots grew into fresh leaf and wood litter placed on the surface of the root mat for 9 months (experiment 1), 10-month root growth through 1,600 cm2 screens (with litter placed on top of screens to depth equal to the depth of litter in the surrounding area; experiment 4), and lateral root growth into pits cleared of the root mat (root growth into litter which accumulated over 30 months in the 40 cm on a side x 40 m deep pits; experiment 6). The results in this data set represent the total average root growth from experiments 1, 4, and 6.
- Root Production in Ingrowth Cylinders (Cuevas and Medina, 1988). Plastic cylinders with 4 mm2 mesh (10 cm tall x 7.5 cm diameter) filled with medium-sized vermiculite were used to measure fine root production. The experiments were conducted twice at the Tierra Firme and Tall Caatinga sites and once at the Low Bana site. The first experiment was carried out at the three sites from September 1980 until January 1981, and the second experiment was carried out in Tierra Firme from May until August 1981, and in Tall Caatinga from May until November 1981. A total of 128 cylinders per site was used in the first experiment, 32 per nutrient treatment plus control. Half the cylinders were placed within the root mat in Tierra Firme or on top of the soil in Tall Caatinga and Low Bana. The remaining cylinders were inserted in the top 10 cm of soil. Eight cylinders were collected per treatment (4 from above and 4 from within the soil) approximately every 30 days. During collection, roots that had penetrated the cylinders were carefully cut before lifting. Within two days after collection the cylinders were transported to the laboratory in Caracas and frozen until further analysis. For root separation, cylinders were thawed, and the vermiculite plus roots taken out for processing under a 10 x magnifying lens. The roots were dried in a ventilated oven at 60 C for a minimum of 72 h, weighed, and stored for chemical analyses. The second experiment was carried out in a similar manner except that the replicate number increased from 4 to 6. To calculate root production rates, root biomass accumulated inside the cylinders was divided by the basal area of the cylinder. This production value corresponds only to the root mat and the top 10 cm of soil (measured by cylinder height), so it is only a fraction of fine root production in the whole profile.
Nutrients in Plant Biomass
- Pre-burn Experimental Forest Biomass Nutrients (Uhl and Jordan, 1984; Jordan, 1989). Subsamples were taken from 42 harvested trees in the Jordan (1989) experimental plot. Cross sectional samples of the trunk near the base and at the first branch were subsampled for bark, sapwood, and heartwood. Two cross sections of one large branch from each tree were similarly sampled. Approximately one kg of leaves and one kg of twigs (branches above the lowermost leaf) also were collected by sampling approximately equal amounts from the top, middle, and lower canopy. For roots, 12 subsamples were taken from the roots from each of the 18 soil pits analyzed by Stark and Spratt (1977). Cores taken from the root mat were used for litter (partially decomposed leaves and fine humus) and fine root analysis. Samples of every fifth decomposing log encountered during the survey of fallen log biomass were taken for analysis of nutrients in dead wood.
- Nutrient Dynamics in Fine Roots and Leaf Litter (Cuevas and Medina, 1986; Cuevas and Medina, 1988; and Medina and Cuevas, 1989). Root samples from the ingrowth cylinder experiment (Cuevas and Medina, 1988) and leaf litter samples from litterfall collections (Cuevas and Medina, 1986) were analyzed for nutrient content using standard laboratory methods. Leaves collected for the leaf decomposition experiment were also analyzed for nutrient content (i.e., the initial nutrient content of freshly dried leaves) (Cuevas and Medina, 1988).
Litter Decomposition (Jordan, 1989; Cuevas and Medina, 1988; and Medina and Cuevas, 1989). Adult leaves from three dominant species (Caryocar glabrum, Aspidosperma megalocarpum and Lieania heteromorpha) were collected and dried without petioles at the field station in a ventilated oven at 60 C during 3-4 days. Around 10 g of leaves of each species were placed in 20 x 20 cm plastic bags with 4 mm2 mesh (same mesh as the root cylinders), and individually tagged. The mesh size was chosen to allow fine roots characteristic of the root mat and the upper soil layer to enter the bags. Initial chemical composition was measured on all species. Groups of bags for each of the species were exposed to one of three treatments: (1) left undisturbed on top of the intact soil (root mat + litter) to allow root penetration and attachment, (2) placed on top of the intact soil and lifted weekly in order to prevent root penetration, and (3) put on a 1 m2 wire basket with 1 cm2 mesh elevated 15 cm from the soil surface. There were three replicates per species, per treatment, and per collection. The bags were randomly placed in areas approximately 30 x 30 m. Replicates were collected at 14, 32, 71, 132, 242, and 482 days. Bags and their contents were oven-dried at 60 C. Leaves and roots were separated and weighed. Decomposition was analyzed following an exponential model. See Cuevas and Medina (1988) for details.
Tall Amazon Caatinga
Above-ground Biomass, Production, and Nutrients
- Leaf Biomass (Klinge and Herrera, 1978; 1983). The leaf biomass estimate is the fraction of leaves in total above-ground phytomass of trees > 1 cm dbh based on harvest methods described below.
- Above-ground Phytomass (Klinge and Herrera, 1978; 1983). The 200 m x 500 m study site was marked with a 10 x 10 m reference grid and 13 plots phytomass plots were selected exclusively in the tropaquod area which had been delineated and inventoried by Bruinig (1980). The plots were subjectively distributed in order to cover a wide range of the vegetation along the topographical gradient from Tall Amazon Caatinga to Bana woodland. Trees, palm-trees and climbers > 1 cm dbh were harvested individually. Boles were cut at the forest floor and total length, bole length, and maximum crown diameter were measured after felling. Branches and twigs, and roots when pulled out, were severed from the bole. Leafy twigs were separated from the branches, and foliage was stripped off by hand. Each fraction was weighed separately. Plants below 1 cm in dbh were pulled out and counted separately for each plot; their phytomass was separated into foliage, shoot and root and weighed. Epiphytes (aroids, bromeliads, orchids), parasites (Loranthaceae), bryophytes (growing mostly on the lower portions of the boles), and Selaginella sp. of the forest floor were separately harvested and weighed. Cross sections of boles > 5 cm dbh were taken for the estimation of sapwood and hardwood area. Cross sections of a few selected species were studied anatomically. All phytomass fractions were sampled. The samples were ground and oven dried at 105 C. The moisture percentages obtained were used for the conversion of fresh weight to dry weight. All together 651 individuals (629 trees and 22 lianas) were sampled for the estimation of dry weight and nutrients, while fresh weight data were obtained for additional 849 individuals.
- Litterfall and Litterfall Nutrient Content (Cuevas and Medina, 1986). Methods same as for Tierra Firme site.
- Dead Wood and Litter (Klinge and Herrera, 1978, 1983; Medina and Cuevas, 1989). Fine litter was collected under areas of 50 cm x 50 cm in five localities distributed randomly in each plot before phytomass harvesting began. Standing dead wood was harvested and weighed. Dead branches and boles at the forest floor in each plot were heaped and weighed. All phytomass fractions were sampled. The samples were ground and oven dried at 105 C. The moisture percentages obtained were used for the conversion of fresh weight to dry weight. Raw humus was sampled at each of the 13 localities in 0.25 m2 plots on the forest floor down to depths of 4 to 12.5 cm.
- Monthly and Annual Litterfall (Jordan, 1989). Methods same for Tierra Firme site.
- Above-ground Wood Production (Jordan, 1989). Methods same as for Tierra Firme site (four year growth increment study, Tall Caatinga site).
- Leaf Area Index (Klinge and Herrera, 1978; 1983). Methods same as for Tierra Firme site.
- Leaf Litter Carbon:Nitrogen and Carbon:Phosphorus Ratios (Klinge and Herrera, 1978; Jordan, 1989). Six hundred and fifty-one individuals (629 trees and 22 lianas) from the harvested phytomass were sampled for nutrient contents.
Below-ground Biomass, Production, and Nutrient Content
- Below-ground Phytomass (Klinge and Herrera, 1978; 1983). The composite root mass of the Amazon caatinga vegetation was studied in 0.25 m2 soil pits dug in the center of 13 plots to groundwater level, each plot representing a particular site type and its vegetation. Twelve additional pits were dug along a 100 m transect. Aboveground biomass in the plots was harvested prior to excavation. The soil of each genetic soil horizon was spread on a plastic sheet, roots were handpicked, and roots and soil were weighed separately. The sampling technique is described in Klinge and Herrera (1978).
- Below-ground Root Biomass (Sanford, 1989). Methods same for Tierra Firme site.
- Root Production in Ingrowth Cylinders (Cuevas and Medina, 1988). Methods same as for Tierra Firme site.
- Nutrient Dynamics in Fine Roots (Cuevas and Medina, 1988; Medina and Cuevas, 1989). Methods same as for Tierra Firme site (root samples from the ingrowth cylinder experiment).
Litter Decomposition (Jordan, 1989; Cuevas and Medina, 1988; and Medina and Cuevas, 1989). Methods same as for Tierra Firme site except vegetation was different. From the Tall Amazon Caatinga forest, the following species were selected: Micrandra sprucei, Manilkara sp. and Eperua leucantha. These species are representative of the dominants in each of the three ecosystems in terms of litter input to the forest floor (Cuevas and Medina, 1986).
Bana
Above-ground Biomass, Production, and Nutrient Content
- Above-ground Phytomass (Klinge and Herrera, 1978). Methods same as for Tall Amazon Caatinga.
- Above-ground Phytomass (Bongers et al., 1985). The phytomass study was carried out in March and April 1978 in 9 plots laid out along two lines. Two immediately adjacent plots were established in Tall Bana, five in Low Bana, and two in Open Bana. The litter layer, where present, was sampled in two to five 0.25 m2 areas per plot. Herbaceous and woody species <1 cm dbh were uprooted by hand. Bigger plants were mapped and measured for dbh. After felling, crown diameter and bole length were measured. The foliage was removed by hand. Foliage, branches and boles were weighed separately. Herbaceous plants were separated mostly by species and then into above-ground and below-ground fractions. The above-ground fractions of woody plants >1 cm dbh were kept separately for each individual tree or climber. All weighed fractions were sampled for the estimation of dry weight and nutrient content.
- Litterfall and Litterfall Nutrient Content (Cuevas and Medina, 1986). Methods same as for Tierra Firme site.
- Leaf Area Index (Bongers et al., 1985). Ten to 15 dry leaves were selected at random from the leaf samples, outlined on paper and weighed.
Below-ground Biomass and Production
- Root Biomass (Bongers et al., 1985). Two soil pits, one on raised ground and one in a depression, were dug in 7 of the plots using the same metal frame as used in sampling the litter. All roots of each soil layer were handpicked and weighed fresh. Soil was also weighed, and soil samples were taken for careful inspection of fine root fragments in the laboratory. All weighed fractions were sampled for the estimation of dry weight and nutrient content.
- Below-ground Root Biomass (Sanford, 1989). Methods same for Tierra Firme site.
- Root Production in Ingrowth Cylinders (Cuevas and Medina, 1988). Methods same as for Tierra Firme site.
- Nutrient Dynamics in Fine Roots (Cuevas and Medina, 1988; Medina and Cuevas, 1989). Methods same as for Tierra Firme site (root samples from the ingrowth cylinder experiment).
Litter Decomposition (Jordan, 1989; Cuevas and Medina, 1988; and Medina and Cuevas, 1989). Methods same as for Tierra Firme site except vegetation was different. From the Bana forest the following species were selected: Rodognaphalopsis discolor, Remijia involucrata and Macairea rufescens. These species are representative of the dominants in the ecosystem in terms of litter input to the forest floor (Cuevas and Medina, 1986).
Climate
The climate data in this data set are available from a government weather station in the village of San Carlos. Measurements in this data set cover several time periods (1950-1958, 1970-1978, 1975-1981, and 1950-1991).
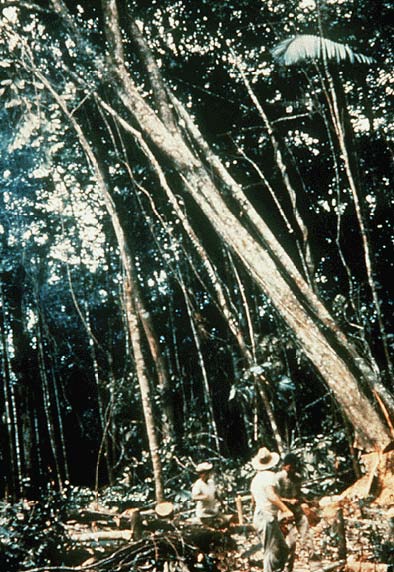
Figure 4. Cutting an experimental plot at the San Carlos de Rio Negro tropical forest site, Venezuela. (Experiment to determine productivity and nutrient dynamics during slash-and-burn agriculture on an Oxisol. Photograph taken September 1976; reproduced by kind permission of Prof. C.F. Jordan, University of Georgia, USA). (SCR1-1.jpg)
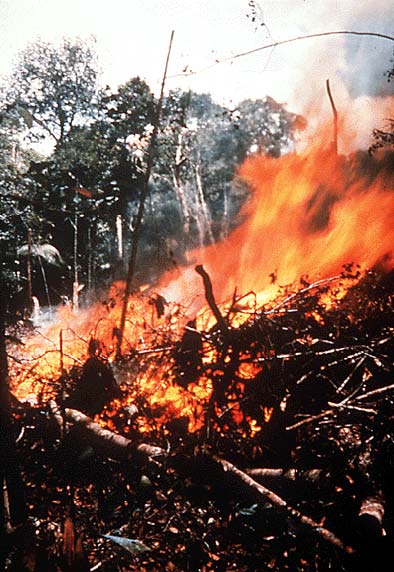
Figure 5. Burning an experimental plot at the San Carlos de Rio Negro tropical forest site, Venezuela. (Experiment to determine productivity and nutrient dynamics during slash-and-burn agriculture on an Oxisol. Photograph taken December 1976; reproduced by kind permission of Prof. C.F. Jordan, University of Georgia, USA). (SCR4-1.jpg)
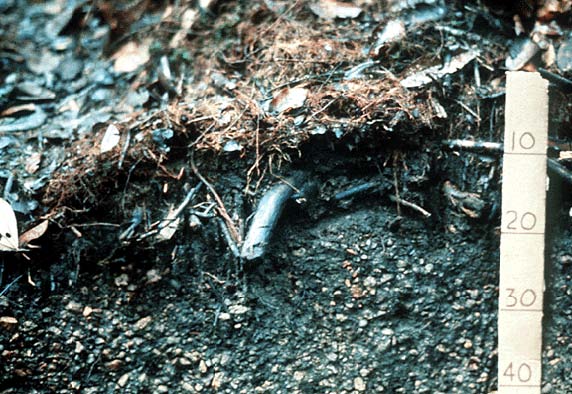
Figure 6. Profile of top 40 cm of soil on an Oxisol hill sub-site at the San Carlos de Rio Negro tropical forest site, Venezuela. (Lateritic concretions are visible mixed in with the sand. Note mat of fine roots and humus on soil surface and concentration of larger roots directly above. Photograph reproduced by kind permission of Prof. C.F. Jordan, University of Georgia, USA). (SCR5-1.jpg)
6. Data Access:
This data set is available through the Oak Ridge National Laboratory (ORNL) Distributed Active Archive Center (DAAC).
Data Archive:
Web Site: http://daac.ornl.gov
Contact for Data Center Access Information:
E-mail: uso@daac.ornl.gov
Telephone: +1 (865) 241-3952
7. References:
Bongers, F., D. Engelen, and H. Klinge. 1985. Phytomass structure of natural plant communities on spodosols in southern Venezuela: the Bana woodland. Plant Ecology, 63(1): 13-34.
Brunig, E. F. 1980. Structure and function of a tropical rainforest in the Amazon MAB-ecosystem project at San Carlos de Rio Negro. 5. In: J. 1. Furtado (ed.) Proc. Vth lnternat. Syrup. Trop. Ecol., Kuala Lumpur 1979 1:33 45.
Cuevas, E., and E. Medina. 1986. Nutrient dynamics within amazonian forests. I. Nutrient flux in fine litter fall and efficiency of nutrient utilisation. Oecologia 68: 466-472.
Cuevas, E., and E. Medina. 1988. Nutrient dynamics within amazonian forests. II. Fine root growth, nutrient availability and leaf litter decomposition. Oecologia 76: 222-235.
Jordan, C. F., and C. Uhl. 1978. Biomass of a "tierra firme" forest of the Amazon basin. Oecologia Plantarum 13: 387-400.
Jordan, C. F., ed. 1989. An Amazonian Rain Forest: structure and function of a nutrient-stressed ecosystem and the impact of slash-and-burn agriculture. UNESCO-MAB/Parthenon, Carnforth, UK. 176 pp.
Jordan, C. F., and G. Escalante. 1980. Root productivity in an Amazonian rain forest. Ecology 61: 14-18.
Jordan, C. F., and R. Herrera. 1981. Tropical rain forests: are nutrients really critical? The American Naturalist 117(2): 167-180.
Jordan, C. F., and J. R. Kline. 1977. Transpiration of trees in a tropical rainforest. J. appl. Ecol. 14: 853 860.
Jordan, C.F., W. Caskey, G. Escalante, R. Herrera, F. Montagnini, R. Todd, and C. Uhl. 1982. The nitrogen cycle in a "Tierra Firme" rainforest in the Amazon territory of Venezuela. Plant and Soil, 67: 325-332.
Herrera, R. 1979. Nutrient distribution and cycling in an Amazonian Caatinga forest on spodosols in southern Venezuela. Ph.D. thesis, University of Reading, 241 pp.
Klinge, H., and R. Herrera. 1978. Biomass studies in amazon caatinga forest in southern Venezuela. I. Standing crop of composite root mass in selected stands. Tropical Ecology 19: 93-110.
Klinge, H., and R. Herrera. 1983. Phytomass structure of natural plant communities on spodosols in southern Venezuela: the tall Amazon Caatinga forest. Vegetatio 53: 65-84.
Medina, E., and E. Cuevas. 1989. Patterns of nutrient accumulation and release in Amazonian forests of the upper Rio Negro basin. In: Mineral Nutrients in Tropical Forest and Savanna Ecosystems. (J. Proctor, ed.) British Ecological Society Special Publication No. 9: Blackwell Scientific, Oxford. pp. 217-240.
Medina, E., M. Sobrado, and R. Herrera. 1978. Significance of leaf orientation for leaf temperature in an amazonian sclerophyll vegetation. Radiation and Environmental Biophysics 15(2): 131-140.
Medina, E., Klinge, H., Jordan, C. & Herrera, R. 1980. Soil respiration in Amazonian rainforest in the Rio Negro Basin. Flora 170: 240 250.
Olson,
R. J., K.R. Johnson, D.L.
Zheng, and J.M.O.
Scurlock. 2001. Global and Regional Ecosystem Modeling: Databases of
Model
Drivers and Validation Measurements. ORNL Technical Memorandum
TM-2001/196.
Putz, F. E. 1983. Liana biomass and leaf area of a "Tierra Firme" forest in the Rio Negro Basin, Venezuela. Biotropica 15(3): 185-189.
Saldarriaga, J.G. 1985. Forest succession inthe upper Rio Negro of Colombia and Venezuela. PhD Thesis. University of Tennessee, Knoxville, U.S.A.
Sandford, Jr., R.L. 1985. Root ecology of mature and successional Amazon forests. PhD Thesis. University of California, Berkeley, U.S.A.
Sanford, Jr., R. L. 1989. Root systems in three adjacent, old growth Amazon forests and associated transition zones. Journal of Tropical Forest Science 1(3): 268-279.
Stark, N., and M. Spratt. 1977. Root biomass and nutrient storage in rain forest oxisols near San Carlos de Rio Negro. Tropical Ecology 18: 1-9.
Uhl, C., and C. F. Jordan. 1984. Succession and nutrient dynamics following forest cutting and burning in Amazonia. Ecology 65: 1476-1490.
Additional Sources of Information:
Alvarez-Sánchez, J. 1991. Productividad primaria neta en una selva tropical húmeda. Boletin de la Sociedad Botánica de México 51: 3-12.
Clark, D. A., S. Brown, D. W. Kicklighter, J. Q. Chambers, J. R. Thomlinson, J. Ni, and E. A. Holland. 2001a. Net primary production in tropical forests: an evaluation and synthesis of existing field data. Ecological Applications, 11(2): 371-384.
Clark, D.A., S. Brown, D.W. Kicklighter, J.Q. Chambers, J.R. Thomlinson, J. Ni, and E.A. Holland. 2001b. NPP Tropical Forest: Consistent Worldwide Site Estimates, 1967-1999. Data set. Available on-line [http://daac.ornl.gov] from the Oak Ridge National Laboratory Distributed Active Archive Center, Oak Ridge, Tennessee, U.S.A. doi:10.3334/ORNLDAAC/616
Hozumi, K., K, Yoda and S. Kokawa. 1969. Production ecology of tropical rain forests in southwestern Cambodia. I. Plant biomass. Nature and Life in SE Asia.
Olson, R.J., J.M.O. Scurlock, S.D. Prince, D.L. Zheng, and K.R. Johnson (eds.). 2012a. NPP Multi-Biome: Global Primary Production Data Initiative Products, R2. Data set. Available on-line [http://daac.ornl.gov] from the Oak Ridge National Laboratory Distributed Active Archive Center, Oak Ridge, Tennessee, U.S.A. doi:10.3334/ORNLDAAC/617
Olson, R.J., J.M.O. Scurlock, S.D. Prince, D.L. Zheng, and K.R. Johnson (eds.). 2012b. NPP Multi-Biome: NPP and Driver Data for Ecosystem Model-Data Intercomparison, R2. Data set. Available on-line [http://daac.ornl.gov] from the Oak Ridge National Laboratory Distributed Active Archive Center, Oak Ridge, Tennessee, U.S.A. doi:10.3334/ORNLDAAC/615
Raich, J.W., E.B. Rastetter, J.M. Melillo, D.W. Kicklighter, P.A. Steudler, B.J. Peterson, A.L. Grace, B. Moore III, and C.J. Vörösmarty. 1991. Potential net primary productivity in South America: Application of a global model. Ecological Applications 1:399-429.
Scurlock, J.M.O., and R J. Olson. 2002. Terrestrial net primary productivity - A brief history and a new worldwide database. Environ. Rev. 10(2): 91-109. doi:10.1139/a02-002
Scurlock, J.M.O., and R.J. Olson. 2012. NPP Multi-Biome: Grassland, Boreal Forest, and Tropical Forest Sites, 1939-1996, R1. Data set. Available on-line [http://daac.ornl.gov] from Oak Ridge National Laboratory Distributed Active Archive Center, Oak Ridge, Tennessee, U.S.A. doi:10.3334/ORNLDAAC/653
8. Data Set Revisions
Revision Summary:
The temporal coverage of several parameters in the data files for the three sub-sites (scr1_npp.txt, scr2_npp.txt, and scr3_npp.txt) were updated to replace missing values or uncertainties with information found in the primary literature. Additional lines of data were added to the data files, and additional primary sources were added to the References columns.
All other NPP values in the data file are not affected.
Data File Changes:
Several data collection dates have been revised, and some data values and references have been added. A duplicate line of data (leaflitterfall-N) for the Tierra Firme site was removed from scr1_npp.txt. For the Tall Amazon Caatinga site, above-ground biomass data for leaves, standing dead wood, bole litter, branch litter, twig litter, and leaf litter from Klinge and Herrera (1983) were added to scr2_npp.txt. In addition, fine litterfall accumulation (Medina et al., 1980), raw humus buildup to depths of 1-12 cm (Klinge and Herrrera, 1978), and leaflitter-N and leaflitter-P (Cuevas and Medina, 1986) values for the Tall Amazon Caatinga forest were added to scr2_npp.txt. LAI, leaf litter, wood litter, total litter, and standing dead wood biomass values for tall, low, and open Bana forests from Bongers et al. (1985) were added to scr3_npp.txt. Total root data for each sub-site from Sanford (1989) have been added.
No other data values have been revised. The data values
in the revised data file (scr1_npp_r1.txt, scr2_npp_r1.txt, and scr3_npp_r1.txt) are correct.
Cited References:
Bongers, F., D. Engelen, and H. Klinge. 1985. Phytomass structure of natural plant communities on spodosols in southern Venezuela: the Bana woodland. Plant Ecology, 63(1): 13-34.
Cuevas, E., and E. Medina. 1986. Nutrient dynamics within amazonian forests. I. Nutrient flux in fine litter fall and efficiency of nutrient utilisation. Oecologia 68: 466-472.
Klinge, H., and R. Herrera. 1978. Biomass studies in amazon caatinga forest in southern Venezuela. I. Standing crop of composite root mass in selected stands. Tropical Ecology 19: 93-110.
Klinge, H., and R. Herrera. 1983. Phytomass structure of natural plant communities on spodosols in southern Venezuela: the tall Amazon Caatinga forest. Vegetatio 53: 65-84.
Medina, E., Klinge, H., Jordan, C. & Herrera, R. 1980. Soil respiration in Amazonian rainforest in the Rio Negro Basin. Flora 170: 240 250.
Sanford, Jr., R. L. 1989. Root systems in three adjacent, old growth Amazon forests and associated transition zones. Journal of Tropical Forest Science 1(3): 268-279.
Data User Action: If you downloaded this data set from the ORNL DAAC online archive before 10/15/2013 then you should download it again.
Original Citation: Jordan, C.F., E. Cuevas, and E. Medina. 1999. NPP Tropical Forest: San Carlos de Rio Negro, Venezuela, 1975-1984. Data set. Available on-line [http://daac.ornl.gov] from Oak Ridge National Laboratory Distributed Active Archive Center, Oak Ridge, Tennessee, U.S.A.