Get Data
Summary:
This data set contains site characteristics, stand descriptors, and measured and calculated above-ground biomass, above-ground net primary production (ANPP), and woody detritus input data for an old Sequoia sempervirens stand at Bull Creek in Humboldt Redwoods State Park, California. There is one data file (.csv format) with this data set.
Productivity of the Sequoia stand was studied via tree re-measurement (1972 and 2001) and allometric relationships. Measurements of tree circumference at 1.7 m above ground were made at the beginning and the end of the study. A 1972 stem map of the stand allowed the investigators to identify and re-measure trees >10 cm in diameter. ANPP was estimated using a range of specific gravities and several allometric relationships for tree volume. Estimation procedures were outlined by Busing and Fujimori (2005). Tree loss to mortality over the study interval was included in the analysis.
Estimates of total tree ANPP ranged from 600 to 1,400 g/m2/yr. However, ANPP values in the range of 700-1,000 g/m2/yr were considered to be the most reasonable estimate because of the accuracy of the particular equations, specific gravities, and assumptions used to obtain them (Busing and Fujimori, 2005). Above-ground total tree biomass was extremely high (> 300,000 g/m2).
Revision Notes: Only the documentation for this data set has been modified. The data files have been checked for accuracy and are identical to those originally published in 2005.
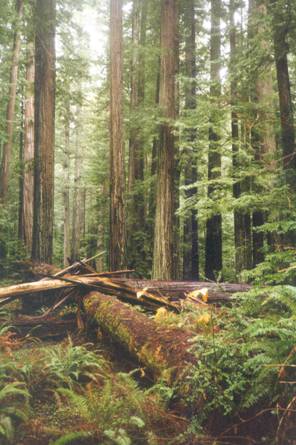
Figure1. Photograph of the old-growth study stand in 2001.
Additional Documentation
The Net Primary Productivity (NPP) data collection contains field measurements of biomass, estimated NPP, and climate data for terrestrial grassland, tropical forest, temperate forest, boreal forest, and tundra sites worldwide. Data were compiled from the published literature for intensively studied and well-documented individual field sites and from a number of previously compiled multi-site, multi-biome data sets of georeferenced NPP estimates. The principal compilation effort (Olson et al., 2001) was sponsored by the NASA Terrestrial Ecology Program. For more information, please visit the NPP web site at http://daac.ornl.gov/NPP/npp_home.html.
Data Citation:
Cite this data set as follows:
Busing, R.T., and T. Fujimori. 2013. NPP Temperate Forest: Humboldt Redwoods State Park, California, USA, 1972-2001, R1. Data set. Available on-line [http://daac.ornl.gov] from Oak Ridge National Laboratory Distributed Active Archive Center, Oak Ridge, Tennessee, USA. doi:10.3334/ORNLDAAC/803.
This data set was originally published as:
Busing, R.T., and T. Fujimori. 2005. NPP Temperate
Forest: Humboldt Redwoods State Park, California, U.S.A., 1972-2001.
Data set. Available on-line [http://daac.ornl.gov] from Oak Ridge
National Laboratory Distributed Active Archive Center, Oak Ridge,
Tennessee, U.S.A.
Table of Contents:
- 1 Data Set Overview
- 2 Data Description
- 3 Applications and Derivation
- 4 Quality Assessment
- 5 Acquisition Materials and Methods
- 6 Data Access
- 7 References
1. Data Set Overview:
Project: Net Primary Productivity (NPP)
Productivity of an old stand of coast redwoods in northern California was studied via tree re-measurement (1972 and 2001) and allometric relationships. Measurements of tree circumference at 1.7 m above ground were made at the beginning and the end of the study. ANPP was estimated using a range of specific gravities and several allometric relationships for tree volume. Tree loss to mortality over the study interval was included in the analysis. Reported data include site characteristics, redwood stand descriptors, and measured and calculated biomass and ANPP data.
In 1972, Dr. Fujimori established a 120 x 120 m plot (1.44 ha) in a particularly massive stand of coast redwoods on alluvial flats near Bull Creek in Humboldt Redwoods State Park, California (40.35 degrees N, -123.00 degrees W). At more than 1,000 years of age, with trees greater than 90 m tall, the stand is relatively old and well developed. The climate is characterized by moderate temperatures, wet winters, and summers with low precipitation. Summer fog contributes to moisture input. The Scotia, California meteorological station mean annual temperature was 12.6 degrees C. Mean annual precipitation was 1,230 mm. Detailed climate data for this station are available from the Western Regional Climate Center.
A 1972 stem map of the stand allowed the investigators to identify and re-measure trees >10 cm in diameter in 2001. A range of tree biomass and ANPP estimates was obtained using estimation procedures outlined by Busing and Fujimori (2005).
Estimates of total tree ANPP ranged from 600 to 1,400 g/m2/yr. However, ANPP values in the range of 700-1,000 g/m2/yr were considered to be the most reasonable estimate because of the accuracy of the particular equations, specific gravities, and assumptions used to obtain them (Busing and Fujimori, 2005). Above-ground total tree biomass was extremely high (> 300,000 g/m2); however, ANPP was not extreme.
2. Data Description:
This data set contains one data file in .csv format. The file contains site characteristics, stand descriptors, and measured and calculated above-ground biomass, ANPP, and woody detritus input data for an old Sequoia sempervirens stand at Bull Creek in Humboldt Redwoods State Park, California.
Spatial Coverage
Site: Humboldt Redwoods State Park, California, USA
Site Boundaries:(All latitude and longitude given in decimal degrees)
| Site (Region) | Westernmost Longitude | Easternmost Longitude | Northernmost Latitude | Southernmost Latitude | Elevation (m) |
|---|---|---|---|---|---|
| Humboldt Redwoods State Park, California, U.S.A. | -123.00 | -123.00 | 40.35 | 40.35 | 80 |
Site Information
Sequoia sempervirens occurs within 50 km of the Pacific Ocean from southern Oregon to central California. Particularly massive stands of Sequoia occur in the Central Redwood Forest, which ranges from southern Humboldt County to San Francisco Bay. An old stand of very large trees on alluvial flats within this biogeographic section was selected for this study. It lies near Bull Creek in Humboldt Redwoods State Park. Moderate annual temperatures (average 12.6 C) and high moisture input (1,230 mm/yr) are characteristic of the forest. In summer, fog drip compensates for low summer precipitation.
Sequoia comprises more than 99% of the total live basal area in the study stand (Busing and Fujimori, 2002). Overstory tree height often exceeds 90 m. Other tree species in the forest are much shorter in stature. They include Umbellularia californica, Lithocarpus densiflorus, Taxus brevifolia, and Corylus cornuta.
Natural disturbances in the study forest include fire, flooding, and tree fall. The presettlement return interval for fire in Humboldt County and surrounding areas is estimated at <10 to 500 years. However, fire suppression policies implemented in the 1900s have greatly reduced fire occurrence for at least the last 50 years. By contrast, flooding has occurred in the study stand in recent decades. The return interval for floods covering most of the study stand is <100 years. Tree-fall gaps are also an important form of disturbance in the study forest. Although the return interval of gap disturbance is at least 250 years, individual gaps can exceed 0.1 ha in area (Busing and Fujimori, 2002). Gaps currently cover about 20% of the total area within the study forest.
Spatial Resolution
Ecological attributes of the old-growth stand were studied using one 1.44 ha plot.
Temporal Coverage
Biomass, forest structure, and ANPP measurements were made in 1972 and 2001. Tree ingrowth and mortality by species between 1972 and 2001 were recorded. Woody detritus volume was estimated in 2001.
Temporal Resolution
Forest structure, above-ground biomass, and ANPP measurements were made over a 29-year period. ANPP estimates are based on plant dry matter accumulation, expressed as g/m2/year.
Data File Information
Table 1. Data files in this data set archive
| FILE NAME | TEMPORAL COVERAGE | FILE CONTENTS |
|---|---|---|
| Redwood_NPP.csv | 1972/01/01 - 2001/12/31 | Site characteristics, stand descriptors, and measured and calculated biomass and ANPP data for an old stand of coast redwoods in northern California |
NPP Data. ANPP estimates for the Humboldt Redwoods State Park site are provided in a single ASCII file, in comma-separated-format. The variable values are delimited by commas. The first 18 lines are metadata; data records begin on line 19. The value -999.9 is used to denote missing values. Biomass and NPP units are in g/m2 and g/m2/year (dry matter weight), respectively.
Data Format:
Table 2. Column headings in NPP file
| Column Heading | Definition |
|---|---|
| Orig_sort_order | Original data file sort order |
| Parameter | Measured or calculated attribute (see definitions in Table 3) |
| Measurement | General measurement type (site character, density, area, volume, mass, biomass, ANPP, etc) |
| Units | Units of measure |
| Species | Species measured (Sequoia sempervirens, all species, or species other than Sequoia) |
| Sequoia_sp_grav | Specific gravity measurement for Sequoia sempervirens. Specific gravity values for Sequoia wood were obtained from two references: specific gravity, 0.33 mg/cm3, from Westman and Whittaker (1975) and specific gravity, 0.38 mg/cm3, from Green et al. (1999). |
| Equation | Description and source of mathematical formulas and allometric equations used to calculate value. Pertinent information regarding the formulas and their application is provided in Busing and Fujimori (2005). |
| Equation_ref | Reference for Equation |
| Method | Calculations and allometric equations described in Busing and Fujimori (2005). |
| Method_ref | Reference for Method |
| Notes | Notation about range of values resulting from minimum and maximum estimation ratios of Westman and Whittaker (1975) |
| Notes_ref | Reference for Notes |
Table 3. Parameter definitions in NPP file
| PARAMETER | DEFINITION | UNITS |
|---|---|---|
| Date of initial field data collection | Year in which data were collected | year |
| Latitude | Plot latitude | decimal degree |
| Longitude | Plot longitude | decimal degree |
| Slope | Degree of inclination | degree |
| Elevation | Elevation above mean sea level | m |
| Total site area | Plot size | ha |
| Density | Number of stems per ha for all species > 1.7 m tall in 1972 | stems/ha |
| Basal area | Basal area for all species and for Sequoia sempervirens > 10 cm dia. in 1972 (live trees) | m2/ha |
| Basal area of standing dead trees | Basal area of standing woody detritus (all species) in 2001 | m2/ha |
| Density of standing dead trees | Density of standing woody detritus (all species) in 2001 | stems/ha |
| Volume of standing coarse woody detritus | Volume of standing woody detritus (all species) in 2001 | m3/ha |
| Volume of fallen coarse woody detritus | Volume of fallen woody detritus (fallen dead trees and stumps; all species) in 2001 | m3/ha |
| Mass of standing coarse woody detritus | Mass of standing woody detritus (all species) in 2001 | g/m2 |
| Mass of fallen coarse woody detritus | Mass of fallen woody detritus (fallen dead trees and stumps; all species) in 2001 | g/m2 |
| Input of coarse woody detritus | Annual rate of coarse woody detritus input (determined from tree mortality in the 1.44-ha plot over a 29-yr period using two different equations .. see Methods column) | g/m2/yr |
| Volume of fallen fine woody detritus | Volume of fallen fine woody detritus (<10 cm diameter at intercept; all species) in 2001 | m3/ha |
| Mass of fallen fine woody detritus | Mass of fallen fine woody detritus (<10 cm diameter at intercept; all species) in 2001 | g/m2 |
| Weighted mean height | Mean height of Sequoia sempervirens with specific gravity of 0.33 mg/cm3 | m |
| Mean radial increment | Annual diameter increment of ingrowth trees over 29-year period calculated using an initial diameter of 10 cm. in 1972 for all species and for Sequoia sempervirens | mm/yr |
| Parabolic volume | Parabolic volume calculated for live trees in 2001 plus trees that died over the interval for Sequoia sempervirens and species other than Sequoia (see equation in Appendix of Busing and Fujimori, 2005) | m3/ha |
| Stem volume | Stem volume for Sequoia sempervirens in 2001 calculated using three different equations | m3/ha |
| Stem biomass | Stem biomass for Sequoia sempervirens in 2001 calculated using two different specific gravities and three different equations | Mg/ha |
| Branch biomass | Branch biomass for Sequoia sempervirens in 2001 calculated using (1) stem parabolic x 0.12, (2) equation 1 x 0.12, and (3) equation 2 x 0.12 at specific gravity of 0.33 mg/cm3 | g/m2 |
| Total tree biomass | Total tree biomass for all species calculated using two specific gravity estimates (0.33 mg/cm3 and 0.38 mg/cm3) and three different equations (parabolic, equation 1, and equation 2) with ratios | g/m2 |
| Basal area increment | Basal area increment for Sequoia sempervirens and for species other than Sequoia over the 29-year period. Does not include contributions of trees dying over the course of the 29-year study. | m2/ha |
| Stem volume increment | Annual stem volume increment for Sequoia sempervirens over the 29-year period calculated using three different equations (parabolic, equation 1, and equation 2). Some values include contributions of trees dying over the course of the 29-year study. | cm3/m2/yr |
| Stem ANPP | Stem production for Sequoia sempervirens over the 29-year period calculated using two specific gravity estimates (0.33 mg/cm3 and 0.38 mg/cm3) and three different equations (parabolic, equation 1, and equation 2). Some values include contributions of trees dying over the course of the 29-year study. | g/m2/yr |
| Branch ANPP | The range of branch production for Sequoia sempervirens over the 29-year period obtained by multiplying the stem ANPP by 0.25 and by 0.30 (Westman and Whittaker, 1975). Some values include contributions of trees dying over the course of the 29-year study. | g/m2/yr |
| Stem and branch ANPP | The range of stem and branch production for Sequoia sempervirens over the 29-year period calculated by addition. Some values include contributions of trees dying over the course of the 29-year study. | g/m2/yr |
| Twig and leaf ANPP | The range of twig and leaf production for Sequoia sempervirens over the 29-year period estimated as the combined stem and branch ANPP multiplied by 0.3 and by 0.5. Some values include contributions of trees dying over the course of the 29-year study. | g/m2/yr |
| Tree ANPP | The range of tree production for Sequoia sempervirens over the 29-year period calculated using two specific gravity estimates (0.33 mg/cm3 and 0.38 mg/cm3) and three different equations (parabolic, equation 1, and equation 2). Some values include contributions of trees dying over the course of the 29-year study. | g/m2/yr |
| Other tree ANPP | Production of trees other than Sequoia sempervirens over the 29-year period estimated using parabolic equation for living trees and trees dying over the course of the 29-year study. | g/m2/yr |
| Total tree ANPP | The range of tree production for all species over the 29-year period calculated using two specific gravity estimates (0.33 mg/cm3 and 0.38 mg/cm3) and three different equations (parabolic, equation 1, and equation 2). Some values include contributions of trees dying over the course of the 29-year study. | g/m2/yr |
Sample NPP Data Record
| Orig_sort_order,Parameter,Measurement_Type,Value,Units,Species,Sequoia_sp_grav,Equation,... 1,Latitude,Site Characteristics,40.35,decimal degree,Not applicable,-999.9,Not applicable,Not applicable,... 2,Longitude,Site Characteristics,-123.00,decimal degree,Not applicable,-999.9,Not applicable,Not applicable,... 3,Terrain,Site Characteristics,Alluvial flat,Not applicable,Not applicable,-999.9,Not applicable,Not applicable,... 4,Slope,Site Characteristics,0,degree,Not applicable,-999.9,Not applicable,Not applicable,... 5,Elevation (above mean sea level),Site Characteristics,80,m (meter),Not applicable,-999.9,Not applicable,Not applicable,... 6,Total site area ,Site Characteristics,1.44,ha (hectare),Not applicable,-999.9,Not applicable,Not applicable,... 7,Density,Density,380,stems/ha (stems per hectare),All species,-999.9,Not applicable,Not applicable,... 8,Basal area,Area,330,m2/ha (square meter per hectare),All species,-999.9,Not applicable,Not applicable,... 9,Basal area,Area,329,m2/ha (square meter per hectare),Sequoia,-999.9,Not applicable,Not applicable,... … 123,Total tree ANPP,ANPP,581-697,g/m2/yr (gram per square meter per year),All species,0.33, eq. 2 estimates ... 124,Total tree ANPP,ANPP,669-802,g/m2/yr (gram per square meter per year),All species,0.38, eq. 2 estimates... |
3. Data Application and Derivation:
The accumulation of biomass, or NPP, is the net gain of carbon by photosynthesis that remains after plant respiration. While there are many fates for this carbon, this data set accounts for above-ground growth of Sequoia sempervirens and other tree species in Humboldt Redwoods State Park over a 29-year period. Production estimates were made using different specific gravity estimates for Sequoia and different allometric equations. Density and basal area values are reported for the initial sampling date (1972). Growth increment values are based on re-measurements in 2001.
This data set is the result of a three-decade study of the dynamics of composition and structure in an old Sequoia forest and complementary information on fundamental ecosystem processes. The old-growth stand of Sequoia studied had extremely high biomass, but ANPP was moderate and the amount of woody detritus was not exceptionally large. Biomass accretion and loss were not rapid in this stand partly because of the slow population dynamics and low canopy turnover rate of Sequoia at the old-growth stage.
The biomass dynamics data for the Humboldt Redwoods State Park site are provided for comparison with models and estimation of NPP.
4. Quality Assessment:
The fundamental ecosystem dynamics of this study forest were compared to those of other forests worldwide (Busing and Fujimori, 2005). The biomass of this study stand is more than ten times the average for temperate coniferous forests, yet ANPP is moderate and woody detritus levels are not extreme. Thus, biomass accretion and loss are not rapid in this old-growth forest which reflects the slow canopy turnover of this Sequoia-dominated forest.
Sources of Error
Information not available.
5. Data Acquisition Materials and Methods:
Biomass and Production. In 1972, trees > 10 cm diameter at 1.7 m above ground were measured with a diameter tape and mapped in a 1.44-ha plot (Fujimori, 1977). Allometric equations for tree height and stem volume were developed for the site. Equations for tree height as a function of diameter were developed from a subsample of live trees measured using an Abney level. An equation for Sequoia stem volume as a function of diameter and height was developed from a sample of 8 recently fallen trees. In 2001, the diameter on all live trees within the plot were re-measured and tree ingrowth and mortality by species since 1972 were noted. Using the 1972 stem map, diameter growth of individual live trees over the 29-yr period was determined. Mean annual diameter increments of each species were calculated. To account for effects of tree size and canopy position on growth, Sequoia diameter increments were calculated for each of the three canopy strata recognized by Fujimori (1977). These included a lower stratum (diameter <30 cm), a middle stratum (diameter 30–114 cm), and an upper stratum (diameter >114 cm). Sequoia tree heights in 2001 were estimated from diameter using one of the stratum-specific allometric equations (Fujimori, 1977).
Estimation of tree ANPP followed the general formula summarized by Newbould (1967), Ogawa (1977) and Long (1982) as the total annual growth of: (1) live trees, (2) trees or tree parts lost to mortality, and (3) tree parts consumed. Tree parts shed or consumed were ignored, however. Stand volume increment since 1972 was initially calculated with ingrowth and mortality components. Whenever possible, the measured diameter increment for each tree was used. If a measured Sequoia increment was uncertain (because of measurement location or tree identity), the mean increment for the corresponding canopy stratum was applied. Trees that died over the 29-yr interval were assigned a diameter increment equal to half the corresponding mean increment. Diameter increments of ingrowth trees were calculated using an initial diameter of 10 cm. Height increments were calculated from diameter measurements using a stratum- specific allometric equation (Fujimori, 1977). For trees with a measured height value in 1972, the increment was added to the measured height. Parabolic volume was calculated for (1) live trees in 1972, (2) live trees in 2001, and (3) live trees in 2001 plus trees that died over the interval. Annual parabolic volume increment was then calculated with and without compensation for mortality.
Stem volume of Sequoia was estimated using three methods: (1) the allometric relation developed by Fujimori (1977) for the study site, (2) a second allometric relation developed using stem taper data on hundreds of old-growth trees in the region (Parks, 1952), and (3) the estimation ratios of Westman and Whittaker (1975). The latter method involved multiplying the parabolic volume by 0.9. Stem mass estimates were obtained by multiplying the stem volume by the specific gravity. Branch biomass of Sequoia was estimated as 0.12 of the stem mass (Westman and Whittaker, 1975). Stem NPP of Sequoia was calculated as the annual stem volume increment times the specific gravity. A range of branch NPP values was obtained by multiplying the stem NPP by 0.25 and by 0.30 (Westman and Whittaker, 1975). A range of twig and leaf NPP values was estimated as the combined stem and branch NPP multiplied by 0.3 and by 0.5.
Separate biomass and production estimates were made using two different specific gravity values for Sequoia. Westman and Whittaker’s (1975) estimates were based on an intermediate value of 0.33. However, Green et al. (1999) note that 0.38 is appropriate for old-growth Sequoia. Some of our dead wood samples (see below) also indicated that 0.38 best represented the study forest. So, for comparative purposes we used 0.33, but we also used 0.38 and we considered this to be a more accurate value for the study forest. Other species comprised a very small proportion of the stand biomass and NPP. Total aboveground values for these species were estimated directly from parabolic volume and specific gravities of each species.
Woody Detritus. Woody detritus volume in 2001 was estimated with plot measurements for standing dead trees (or snags) and line transects for logs. Volume of standing dead trees (>1.7 m tall) within the 1.44-ha plot was calculated from measurements of diameter and height. The volumetric shape (cylindric, parabolic, or conic) and stage of wood decay (stage 1–5) of each standing dead tree were noted. Down dead wood was sampled with eight 100-m transects across the study forest. To avoid transect orientation bias, four of the transects ran roughly north to south and the other four ran east to west. The lateral distance between parallel transects exceeded 100 m. Fine dead wood (<10 cm diameter at intercept) was tallied along transect segments in size classes. The three smallest size classes followed those of Brown (1974). Class 1 items were <0.7 cm diameter, class 2 items were 0.7 to 2.5 cm diameter, and class 3 items were 2.6 to 7.6 cm diameter. A fourth fine wood class included items 7.7 to 9.9 cm diameter. Items in classes 1 and 2 were tallied on one 7-m segment per 100-m transect. Items in classes 3 and 4 were tallied on one 14-m segment per 100-m transect. Coarse dead wood ( < 10 cm diameter at intercept) was measured for diameter at point of intercept along each 100-m transect, identified to species, and assessed for stage of decay (stage 1-5).
Specific gravity of Sequoia wood by stage of decay was estimated with wood samples measured for volume and dry weight. For each stage of decay a set of samples, including representative proportions of sapwood and heartwood, was collected from the study site. Most items were cylindric and volume could be estimated from length and diameter. Other items were submersed in water and the displaced volume was measured. All samples were then oven dried at 55 C (to allow nutrient analysis) until constant dry weight was obtained (ca. 2 weeks). A subset of these samples was subsequently dried at 105 C for two additional days and the dry weight of all samples was adjusted using the mean percentage of weight lost at the higher temperature.
Rate of coarse woody detritus input was determined from tree mortality in the 1.44-ha plot over a 29-yr period. Stem volume of the dead individuals was estimated using the two allometric equations described above. The parabolic approach of Westman and Whittaker (1975) was not used in the estimation of dead tree volumes. Volume of fallen woody detritus was calculated using Van Wagner’s (1968) formula. Mass of coarse detritus was estimated for each stage of decay using our specific gravities. Fine woody detritus calculations followed those of Brown (1974); a representative diameter was used for each size class and a correction factor for intercept bias of nonhorizontal pieces was applied to the three smallest diameter classes. A specific gravity of 0.33 was used for all fine detritus mass estimates.
Note: In this study, biomass refers to the weight of material in living trees and detritus refers to material from dead trees and fallen parts.
6. Data Access:
These data are available through the Oak Ridge National Laboratory (ORNL) Distributed Active Archive Center (DAAC).
Data Archive Center:
Contact for Data Center Access Information:
E-mail: uso@daac.ornl.gov
Telephone: +1 (865) 241-3952
7. References:
Busing, R.T.; T. Fujimori. 2002. Dynamics of composition and structure in an old Sequoia sempervirens forest. Journal of Vegetation Science, 13 (6): 785-792.
Busing, R.T., and T. Fujimori. 2005. Biomass, production and woody detritus in an old coast redwood (Sequoia sempervirens) forest. Plant Ecology 177(2): 177-188.
Green, D.W. et al. 1999. Forest Products Laboratory. 1999. Wood handbook--Wood as an engineering material. Gen. Tech. Rep. FPL-GTR-113. Madison, WI: U.S. Department of Agriculture, Forest Service, Forest Products Laboratory. 463 p.
Olson, R.J., K.R. Johnson, D.L. Zheng, and J.M.O. Scurlock. 2001. Global and Regional Ecosystem Modeling: Databases of Model Drivers and Validation Measurements. ORNL Technical Memorandum TM-2001/196. Oak Ridge National Laboratory, Oak Ridge, Tennessee, U.S.A.
Westman, W. E., and R. H. Whittaker. 1975. The pygmy forest region of northern California: studies on biomass and primary productivity. Journal of Ecology 63:493-520.
Additional Sources of Information:
Brown, J.K. 1974. Handbook for inventorying downed woody material. USDA Forest Service GTR INT-16, Ogden, Utah, USA.
Fujimori, T. 1977. Stem biomass and structure of a mature Sequoia sempervirens stand on the Pacific Coast of northern California. Journal of the Japanese Forestry Society 59: 435-441.
Long, J.N. 1982. Productivity of western coniferous forests, pp. 89-125. IN: Edmonds, R.L. (ed.). Analysis of coniferous forest ecosystems in the western United States. Hutchinson Ross Publishing, Stroudsburg, Pennsylvania.
Newbould, P.J. 1967. IBP Handbook No. 2. Methods for estimating the primary production of forests. Blackwell Scientific Publishers, Oxford, UK.
Ogawa, H. 1977. Principles and methods of estimating primary production in forests, pp. 29-37. IN: Shidei T., and T. Kira (eds.). Primary Productivity of Japanese Forests. JIBP Synthesis 16. University of Tokyo Press, Tokyo, Japan.
Parks, W.H. 1952. Redwood log characteristics: log taper and bark thickness. Technical Report. California Redwood Association, San Francisco, California, USA.
Van Wagner, C.E. 1968. The line intersect method in forest fuel sampling. Forest Science 14: 20-26.