Get Data
Summary:
This data set contains four ASCII data files (.txt format), one providing net primary production (NPP) component data and three providing climate data. The NPP studies were conducted in a lowland tropical rainforest in the Pasoh Forest Reserve, Malaysia (2.98 N 102.31 E) from 1971 through 1973. Precipitation and temperature data are available from weather stations located about 25 km from the study sites.
The main part of the 2,450 ha Pasoh Forest Reserve is covered by lowland dipterocarp forest, with a core area of about 600 ha of undisturbed forest surrounded by a buffer zone of regenerating logged lowland forest. Annual rainfall ranges from 1,728 to 3,112 mm (mean 2,054 mm), which is relatively low for Malaysia, but the fairly even distribution of rain throughout the year permits the development of a typical lowland rainforest.
Annual average litterfall data (1,055 g/m2/year) are available for several sub-sites based on bi-weekly collections. An additional 300 g/m2/year of leaf production was estimated to have been consumed by insects, and large wood fall/mortality was estimated to be 370 g/m2/year. Annual tree biomass increment was determined to be 640 g/m2/year, and a further 60 g/m2/year was allowed for root increments and 400 g/m2/year for root turnover. Including additional corrections to account for wood decay before measurement, total NPP was estimated to be 2,780 g/m2/year.
Revision Notes: The NPP file for Pasoh has been revised to correct sampling dates for August 1971 litterfall collection and to add herbivory and large wood fall data. Please see the Data Set Revisions section of this document for detailed information.
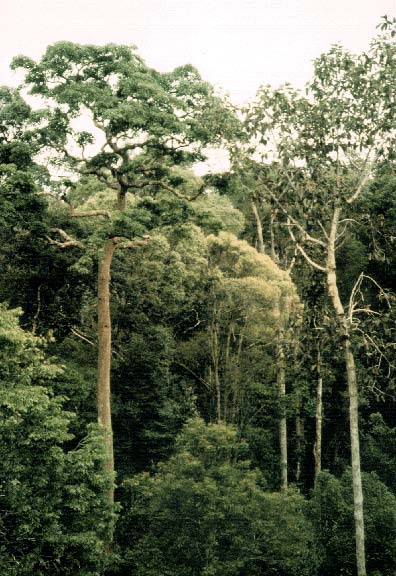
Figure 1. Profile of Pasoh Forest, seen from about 20 m above the ground. (Photograph taken 10th December 1978. Reproduced by kind permission of Prof. T. Kira, Lake Biwa Research Institute, Japan). (psh_1.jpg)
Additional Documentation:
The Net Primary Productivity (NPP) data collection contains field measurements of biomass, estimated NPP, and climate data for terrestrial grassland, tropical forest, boreal forest, and tundra sites worldwide. Data were compiled from the published literature for intensively studied and well-documented individual field sites and from a number of previously compiled multi-site, multi-biome data sets of georeferenced NPP estimates. The principal compilation effort (Olson et al., 2001) was sponsored by the NASA Terrestrial Ecology Program. For more information, please visit the NPP web site at http://daac.ornl.gov/NPP/npp_home.html.
Data Citation:
Cite this data set as follows:
Kira, T., N. Manokaran, and S. Appanah. 2013. NPP Tropical Forest: Pasoh, Malaysia, 1971-1973, R1. Data set. Available on-line [http://daac.ornl.gov] from Oak Ridge National Laboratory Distributed Active Archive Center, Oak Ridge, Tennessee, U.S.A.doi:10.3334/ORNLDAAC/219
This data set was originally published as:
Kira, T., N. Manokaran, and S. Appanah. xxxx. NPP Tropical Forest: Pasoh, Malaysia, 1971-1973, R[evision]1. Data set. Available on-line [http://daac.ornl.gov] from Oak Ridge National Laboratory Distributed Active Archive Center, Oak Ridge, Tennessee, U.S.A.
Table of Contents:
- 1 Data Set Overview
- 2 Data Description
- 3 Applications and Derivation
- 4 Quality Assessment
- 5 Acquisition Materials and Methods
- 6 Data Access
- 7 References
- 8 Data Set Revisions
1. Data Set Overview:
Project: Net Primary Productivity (NPP)
The net primary productivity measurement presented here is sum of measured and estimated above- and below-ground NPP. This estimate was calculated from the annual total accumulation of litterfall + herbivory (estimated leaf production consumed by insects) + estimated large wood mortality + tree biomass increment + root increment biomass + estimated root turnover + additional corrections to take account of wood decay before measurement.
Biomass and productivity of a lowland tropical forest in the Pasoh Forest Reserve, Malaysia, an International Biosphere Reserve under the MAB Programme, were determined in five 2-ha and five 0.2-ha plots from 1971 to 1973, under the auspices of the International Biological Programme. From 1970 to 1978, intensive research on lowland rain forest ecology and dynamics took place under a joint research project between the University of Malaya (UM) and the International Biological Programme (IBP), the UNESCO Man and Biosphere (MAB) Programme, and the joint Rainforest Research Project of the University of Malaya and the University of Aberdeen, U.K. The Pasoh research site has been managed by the Forest Research Institute of Malaysia (FRIM) since 1977.
The Pasoh Forest Reserve study site (2.98 N 102.31 E) is located about 8 km from the town of Simpang Pertang, approximately 70 km southeast of Kuala Lumpur (140 km by road). With an area of 2,450 ha, the Pasoh Forest Reserve is surrounded on three sides by oil palm plantations and joined to virgin hill dipterocarp forest on its northeastern boundary. The main part of the reserve consists of lowland dipterocarp forest of the Keruing-Meranti type, with a core area of about 600 ha of undisturbed forest surrounded by a buffer zone of regenerating logged lowland forest. Annual rainfall ranges from 1,728 to 3,112 mm (mean 2,054 mm), which is relatively low for Malaysia, but the fairly even distribution of rain throughout the year permits the development of typical lowland rainforest.
Precipitation data are available from rainfall stations about 25 km away at Jelebu and Kuala Pilah (1891-1975 and 1896-1975, respectively), and temperature data are available from Kuala Lumpur (1951-1990).
A 50-ha permanent plot was established by FRIM in 1985, in collaboration with the National Science Foundation and the Smithsonian Tropical Research Institute (Condit et al., 1999). An aluminum alloy tree-canopy walkway system supported by three towers was constructed near Pasoh Plot 1 in 1992, in a collaborative project between FRIM and the National Institute of Environmental Sciences (NIES), Japan. The height of one of the towers was extended to 52 m in 1995 to allow measurements of carbon dioxide fluxes above the tree canopy level. The plot was censused in 1987, 1990, and 1995. Tree mortality data from these censuses over an eight-year interval was 1.46% per year for all stems > or = 10 mm diameter at breast height (dbh), and 1.48% per year for stems > or = 100 mm dbh. The growth rate in all trees 500-700 mm in dbh was about 3.5 mm per year. These data are reported in Condit et al. (1999) but are not included in this data set or in the calculation of NPP below (Table 1).
In this data set, detailed bi-weekly and annual litterfall data are available for 1971-1973 from several sub-sites or "treatments"; the annual average amount 1,055 g/m2/year. An estimated additional 300 g/m2/year of leaf production is consumed by insects (based on fall of frass/feces), and large wood fall/mortality was estimated at 370 g/m2/year. Annual tree biomass increment was determined to be 640 g/m2/year, and a further 60 g/m2/year allowed for root increments and 400 g/m2/year for root turnover. Including additional corrections to take account of wood decay before measurement, total above- plus below-ground NPP was estimated to be 2,780 g/m2/year (Kira, 1978).
ANPP, BNPP, and TNPP values are also reported in DeAngelis (1981, 1997), Esser (1998), Olson et al. (2012a, b), Scurlock and Olson (2012), and Clark et al. (2001a, b). Some of these values differ from the values presented herein due to different calculation methods (Table 1).
Table 1. ANPP, BNPP, and TNPP values reported by various published data sources
| File Name or Description | Data Source(s) | Sub-Site | ANPP | BNPP | TNPP |
|---|---|---|---|---|---|
| gC/m2/year | |||||
| psh_npp_r1.txt | Kira (1978)1
|
psh none (average of several sub-sites)
|
1,160 | 230 | 1,390 |
| woodland.txt | DeAngelis et al. (1981, 1997)2 |
# 45 (Pasoh, West Malaysia) |
865 | NA | NA |
| ods_xls.csv | Esser (1998) based on Kira (1978) |
# 749 |
1,057 | 277 | 1,334 |
NPP_Multibiome_EnvReview | Scurlock and Olson (2012) based on Kira (1978) |
psh (average of several sub-sites) |
1,160 | 230 | 1,390 |
| GPPDI_ClassA_NPP_162_R2.csv | Olson et al. (2012a); Clark et al. (2001a)3 based on Kira (1978) |
Class A 34 (MI 37) |
880 | 615 | 1,495
|
| EMDI_ClassA_NPP_81_R2.csv | Olson et al. (2012b); Clark et al. (2001a)3 based on Kira (1978) |
Class A 34 |
|||
| Table 1 in Clark et al. (2001a) | Clark et al. (2001a)3 based on Kira (1978) |
Malaysia: Pasoh |
800 | 180-1,060 (av 620) | 1,060-1,940 (av 1,500) |
| Appendix A in Clark et al. (2001a) | Clark et al. (2001a) based on Esser (1998) based on Kira (1978) |
Pasoh Forest Reserve |
1,060 | 280 | 1,330 |
Clark et al. (2001a) based on Raich et al. (1991)4 |
NA | NA | 1,370 |
||
Clark et al. (2001a) based on Vogt et al. (1996)5 |
NA | NA | 700 |
||
Clark et al. (2001a)3 based on that study |
NA | NA | 1,500 |
||
| tropfornpp.csv | Clark et al. (2001b)6 based on Kira (1978) |
Malaysia-Pasoh |
910 | NA | NA |
Notes: NA = Not available. The differences in NPP values reported in this table are mainly due to differences in calculation methods, as explained in these notes. Please consult original references for details. Revised data sets (R1, R2, etc) are accompanied by ORNL DAAC Data Set Change Information files. Please see the corresponding documentation for reasons why the data values were revised. 1For this table, NPP data from the original data source were converted from grams of dry weight per meter square per year to grams of carbon per meter square per year using a conversion factor of 0.5. The NPP estimates are based on field measurement of total litterfall accumulation, biomass increment, herbivory, large wood fall/mortality, root increment, and root turnover. Corrections for wood decay before measurements are also taken into account. 2Based on field measurements of litterfall (leaf + flower/fruit + branch + bole + frass), converted from grams of dry weight per meter square per year to grams of carbon per meter square per year using a conversion factor of 0.5.3Clark et al. (2001a) used a different approach to calculate net primary production values. ANPP was calculated by summing reported above-ground biomass increment + reported fine litterfall + estimated losses to consumers + estimated VOC emissions. BNPP was calculated by summing 0.2 x estimated ANPP for a low BNPP estimate + 1.2 x estimated ANPP for a high BNPP estimate. TNPP was calculated as the range between the low and high values of ANPP + BNPP. Average BNPP and TNPP estimates were also calculated. See Clark et al. (2001a) for a discussion of calculation methods, including how unmeasured components of ANPP were estimated and the basis for setting bounds on BNPP. 4Based on ANPP in DeAngelis et al. (1981, 1997), annual litterfall, and annual soil respiration. Fine root production is 50% of the difference between annual soil respiration (Ogawa, 1978) and annual litterfall. 5Based on ANPP in DeAngelis et al. (1981, 1997). 6ANPP estimate is the sum of litterfall + branch fall + above-ground biomass increment.
2. Data Description:
Spatial Coverage
Site: Pasoh, Malaysia
Site Boundaries: (All latitude and longitude given in decimal degrees)
| Site (Region) | Westernmost Longitude | Easternmost Longitude | Northernmost Latitude | Southernmost Latitude | Elevation (m) |
|---|---|---|---|---|---|
| Pasoh, Malaysia | 102.31 | 102.31 | 2.98 | 2.98 | 100 |
Site Information
This study was conducted in the Pasoh Forest Reserve in the interior portion of Negeri Sembilan amidst a broad expanse of flat lands and gently rolling ridges that abut the westward side of the Main Range in the western portion of Malaysia. Like most of the far-eastern equatorial tropics, Pasoh has an aseasonal climate and is evergreen. Prior to 1900, this south-central portion of the Malay Peninsula comprised nearly 100,000 ha of relatively unbroken forest. The plot is situated in the last remnant of that forest, a primary lowland dipterocarp forest with an altitude to 100 meters above sea level. The Pasoh Forest Reserve study site (2.98 N 102.31 E) is located about 8 km from the town of Simpang Pertang, approximately 70 km southeast of Kuala Lumpur (140 km by road). Various characteristics of this site have been described by Ashton (1976), Richards (1978), Soepadmo and Kira (1977), and Soepadmo (1978).
Pasoh Forest Reserve was much larger prior to 1970; i.e., before many of the southern compartments were converted to plantations of oil palm. Today, the reserve is about 2,450 ha in size. The southernmost 2,000 ha are administered by FRIM as a Research Centre, and are divided into three portions: a core of 650 ha of primary lowland forest that lies between 80 and 120 m above sea level; a buffer zone of 30-yr-old selectively logged forest on three sides of the core; and a primary hill forest on the western side of the core rising to an elevation of about 500 m. The main part of the reserve consists of lowland dipterocarp forest of the red meranti-keruing type, with a core area of about 600 ha of undisturbed forest surrounded by a buffer zone of regenerating logged lowland forest. The upper canopy is dominated by red meranti, Shorea section Muticae, especially S. leprosula Miq., S. acuminata Dyer, and S. macroptera Dyer. Other important canopy emergents are the Keruing (teak), Dipterocarpus cornutus Dyer, the Balau, Shorea maxwelliana King, and the Chengal, Neobalanocarpus heimii (King) Ashton. Annual rainfall ranges from 1,728 to 3,112 mm (mean 2,054 mm), which is relatively low for Malaysia, but the fairly even distribution of rain throughout the year permits the development of typical lowland rainforest.
As the boundaries of the reserve receded during the past decades, many of the species of larger mammals declined in number or disappeared altogether. The avifauna is mostly intact and characteristic for the habitat.
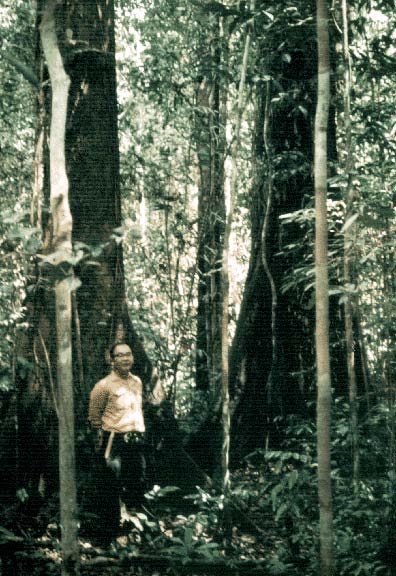
Figure 2. View inside the undisturbed part of the Pasoh Forest Reserve. (The two large tree trunks in the foreground are Shorea laevis [left] and Balanocarpus heimii [right]. Photograph taken 14th May 1968. Reproduced by kind permission of Prof. T. Kira, Lake Biwa Research Institute, Japan). (psh_3.jpg)
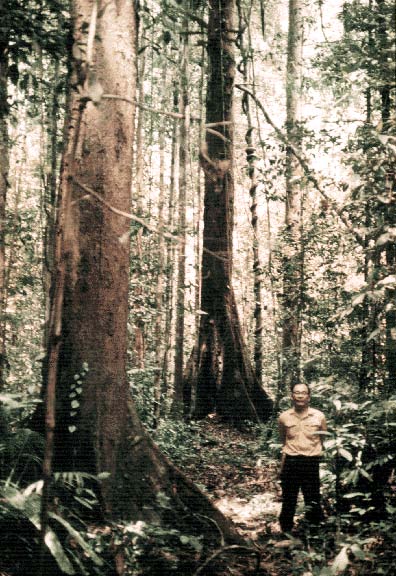
Figure 3. Another view inside the undisturbed part of the Pasoh Forest Reserve. (The two buttressed tree trunks in the foreground are Dipterocarpus cornutus [left] and Dipterocarpus maxwelliana [right]. Photograph taken 14th May 1968. Reproduced by kind permission of Prof. T. Kira, Lake Biwa Research Institute, Japan). (psh_4.jpg)
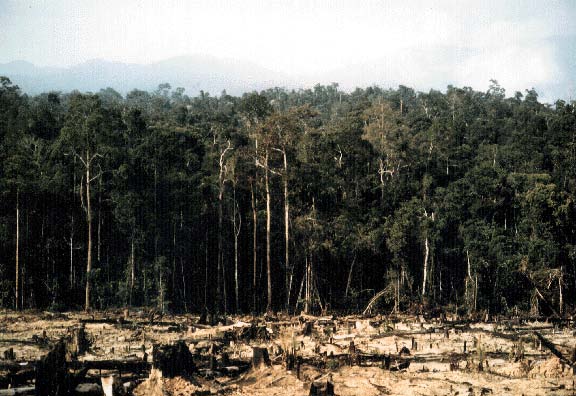
Figure 4. Pasoh Forest Reserve, seen from an adjacent area recently burned for an oil palm plantation. (The forest in view represents part of the buffer zone surrounding the Reserve, which had been selectively logged previously. Photograph taken 11th May 1972. Reproduced by kind permission of Prof. T. Kira, Lake Biwa Research Institute, Japan). (psh_2.jpg)
Spatial Resolution
The Plot I destructive biomass sampling area was 20 m x 100 m in size. The pre-Plot destructive biomass study area was 20 m x 50 m in size. Biomass increments were measured in a 40 m x 200 m strip (including the end destructive plot) in Plot I. Litterfall was collected in 1 m2 litter traps (Gong, 1982); round litter-receiving funnels with a mouth area of 1 m2 (Ogawa, 1978); and 50 randomly placed in 1 m2 litter trays (Lim, 1978). Accumulation of Ao litter was based on the average of 30 samples collected each from 4 m2 quadrats (Owaga, 1978).
Temporal Coverage
Biomass measurements were made in 1971 (Ogawa, 1978; Kato et al., 1978). Biomass increment measurements were made between 1971 and 1973 over a 1.9-year period. Litterfall was collected from March 17, 1971 to August 22, 1971 (Gong, 1982), May 25, 1971 to January 28, 1973 (Ogawa, 1978), and 1972-1973 (Lim, 1978). Litter on the forest floor was collected 1971-1973. LAI measurements were made in March 1971.
Climate data are available from 1891/01/01 through 1990/12/31.
Temporal Resolution
Biomass measurements were made by destructive sampling on one occasion each at two plots. Biomass increment measurements were made periodically at half-year intervals. Litterfall was collected at intervals ranging from six to sixteen days in 1971 (Gong, 1982) and weekly (Ogawa, 1978; Lim, 1978). Accumulated litter on the forest floor was collected monthly. All NPP estimates are based on plant dry matter accumulation, expressed as g/m2/year (dry matter weight).
Climate data are expressed as monthly and annual precipitation amounts (mm) and monthly and annual average maximum/minimum temperature (C). Monthly and annual climatic means are provided for several time periods.
Data File Information
Table 2. Data files in this data set archive
FILE NAME |
FILE SIZE |
TEMPORAL COVERAGE | FILE CONTENTS |
psh_npp_r1.txt |
12 KB |
1971/03/17-1973/01/22 | Above- and below-ground biomass, LAI, litterfall, and nutrient concentration data for Pasoh, Malaysia |
psh1_cli.txt |
12 KB |
1891/01/01-1975/12/31 | Mean monthly and annual precipitation data from weather station at Jelebu, Malaysia near Pasoh, Malaysia |
psh2_cli.txt |
12 KB |
1896/01/01-1975/12/31 | Mean monthly and annual precipitation data from weather station at Kuala Pilah, Malaysia near Pasoh, Malaysia |
psh3_cli.txt |
8 KB |
1951/01/01-1990/12/31 | Monthly and annual average temperature data from weather station at Kuala Lumpur, Malaysia near Pasoh, Malaysia |
NPP Data. NPP estimates for the Pasoh, Malaysia site are provided in one file (Table 2). The data set is an ASCII file (.txt format). The variable values are delimited by semi-colons. The first 18 lines are metadata; data records begin on line 19. The values -999.9 is used to denote missing values. Biomass and NPP units are in g/m2 and g/m2/year (dry matter weight), respectively.
Table 3. Column headings in NPP files
COLUMN HEADINGS |
DEFINITION |
UNITS |
Site |
Site where data were gathered (code refers to site identification) | Text |
Treatmt |
Study area where measurements were made (see definitions in Table 3); long term management of site is described in metadata of data file | Text |
Year |
Year in which data were collected | Numeric |
Month |
Month in which data were collected | |
Day |
Day on which data were collected | |
parameter |
Parameters measured (see definitions in Table 4) | Text |
amount |
Data values | Numeric |
| units | Unit of measure | Text |
Table 4. Study site definitions in NPP file
STUDY SITE |
DEFINITION |
none |
Presumably Plots 4 and 16 as per Gong (1982) |
plot4/16 (Lim, 1978) |
Plots 4 and 16 in the 1 ha Pasoh study area which had been partially cleared of some undergrowth |
plot_I (Ogawa, 1978) |
On the outer fringe of Plot I (100 m x 200 m in size) |
pre-plot |
Preliminary destructive sampling (20 m x 50 m) located on a flat ridge near the southeastern end of the peninsular part of Pasoh Research Area to the southeast of Plot I |
plot_I (Kato et al, 1978) |
Plot I (20 m x 100 m plot) in north-western part of Pasoh Research Area |
Woodlands |
Information not available |
Table 5. Parameter definitions in NPP files
PARAMETER |
DEFINITION |
UNITS |
SOURCE |
leaflittfall |
Mean daily leaf litterfall for sixteen collection periods (March - August, 1971) | g/m2/day |
Table 1, Gong (1982) |
Totlittfall |
Mean daily total litterfall [leaf and non-leaf (fruits, twigs, insect body parts, frass etc.) excluding branches and trees] for sixteen collection periods (March - August, 1971) | ||
leaflittfall |
Annual leaf litterfall in 1971 (extrapolated from a five month study) | g/m2/year |
Table 1, Gong (1982) |
Totlittfall |
Annual total litterfall in 1971 (extrapolated from a five month study) | ||
leaflittfall |
Leaf litterfall (dead leaves) (Plot4/16; 1972 & 1973) | g/m2/year |
Table 1, Lim (1978) |
woodlittfall |
Wood litterfall (twigs) (Plot4/16; 1972 & 1973) | ||
otherlittfall |
Other litterfall (scales and bracts, fruits and flowers and other small unidentifiable material including some insect frass which may come down with the leaves that fall on to the forest floor) (Plot4/16; 1972 & 1973) | ||
Totlittfall |
Total annual litterfall (sum of above) (Plot4/16; 1972 & 1973) | g/m2/year |
Table 1, Ogawa (1978) |
leaflittfall |
Leaf litterfall (Plot_I; 1971-1973) | g/m2/year |
Table 1, Ogawa (1978) |
woodlittfall |
Wood litterfall (branches & twigs) (Plot_I; 1971-1973) | ||
frasslittfall |
Litterfall of insect bodies and feces (Plot_I; 1971-1973) | ||
otherlittfall |
Other litterfall (bark, bud scale and bracts, fruits, flowers, and seeds, and other small unidentifiable material (Plot_I; 1971-1973) | ||
Totlittfall |
Total annual litterfall (sum of above) (Plot_I; 1971-1973) | ||
trunks |
Stem (trunk) biomass by destructive harvest (pre_plot & Plot_1; 1971) | g/m2 |
Table 1, Kato et al. (1978) |
branches |
Branch biomass by destructive harvest (pre_plot & Plot_I; 1971) | ||
leaves |
Leaf biomass (trees and lianas only) by destructive harvest (pre_plot & Plot_I; 1971) | g/m2 |
Table 1, Kato et al. (1978); p. 368, Ogawa (1978) |
climbers |
Biomass of lianas (climbers) by destructive harvest (Plot_I; 1971) | g/m2 |
Table 1, Kato et al. (1978) |
Undstory |
Leaf and other biomass of understory strata by destructive harvest (pre_plot & Plot_I; 1971) | ||
AGbiomass |
Total above-ground biomass by destructive harvest (sum of above) (pre_plot & Plot_1; 1971; note: there are no biomass values for lianas on pre_plot) | ||
LAI_trees |
Leaf area index of trees (pre_plot & Plot_I; 1971) | m2/m2 | |
LAI_others |
Leaf area index of other vegetation (understory on pre_plot & Plot_I; understory + lianas on Plot_1; 1971) | ||
LAI |
Total leaf area index (sum of above; pre_plot & Plot_I; 1971) | ||
trunk_incr |
Biomass increment of trunks of all trees (> 4.5 cm dbh) on destructive sampling plot (Plot_I), calculated from census of dbh in 1971 and 1973; time interval 1.9 years. | g/m2/year | Table 3, Kato et al. (1978) |
branch_incr |
Biomass increment of branches of all trees (> 4.5 cm dbh) on destructive sampling plot (Plot_I), calculated from census of dbh in 1971 and 1973; time interval 1.9 years. | ||
leaves_incr |
Biomass increment of leaves of all trees (> 4.5 cm dbh) on destructive sampling plot (Plot_I), calculated from census of dbh in 1971 and 1973; time interval 1.9 years. | ||
Agbiomass_incr |
Total biomass increment of all trees (> 4.5 cm dbh) on destructive sampling plot (Plot_I), calculated from census of dbh in 1971 and 1973; time interval 1.9 years. | Table 3, Kato et al. (1978); Table 1, Kira (1978) |
|
LAI_trees |
LAI increment of all trees (> 4.5 cm dbh) on destructive sampling plot (Plot_I), calculated from census of dbh in 1971 and 1973; time interval 1.9 years. | m2/m2/year | Table 3, Kato et al. (1978) |
herbivory |
Herbivory rate (grazing by caterpillars, assuming efficiency of assimilation at 13%) | g/m2/year | Table 1, Kira (1978) |
lg_wood_fall |
Large woody litter (>10 cm dia.) after decomposition (before decomposition estimated to be 1,610 g/m2/year) | g/m2/year | Table 1, Kira (1978) |
deadwood |
Dead wood litter on ground surface | g/m2 | p. 369, Ogawa (1978) |
branchlitter |
Branch wood litter on ground surface | ||
leaflitter |
Leaf litter on ground surface | ||
otherlitter |
Other litter on ground surface | ||
AGtotdead |
Total litter on ground surface | ||
fineroots |
Fine root biomass | g/m2 | Yoda and Kira (1969) in Kato et al. (1978), Owawa (1978) |
leaflitter-N |
Nitrogen content in leaf litterfall (Plot 4/16; 1972 & 1973) | percent | Table 3, Lim (1978) |
Totlitter-N |
Nitrogen content in total litterfall (leaves, scales and bracts, fruits and flowers and other small unidentifiable material including some insect frass which may come down with the leaves that fall on to the forest floor) (Plot 4/16; 1972 & 1973) | ||
leaflitter-P |
Phosphorus content in leaf litterfall (Plot 4/16; 1972 & 1973) | ||
Totlitter-P |
Phosphorus content in leaf litterfall (leaves, scales and bracts, fruits and flowers and other small unidentifiable material including some insect frass which may come down with the leaves that fall on to the forest floor) (Plot 4/16; 1972 & 1973) | ||
leaflitter-K |
Potassium content in leaf litterfall (Plot 4/16; 1972 & 1973) | ||
Totlitter-K |
Potassium content in leaf litterfall (leaves, scales and bracts, fruits and flowers and other small unidentifiable material including some insect frass which may come down with the leaves that fall on to the forest floor) (Plot 4/16; 1972 & 1973) |
Note: Information about other parameters and data values in this data file is not available [i.e., LAI and litterfall (1972); woodlands site biomass, LAI, litterfall, and biomass increment (1971-1972) and Plot_I nutrient content in litter components (1973)].
Sample NPP Data Record
Site; Treatmt; Year; Month; Day; parameter; amount; units psh; none; 1971; 3; 17; leaflittfall; -999.9; g/m2/day |
Climate Data. Climate data for the Pasoh, Malaysia site are provided in three files (Table 2).The climate data sets are ASCII files (.txt format). The first 18 lines are metadata; data records begin on line 19. The variable values are delimited by semi-colons. The value -999.99 is used to denote missing values.
Sample Climate Data Record <psh1_cli.txt>
parameter year Jan Feb Mar Apr May June July Aug Sept Oct Nov Dec Total/Avg parameter year Jan Feb Mar Apr May June July Aug Sept Oct Nov Dec Total/Avg prec 1891 151.40 74.73 95.83 195.80 131.63 41.43 25.43 137.40 53.13 289.33 230.63 91.93 1518.7 Where, |
Sample Climate Data Record <psh2_cli.txt>
parameter year Jan Feb Mar Apr May June July Aug Sept Oct Nov Dec Total/Avg parameter year Jan Feb Mar Apr May June July Aug Sept Oct Nov Dec Total/Avg prec 1896 18.80 250.70 189.20 274.33 103.40 70.43 55.90 128.50 115.13 199.60 306.10 278.40 1990.5 Where, |
Sample Climate Data Record <psh3_cli.txt>
parameter year Jan Feb Mar Apr May June July Aug Sept Oct Nov Dec Total/Avg parameter year Jan Feb Mar Apr May June July Aug Sept Oct Nov Dec Total/Avg tavg 1951 25.20 25.40 26.70 26.60 26.60 27.20 26.00 26.60 26.10 26.00 26.10 26.30 26.2 Where, |
3. Data Application and Derivation:
The accumulation of biomass, or NPP, is the net gain of carbon by photosynthesis that remains after plant respiration. While there are many fates for this carbon, this data set accounts for above-ground NPP (annual litterfall + leaf herbivory + large wood fall and mortality + annual tree biomass increment + correction for wood decay) and below-ground NPP (root increment + root turnover). These are considered the major components of total NPP.
The tropical forest biomass dynamics data for the Pasoh site are provided for comparison with models and estimation of NPP. Climate data are provided for use in driving ecosystem/NPP models.
4. Quality Assessment:
Annual leaf and total litterfall in 1971 in the primary forest at Pasoh was extrapolated from a short five month study (Gong, 1982). Nonetheless, these values lie within the range of values obtained in other lowland rainforests by various authors, including Ogawa (1978) for 1971-1973 in Pasoh Plot I and Lim (1978) for 1972 and 1973 at the same Pasoh study site as Gong (1982).
Kira (1978) used three methods of assessing productivity of the Pasoh Forest Reserve (harvest method, canopy photosynthesis method, and micrometeorological method). The results of these different methods did not agree closely, but they suggest a range of net primary productivity of 2,500-5,000 g/m2/year and that of gross primary productivity of 7,000-10,000 g/m2/year. These ranges seem somewhat lower than the peak net productivity known so far in Malaysian rubber and oil palm plantations, but they are not inconsistent with data on growth rates from Malaysian forests and tree plantations.
Lim (1978) compared litterfall and bio-element concentrations in litter from Pasoh with production data from other tropical forests (Kade, Ghana; Manaus, Brazil; and Colombia). The values for Pasoh were in the mid-range among the sites, except for nitrogen content which was lower.
Kato et al. (1978) compared biomass and mean canopy height of Pasoh forest with data from other tropical forests in southeast Asia (Khao Chong, S. Thailand; Cheko, SW Cambodia). The values were comparable.
The only data available for comparison of biomass increment were obtained in Khao Chong rainforest (Thailand) where Kira et al. (1967) estimated the net above-ground biomass increment rate at 490 g/m2/year, somewhat lower than measured at Pasoh.
Sources of Error
Information not available.
5. Data Acquisition Materials and Methods:
Litterfall. Litterfall was measured on various occasions at several study sites in the Pasoh Forest Reserve.
- Gong (1982). Litter was collected at intervals (ranging from six to sixteen days) from March to August 1971 from six 1 m2 litter trays. The litter was sorted into leaf and non-leaf fractions (fruits, twigs, insect body parts, frass, etc.), and the fractions from each litter tray were dried separately at 105 C and weighed.
- Ogawa (1978). The rate of litterfall was observed from May 1971 to February 1974 using 30 round litter-receiving funnels with a mouth area of 1 m2 regularly distributed along the outer fringe of Plot I (100 m x 200 m) in Pasoh Research Area. Accumulating litter was collected weekly and sorted into 9 fractions (leaves, branches, bark, flowers, fruit and seed, budscale and bract, insect bodies, insect feces, and miscellaneous other). Fractions were oven-dried and weighed separately.
- Lim (1978). Litterfall was collected weekly from 50 randomly placed in 1 m2 litter trays along the main path in the forest and in Plots 4/16 in the 1 ha plot which has been partially cleared of some undergrowth. Litter was sorted into the different fractions of leaves, twigs, bracts and scales, fruits and flowers, and miscellaneous items, dried at 105 C, and weighed.
Biomass and LAI (Kato et al., 1978). The sampling was started with the clipping of ground layer vegetation (< 1. 3 m in height), proceeding successively to larger trees. Trees were felled one by one, above-ground height and trunk diameters measured immediately after felling, and the whole shoot was then separated into layers of 5 m depth perpendicular to the bole according to the so-called stratified clip technique. Fresh weights of trunk, branches, and leaves in respective strata were separately measured. Oven-dry weight, wood volume and bulk density, leaf area, etc. were later determined with small samples taken from every tree, every component, and every strata.
Biomass Increment (Kato et al., 1978). Stem diameter increments in all trees over 10 cm diameter in a 40 m x 200 m strip (including the end destructive sampling plot) in Plot I were periodically measured at about half-year intervals. The girth was measured with a diameter tape to obtain diameter readings directly at three different heights above the ground (1.23 m, 1.30 m, and 1.37 m) and the mean of the three readings was taken as dbh. This procedure was useful to check errors unavoidable in the girth measurement. In the case of big buttressed stems, the diameter just above the upper end of plank buttress was conventionally substituted for dbh. For smaller trees, dbh increments were also measured on a few plots of smaller area.
Litter Accumulation (Owaga, 1978). The accumulation of Ao litter was also estimated monthly based on 30 samples collected each from a 4 m2 quadrat.
Nutrients in Litterfall (Lim, 1978). Subsamples from litterfall collections described above were taken and ground for analysis. Nitrogen was determined by the Micro Kjeldahl method and ash content by ashing at 600 C. Stock solutions were made from the ash with concentrated HCL. Solutions were diluted appropriately to determine the potassium calcium and magnesium content with an atomic absorption spectrophotometer. Phosphorus was determined by the molybdate/stannous chloride method.

Figure 5. Clear-felling a 20 m x 100 m plot [Stand 1] at the Pasoh Forest Reserve. (Photograph taken 19th April 1973. Reproduced by kind permission of Prof. T. Kira, Lake Biwa Research Institute, Japan). (PSH5-1.gif)

Figure 6. Pasoh Forest: the clear-felled plot [to the right of the standing man], five years after clearance. (Note the vigorous growth of pioneer tree species. Photograph taken 10th December 1978. Reproduced by kind permission of Prof. T. Kira, Lake Biwa Research Institute, Japan). (PSH6-1.gif)

Figure 7. Typical profile of Stand 1, exposed by clear-felling at Pasoh Forest. (The central emergent tree is Dipterocarpus cornutus, about 45 m tall. Photograph taken 1st April 1973. Reproduced by kind permission of Prof. T. Kira, Lake Biwa Research Institute, Japan). (PSH7-1.gif)
6. Data Access:
This data set is available through the Oak Ridge National Laboratory (ORNL) Distributed Active Archive Center (DAAC).
Data Archive:
Web Site: http://daac.ornl.gov
Contact for Data Center Access Information:
E-mail: uso@daac.ornl.gov
Telephone: +1 (865) 241-3952
7. References:
Gong, W.K. 1982. Leaf litter fall, decomposition and nutrient element release in a lowland dipterocarp forest. Malaysian Forester 45: 367-378.
Kira, T. 1978. Primary productivity of Pasoh Forest - a synthesis. Malaysian Nature Journal 30: 291-297.
Lim, M.S. 1978. Litterfall and mineral nutrient content of litter in Pasoh Forest Reserve. Malayan Nature Journal 30: 375 - 80.
Ogawa, H. 1978. Litter production and carbon cycling in Pasoh forest. Malaysian Nature Journal 30: 367-373.
Olson,
R. J., K.R. Johnson, D.L.
Zheng, and J.M.O.
Scurlock. 2001. Global and Regional Ecosystem Modeling: Databases of
Model
Drivers and Validation Measurements. ORNL Technical Memorandum
TM-2001/196.
Yoda, K, and T. Kira 1969. Comparative ecological studies on three main types of forest vegetation in Thailand. V. Accumulation and turnover of organic matter. Nature and Life in SE Asia 6: 83-109.
Additional Sources of Information:
Clark, D. A., S. Brown, D. W. Kicklighter, J. Q. Chambers, J. R. Thomlinson, J. Ni, and E. A. Holland. 2001a. Net primary production in tropical forests: an evaluation and synthesis of existing field data. Ecological Applications, 11(2): 371-384.
Clark, D.A., S. Brown, D.W. Kicklighter, J.Q. Chambers, J.R. Thomlinson, J. Ni, and E.A. Holland. 2001b. NPP Tropical Forest: Consistent Worldwide Site Estimates, 1967-1999. Data set. Available on-line [http://daac.ornl.gov] from the Oak Ridge National Laboratory Distributed Active Archive Center, Oak Ridge, Tennessee, U.S.A. doi:10.3334/ORNLDAAC/616
DeAngelis, D.L., R.H. Gardner, and H.H. Shugart. 1981. Productivity of forest ecosystems studied during the IBP: the woodlands data set, pp. 567-672. IN: Reichle, D.E. (ed.). Dynamic Properties of Forest Ecosystems, IBP 23. Cambridge University Press, Cambridge. 683 p.
DeAngelis, D.L., R.H. Gardner, and H.H. Shugart. 1997. NPP Multi-Biome: Global IBP Woodlands Data, 1955-1975. Data set. Available on-line [http://www.daac.ornl.gov] from Oak Ridge National Laboratory Distributed Active Archive Center, Oak Ridge, Tennessee, U.S.A. doi:10.3334/ORNLDAAC/198
Condit, R., P.S. Ashton, N. Manokaran, J.V. LaFrankie, S.P. Hubbell, and R.B. Foster. 1999. Dynamics of the forest communities at Pasoh and Barro Colorado: comparing two 50-ha plots. Philos Trans R Soc Lond B Biol Sci. 354(1391): 1739-1748.
Esser, G. 1998. NPP Multi-Biome: Global Osnabrück Data, 1937-1981. Data set. Available on-line [http://daac.ornl.gov] from Oak Ridge National Laboratory Distributed Active Archive Center, Oak Ridge, Tennessee, U.S.A. doi:10.3334/ORNLDAAC/214
Kazuhiko HOSHIZAKI, Kaoru NIIYAMA, Katsuhiko KIMURA, Tamon YAMASHITA, Yukiko BEKKU, Toshinori OKUDA, Eng Seng QUAH and Nur SUPARDI M. Noor. 2004. Temporal and spatial variation of forest biomass in relation to stand dynamics in a mature, lowland tropical rainforest, Malaysia. Ecological Research, Volume 19(3): 357-363.
Okuda, T., N. Manokaran, Y. Matsumoto, K. Niiyama, S.C. Thomas, and P.S. Ashton (Eds.). 2003. Pasoh: Ecology of a Lowland Rain forest in Southeast Asia. Springer-Verlag, Tokyo. 628 pp.
Olson, R.J., J.M.O. Scurlock, S.D. Prince, D.L. Zheng, and K.R. Johnson (eds.). 2012a. NPP Multi-Biome: Global Primary Production Data Initiative Products, R2. Data set. Available on-line [http://daac.ornl.gov] from the Oak Ridge National Laboratory Distributed Active Archive Center, Oak Ridge, Tennessee, U.S.A. doi:10.3334/ORNLDAAC/617
Olson, R.J., J.M.O. Scurlock, S.D. Prince, D.L. Zheng, and K.R. Johnson (eds.). 2012b. NPP Multi-Biome: NPP and Driver Data for Ecosystem Model-Data Intercomparison, R2. Data set. Available on-line [http://daac.ornl.gov] from the Oak Ridge National Laboratory Distributed Active Archive Center, Oak Ridge, Tennessee, U.S.A. doi:10.3334/ORNLDAAC/615
Raich, J.W., E.B. Rastetter, J.M. Melillo, D.W. Kicklighter, P.A. Steudler, B.J. Peterson, A.L. Grace, B. Moore III, and C.J. Vörösmarty. 1991. Potential net primary productivity in South America: Application of a global model. Ecological Applications 1: 399-429.
Scurlock, J.M.O., and R J. Olson. 2002. Terrestrial net primary productivity - A brief history and a new worldwide database. Environ. Rev. 10(2): 91-109. doi:10.1139/a02-002
Scurlock, J.M.O., and R.J. Olson. 2012. NPP Multi-Biome: Grassland, Boreal Forest, and Tropical Forest Sites, 1939-1996, R1. Data set. Available on-line [http://daac.ornl.gov] from Oak Ridge National Laboratory Distributed Active Archive Center, Oak Ridge, Tennessee, U.S.A. doi:10.3334/ORNLDAAC/653
Vogt, K.A., D.J. Vogt, P.A. Palmiotto, P. Boon, J. O'Hara, and H. Asbjornsen. 1996. Review of root dynamics in forest ecosystems grouped by climate, climatic forest type and species. Plant and Soil 187: 159-219.
8. Data Set Revisions
Revision Summary:
The temporal coverage of leaf litterfall and total litterfall collection in the data file (psh_npp.txt) was updated with information found in the primary literature (Gong, 1982). Herbivory and large wood fall data were added from Kira (1978).
All other NPP values in the data file are not affected.
Data File Changes:
Several data collection dates have been revised, and some data values and references have been added.
|
Uncorrected in psh_npp.txt
|
Corrected in psh_npp_r1.txt
|
leaflittfall (1971) (g/m2/day) |
07/01
|
08/01
|
leaflittfall (1971) (g/m2/day) |
07/08
|
08/08
|
leaflittfall (1971) (g/m2/day) |
07/15
|
08/15
|
leaflittfall (1971) (g/m2/day) |
07/22
|
08/22
|
Totlittfall (1971) (g/m2/day) |
07/01
|
08/01
|
Totlittfall (1971) (g/m2/day) |
07/08
|
08/08
|
Totlittfall (1971) (g/m2/day) |
07/15
|
08/15
|
Totlittfall (1971) (g/m2/day) |
07/22
|
08/22
|
Herbivory (g/m2/year) |
**
|
30
|
Fall of big wood (g/m2/year) |
**
|
370
|
Notes: ** not reported.
No existing data values have been changed. The data values
in the revised data file (psh_npp_r1.txt) are correct.
Cited References:
Gong, W.K. 1982. Leaf litter fall, decomposition and nutrient element release in a lowland dipterocarp forest. Malaysian Forester 45: 367-378.
Kira, T. 1978. Primary productivity of Pasoh Forest - a synthesis. Malaysian Nature Journal 30: 291-297.
Data User Action: If you downloaded this data set from the ORNL DAAC online-archive before 10/15/2013, you should download it again.
Revision History:
Original Citation:
Kira, T., N. Manokaran, and S. Appanah. 1998. NPP Tropical Forest: Pasoh, Malaysia, 1971-1973. Data set. Available on-line [http://daac.ornl.gov] from Oak Ridge National Laboratory Distributed Active Archive Center, Oak Ridge, Tennessee, U.S.A.