Get Data
Summary:
This data set provides three data files in text format (.txt). One file contains a long time series of monthly biomass measurements and net primary productivity (NPP) estimates made between July 1984 and November 1994 on an ungrazed tropical dry savanna grassland in the Nairobi National Park, Kenya. The second file contains a shorter time series (October 1989-June 1991) of monthly biomass measurements made on an adjacent savanna that had been clipped in September 1989. The third file contains monthly and annual climate data for the study site for the period 1969-1989.
Measurements of above-ground live phytomass, standing dead, and litter biomass were made on the 15th day of each month on the ungrazed grassland over the time series (except during 1987 and at a few other times). The time series for below-ground biomass (BNPP) measurements (live and dead) is more discontinuous with large gaps in 1987-1989. NPP estimates are only available for part of 1984 through 1986 on the ungrazed savanna. The above-ground NPP (ANPP) values averaged 1,004 g/m2/yr and BNPP averaged 875 g/m2/yr. The record of above- and below-ground biomass measurements for the clipped savanna is complete except for a few months in 1990.
This work was carried out under the United Nations Environment Programme (UNEP) Project on "Primary Productivity and Photosynthesis of Semi-Natural Ecosystems of the Tropics and Sub-tropics" and continued under subsequent UNEP and UK-ODA sponsored international projects.
Revision Notes: Only the documentation for this data set has been modified. The data files have been checked for accuracy and are identical to those originally published.
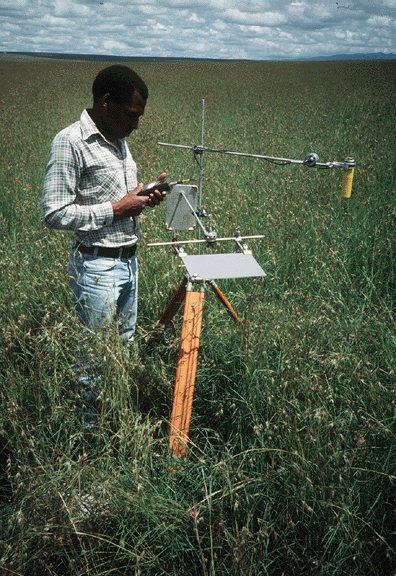
Figure 1. Canopy reflectance measurement within the Nairobi grassland site, Kenya. (Prof. Jenesio Kinyamario, University of Nairobi, is using a red/near-infrared spectral ratio meter. Photograph taken May 1986 by Dr. J.M.O. Scurlock, ORNL).
Additional Documentation
The NPP data collection contains field measurements of biomass, estimated NPP, and climate data for terrestrial grassland, tropical forest, temperate forest, boreal forest, and tundra sites worldwide. Data were compiled from the published literature for intensively studied and well-documented individual field sites and from a number of previously compiled multi-site, multi-biome data sets of georeferenced NPP estimates. The principal compilation effort (Olson et al., 2001) was sponsored by the NASA Terrestrial Ecology Program. For more information, please visit the NPP web site at http://daac.ornl.gov/NPP/npp_home.shtml.
Data Citation:
Cite this data set as follows:
Kinyamario, J.I. 2015. NPP Grassland: Nairobi, Kenya, 1984-1994, R1. Data set. Available on-line [http://daac.ornl.gov] from Oak Ridge National Laboratory Distributed Active Archive Center, Oak Ridge, Tennessee, USA. http://dx.doi.org/10.3334/ORNLDAAC/151
This data set was originally published as:
Kinyamario, J.I. 1996. NPP Grassland: Nairobi, Kenya, 1984-1994. Data set. Available on-line [http://daac.ornl.gov] from Oak Ridge National Laboratory Distributed Active Archive Center, Oak Ridge, Tennessee, U.S.A.
Table of Contents:
- 1 Data Set Overview
- 2 Data Description
- 3 Applications and Derivation
- 4 Quality Assessment
- 5 Acquisition Materials and Methods
- 6 Data Access
- 7 References
1. Data Set Overview:
Project: Net Primary Productivity (NPP)
This work was carried out under the United Nations Environment Programme (UNEP) project on "Primary Productivity and Photosynthesis of Semi-Natural Ecosystems of the Tropics and Sub-tropics." The study commenced in 1984, and forms part of an ongoing project through support from UNEP and many other sources. Five sites were chosen for the project: a dry savanna in Nairobi National Park, Kenya; a monsoon savanna in the Klong Hoi Khong field site, Thailand; a saline grassland in the Montecillo field site, Mexico; a floodplain grassland on the island of Marchantaria (near Manaus), Brazil; and a bamboo stand in Miao Shan, China. Prior to this study, information on production, photosynthesis and carbon flow of grasslands (the world's largest terrestrial biome) was sparse in comparison to that for other biomes. Furthermore, research on temperate grasslands suggested that previous methods used [i.e., maximum-minimum method for shoots only or standard methods of the International Biological Programme (IBP)] underestimate production in tropical grasslands. New developments and advances in field and remote sensing methodologies not available to earlier IBP studies were identified by the UNEP project and a uniform approach was adopted, and tailored to the demographic characteristics of each site where necessary, for the UNEP study.
This Nairobi data set contains contains a long time series of monthly biomass measurements and NPP estimates made between July 1984 and November 1994 on an ungrazed tropical dry savanna grassland in Nairobi National Park. Additional biomass measurements but of a shorter duration (October 1989-June 1991) were made on an adjacent savanna that had been clipped in September 1989. Climate data for the Nairobi site are available from a weather station at the Jomo Kenyatta Airport (5 km from grassland study site) for the period 1969-1989. Data for the study site were originally reported in Kinyamario and Imbamba (1992).
Measurements of above-ground live phytomass, standing dead, and litter biomass were made on the 15th day of each month on the ungrazed grassland over the time series (except during 1987 and at a few other times). The time series for below-ground biomass measurements (live and dead) is more discontinuous with large gaps in 1987-1989. NPP estimates are only available for part of 1984 through 1986 on the ungrazed savanna. The record of above- and below-ground biomass measurements for the clipped savanna is complete for 1989-1991 except for a few gaps in 1990.
Above-ground live biomass on the ungrazed savanna exhibited a seasonal bimodal pattern with peaks during the long rain season (March-June) while levels of dead material tended to be higher in the drier parts of the year, particularly during the long dry season. Averaged over the whole study, the mean level of live phytomass was 145 g/m2, standing dead material was 364 g/m2, and litter was 146 g/m2. Below-ground biomass was highest during the dry seasons. However, peak values of biomass occurred just before the end of the growing season or at the start of the dry season. Averaged over the whole study, below-ground phytomass was 113 g/m2 and below-ground mortmass was 174 g/m2. Between October 1984 and September 1986, ANPP averaged 1,004 g/m2/yr and BNPP averaged 875 g/m2/yr for a total NPP estimate of 1,880 g/m2/yr (Kinyamario and Imbamba, 1992). NPP values for this site reported in other published accounts differ due to different measurement and calculation methods.
Table 1. ANPP, BNPP, and TNPP values for untreated Nairobi savanna reported by various published data sources
| Source | Units | ANPP | BNPP | TNPP |
|---|---|---|---|---|
| Kinyamario and Imbamba (1992) | g/m2/yr | 1,004 | 875 | 1,880 |
| Scurlock and Olson (2013) | 811 | 431 | 1,242 | |
| GPPDI Class A Site # 31 in Olson et al. (2013a) | gC/m2/yr | 104 | 58 | 162 |
| GPPDI Class B Site # 62 (MI 108) in Olson et al. (2013a) | 60 | 40 | 100 | |
| GPPDI Class B Site # 62 (MI 109) in Olson et al. (2013a) | 100 | 60 | 160 | |
| GPPDI Class B Site # 62 (MI 110) in Olson et al. (2013a) | 370 | 190 | 560 | |
| EMDI Class B site #62 in Olson et al. (2013b) | 235 | 125 | 360 |
Note: MI = Measurement identification number.
2. Data Description:
Spatial Coverage
Site: Nairobi, Kenya
Site Boundaries: (All latitude and longitude given in decimal degrees)
| Site (Region) | Westernmost Longitude | Easternmost Longitude | Northernmost Latitude | Southernmost Latitude | Elevation (m) |
|---|---|---|---|---|---|
| Nairobi, Kenya | 36.83 | 36.83 | -1.33 | -1.33 | 1,600 |
Spatial Resolution
One hectare exclosure with 0.25-m2 quadrats in a randomized block design.
Temporal Coverage
1984/07/15-1994/11/15 for ungrazed savanna. 1989/10/15-1991/06/15 for clipped savanna. There are gaps in both time series.
Temporal Resolution
Monthly measurements made on the 15th day of each month.
Data File Information
Table 2. Data file descriptions
| FILE NAME | TEMPORAL COVERAGE | FILE CONTENTS |
|---|---|---|
| nrb1_npp.txt | 1984/07/15-1994/11/15 | Monthly biomass and NPP data for the ungrazed savanna grassland at Nairobi, Kenya |
| nrb2_npp.txt | 1989/10/15-1991/06/15 | Monthly biomass data for the clipped savanna grassland at Nairobi, Kenya (clipped in September 1989) |
| nrb_cli.txt | 1969/01/01-1989/12/31 | Climate data from a weather station at the Jomo Kenyatta Airport near the Nairobi grassland |
NPP Data. The results of this study are provided in two text files (.txt format), one file for each treatment. The variable values are delimited by semicolons. The first lines are metadata. Missing data are denoted by the value -999.9. All biomass units are expressed in g/m2 (dry matter weight). NPP units are expressed as g/m2 per sampling period (dry matter weight).
Table 4. Column headings in NPP file for ungrazed savanna: nrb1_npp.txt
| COLUMN HEADING | DEFINITION | UNITS |
|---|---|---|
| Site | Site where data were gathered (code refers to site identification) | text |
| Treatmt | Long term management of site (code refers to treatment described in metadata in data file) | |
| Year | Year in which data were collected | yyyy |
| Mn | Month in which data were collected | mm |
| Dy | Day on which data were collected | dd |
| Tyear | Date in decimal year (year plus the Julian date divided by 365) | numeric |
| AGbiomass | Above-ground live biomass. | g/m2 |
| Stdead | Standing dead biomass | |
| litter | Dead biomass found above ground | |
| AGtotmatter | Total above-ground biomass (live + dead + litter) | |
| BGbiomass | Below-ground live biomass | |
| BGdead | Below-ground dead biomass | |
| BGtotmatter | Total below-ground biomass (live + dead) | |
| ANPP | Above-ground net primary production | g/m2 per sampling period |
| BNPP | Below-ground net primary production |
Sample NPP Data Record for file nrb1_npp.txt
| Site;Treatmt;Year;Mn;Dy;Tyear;AGbiomass;AGtotdead;Stdead;litter;AGtotmatter;BGbiomass;BGdead;BGtotmatter; ANPP;BNPP [units g/m2] nrb;1_lngtrm;1984;07;15;1984.540; 156.3; 144.3; 311.1; 611.8; 295.5; 305.6; 601.1;-999.9;-999.9 nrb;1_lngtrm;1984;08;15;1984.620; 120.9; 141.1; 323.6; 585.6; 89.7; 99.8; 189.5;-999.9;-999.9 nrb;1_lngtrm;1984;09;15;1984.710; 32.5; 157.1; 288.4; 477.9; 90.4; 121.6; 212.0;-999.9;-999.9 nrb;1_lngtrm;1984;10;15;1984.790; 72.8; 52.3; 119.3; 244.4; 130.5; 138.2; 268.7;-208.6; 98.3 nrb;1_lngtrm;1984;11;15;1984.880; 225.7; 26.3; 13.7; 265.7; 194.9; 219.7; 414.5; 27.8; 213.3 ... |
Table 5. Column headings in NPP file for clipped savanna: nrb2_npp.txt
| COLUMN HEADING | DEFINITION | UNITS |
|---|---|---|
| Site | Site where data were gathered (code refers to site identification) | text |
| Treatmt | Long term management of site (code refers to treatment described in metadata in data file) | |
| Year | Year in which data were collected | yyyy |
| Mn | Month in which data were collected | mm |
| Dy | Day on which data were collected | dd |
| Tyear | Date in decimal year (year plus the Julian date divided by 365) | numeric |
| AGbiomass | Above-ground live biomass. | g/m2 |
| Stdead | Standing dead biomass | |
| litter | Dead biomass found above ground | |
| AGtotmatter | Total above-ground biomass (live + dead + litter) | |
| BGbiomass | Below-ground live biomass | |
| BGdead | Below-ground dead biomass | |
| BGtotmatter | Total below-ground biomass (live + dead) |
Sample NPP Data Record for file nrb2_npp.txt
| Site;Treatmt;Year;Mn;Dy;Tyear;AGbiomass;Stdead;litter;AGtotmatter;BGbiomass;BGdead;BGtotmatter [units g/m2] nrb;2_clip89;1989;10;15;1989.790; 0.0; 0.0; 0.0; 0.0; 106.8; 97.7; 204.5 nrb;2_clip89;1989;11;15;1989.870; 38.1; 0.0; 0.0; 38.1; 17.7; 48.6; 66.3 nrb;2_clip89;1989;12;15;1989.960; 46.0; 0.0; 0.0; 46.0; 340.3; 236.3; 576.6 nrb;2_clip89;1990;01;15;1990.040; 38.9; 94.4; 24.1; 157.4; 63.0; 143.7; 206.7 nrb;2_clip89;1990;02;15;1990.130; 44.3; 135.2; 29.7; 209.2; 109.4; 186.6; 296.0 nrb;2_clip89;1990;03;15;1990.200; 60.9; 150.4; 19.4; 230.7; 97.9; 171.9; 269.8 nrb;2_clip89;1990;04;15;1990.290; 100.9; 197.6; 41.2; 339.7; 92.9; 168.4; 261.3 nrb;2_clip89;1990;05;15;1990.370; 114.4; 238.5; 43.4; 396.3; 89.6; 112.5; 202.1 nrb;2_clip89;1990;06;15;1990.450; 134.2; 271.4; 54.6; 460.2; 95.5; 114.6; 210.2 nrb;2_clip89;1990;07;15;1990.540; 92.6; 225.0; 34.7; 352.2; 197.6; 60.8; 258.4 ... |
Climate Data. Climate data are provided in one text file (.txt format). The variable values are delimited by semicolons. There are no missing values.
Sample Climate Data Record
| Site;Temp;Parm; Jan; Feb; Mar; Apr; May; Jun; Jul; Aug; Sep; Oct; Nov; Dec; Year nrb;mean;prec; 40.6; 46.4; 63.4;145.0;104.0; 24.3; 11.8; 9.6; 19.6; 39.0; 95.7; 77.8; 677.2 nrb;mean;tmax; 26.7; 27.8; 29.5; 26.0; 24.4; 23.5; 22.7; 23.4; 25.9; 26.8; 25.4; 25.4; 29.9 nrb;mean;tmin; 12.0; 12.3; 13.3; 14.6; 13.6; 11.7; 10.7; 10.9; 11.4; 12.9; 13.3; 12.6; 10.3 nrb;numb;prec; 21.0; 21.0; 21.0; 21.0; 21.0; 21.0; 21.0; 21.0; 21.0; 21.0; 21.0; 21.0; 21.0 nrb;numb;tmax; 21.0; 21.0; 21.0; 21.0; 21.0; 21.0; 21.0; 21.0; 21.0; 21.0; 21.0; 21.0; 21.0 nrb;numb;tmin; 21.0; 21.0; 21.0; 21.0; 21.0; 21.0; 21.0; 21.0; 21.0; 21.0; 21.0; 21.0; 21.0 nrb;stdv;prec; 39.7; 71.0; 53.3; 92.5; 69.8; 30.6; 12.5; 11.7; 22.2; 46.1; 53.6; 55.1; 173.2 nrb;stdv;tmax; 1.0; 1.3; 3.6; 1.3; 0.8; 0.9; 0.9; 1.0; 0.9; 1.1; 0.9; 0.9; 3.3 nrb;stdv;tmin; 1.1; 1.3; 1.0; 0.6; 0.7; 0.9; 0.7; 0.8; 1.1; 1.1; 0.8; 1.1; 0.7 nrb;1969;prec; 77.0; 41.0; 42.0; 9.0;138.0; 2.0; 1.0; 14.0; 1.0; 28.0;111.0; 14.0; 478.0 nrb;1969;tmax; 26.6; 25.5; 26.2; 27.7; 24.8; 24.4; 22.9; 23.7; 26.9; 28.2; 25.6; 26.0; 28.2 nrb;1969;tmin; 12.1; 12.6; 13.8; 14.0; 12.8; 10.2; 10.4; 9.5; 11.2; 12.7; 13.2; 12.3; 9.5 … Where, Temp (temporal) - specific year or long-term statistic: mean = mean based on all years numb = number of years stdv = standard deviation based on all years Parm (parameter): prec = precipitation for month or year (mm) tmax = mean maximum temperature for month or year (C) tmin = mean minimum temperature for month or year (C) |
3. Data Application and Derivation:
Primary production and the factors that influence it have been studied in various grassland ecosystems around the world. However, few studies have been made in tropical African grasslands which is surprising considering their importance. Even fewer studies have included measurements of below-ground biomass and decomposition rates of dead materials, both of which are important aspects of primary production. Thus, some previous estimates of NPP in tropical grasslands are probably underestimated. The aim of this study was to resolve the uncertainty of grassland production and its variability in time and space by providing a full account of above- and below-ground vegetation dynamics and by using a practical, common methodology to maximize comparability among sites.
This work was carried out under the United Nations Environment Programme (UNEP) project on "Primary P and Photosynthesis of Semi-Natural Ecosystems of the Tropics and Sub-tropics." The data collected by this study contribute greatly to the understanding of the structures and production capacities of the several types of grassland ecosystems.
Grassland biomass dynamics data for Nairobi are provided for comparison with models and estimation of NPP. Climate data are provided for use in driving ecosystem/NPP models.
4. Quality Assessment:
NPP of grasslands is subject to a number of different methods of estimation from biomass data, some of which may be inappropriate for particular biome types. Methodology of estimation/calculation needs to be taken into account, as well as methodology of measurement, when making comparisons between different regions. Errors in biomass measurement may also occur between different study sites. For short time series of data it may be assumed that measurement methodology remains consistent; however, over very long time series changes in staff, tools, etc. may lead to "calibration" errors.
Previous estimates of tropical grassland productivity are based largely on the maximum-minimum method (shoots only) or standard IBP methods which likely underestimated production (Kinyamario and Imbamba, 1992; Long and Jones, 1992). Until this research project, very few studies of tropical grasslands took into account either turnover of biomass or below-ground biomass and production. This study showed that east African grasslands are more productive than may have previously been reported.
In this study, peak above-ground live biomass at Nairobi National Park occurred during the long rainy season, ranging from about 300 to 342 g/m2. These values are within the ranges reported by several other researchers in the Nairobi ecosystem. Owaga (1980) reported peak values of 309 g/m2 and Deshmukh (1986) a peak value of 332 g/m2. Peak above-ground standing dead matter in this study (503 to 691 g/m2), however, exceed that reported by Owaga (1980; 93 g/m2) and Deshmukh (1986; 374 g/m2). The magnitude of below-ground biomass in east African grasslands was not well documented when this study commenced. The range of total below-ground biomass reported in this study (74 to 731 g/m2) is at the lower end of values reported by Strugnell and Pigott (1978) (512-2,007 g/m2) for total root biomass from enclosed sites in Ruwenzori National Park, Uganda. [Note: the higher results may be due to deeper root samples (to 60 cm) extracted in Uganda]. The annual average ANPP value reported for the Nairobi site in this study (1,004g/m2/yr) is higher than values reported by several other researchers working in this ecosystem [i.e., Lusigi (1978), 395 g/m2/yr; Owaga (1980), 448 g/m2/yr; Macharia (1981), 364 g/m2/yr] but is similar to Deshmukh's (1986) value of 1,071 g/m2/yr. The lower ANPP values may be due to use of either the maximum-minimum method or the standard IBP method of measurement. The Strugnell and Pigott (1978) annual BNPP value (1,500 g/m2/yr), the only other published estimate from a comparable east African grassland, from deeper biomass cores in Uganda is almost twice as high as the average annual value from this study (875 g/m2/yr).
5. Data Acquisition Materials and Methods:
Site Information
The Nairobi study site is situated at the southern end of the 112-km2 Nairobi National Park near Athi River town, about 30-km southeast of Nairobi, Kenya. The site is typical of the African tropical dry savanna grasslands that lie between the rainforests and the deserts on both sides of the equator from about -29 S to about 16 N. The climate is characterized by annual maximum/minium temperatures of 29.9/10.3 degrees C and annual mean precipitation of 677.2 mm which falls in a bimodal pattern. Most rains fall March to May (the long rains) and a lesser peak of rainfall occurs October to December (the short rains). Growing seasons are therefore normally May-August and October-December. [Note: in May (immediately preceding this study) the May rains failed.] The grassland was used as grazing or holding ground for cattle for many years prior to the establishment of Nairobi National Park in 1946 when cattle grazing ceased and the area became a refuge for wildebeest and other large herbivores (Kinyamario and Imbamba, 1992; Long et al., 1989). For this study, a 1-ha area of vegetation considered typical of the site was chosen and protected by an exclosure from grazing and fire.
The Nairobi study site is part of a flat plain. The underlying rocks are volcanic lavas, tuffs, and basement complex. The dominant soils are black to dark grey clays, grumsolic soils. The grassland is characterized by a continuous graminoid stratum dominated by Pennisetum menzianum and Themeda triandra with a few scattered woody plants. The open grassland with sparse woody vegetation is considered a sub-climax ecosystem where hundreds of years of natural forces, including moisture availability, grazing, burning, and poorly drained soils, are in functional balance. Similar land in Kenya is grazed by domestic livestock (cattle, sheep, goats, camels) and large game animals or has been ploughed for sorghum, cotton and pineapple production.
Table 4. Site Characteristics
| Description | Values |
|---|---|
| mean annual precipitation | 677 mm |
| mean monthly minimum temperature | 10.7 C (Jan) |
| mean monthly maximum temperature | 29.5 (C) (Mar) |
| vegetation type | dry savanna grassland |
| dominant species | Pennisetum menzianum and Themeda triandra (C4) |
| historical long-term management regime | grazing with fire every five years |
| max above-ground live biomass (typical month) | 337 g/m2 (July) |
| soil type | black clay grumsolic vertisol |
| soil pH | 7.5 |
| soil texture (sand/ silt/ clay) | 0.13 / 0.17/ 0.70 |
| soil carbon content | 3,500 g/m2 (0-20 cm) |
| soil nitrogen content | 367 g/m2 (0-20 cm) |
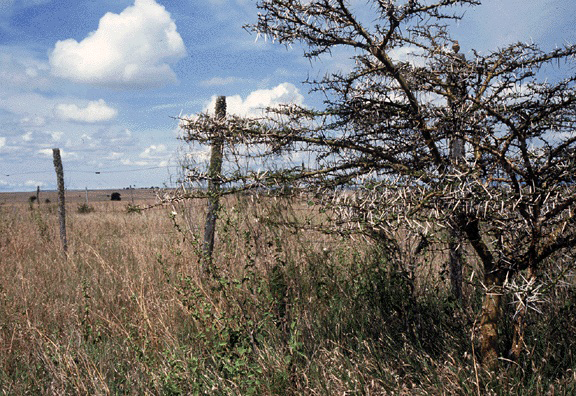
Figure 2. Dry season view of site exclosure fence, dry grass and young Acacia bush, Nairobi grassland site, Kenya. (Photograph taken February 1995 by A.D. Rosenschein, King's College London, UK).
Methods
General procedures for measuring production in the Nairobi grassland are described in Kinyamario and Imbamba (1992), Long and Jones (1992), and Roberts et al. (1985) and are summarized herein.
At the Nairobi site, a 1-ha area of vegetation considered typical of the site was fenced and fire-breaks were constructed to allow control of grazing and burning. Dry weight of both live and dead above-ground vegetation was determined monthly by clipping to ground level sets of 20 quadrats (0.25 x 1.0-m), located on a randomized block design. Leaves were sorted into living and dead matter on the basis of tissue appearance, dead parts being removed from otherwise green leaves. Stems were sorted likewise to remove dead sheaths from living stems. Soil cores of 5-cm in diameter were removed from the center of 5 to 20 of these quadrats each month to a depth of 15 cm, a depth determined adequate to remove more than 90% of the root system by weight. Organic material was extracted by washing over a sieve of 2-mm mesh. Dead organic matter was sorted to recognizable dead vegetation vs particulate organic matter based on ability to pass through the sieve. The remaining below-ground matter was divided into fine roots (< 1-mm dia) and coarser material and dead root parts were removed from living, using vital staining where visual discrimination was not otherwise possible. The sorted plant material was washed and dried to constant weight at 105 degrees C.
6. Data Access:
This data set is available through the Oak Ridge National Laboratory (ORNL) Distributed Active Archive Center (DAAC).
Data Archive Center:
Contact for Data Center Access Information:
E-mail: uso@daac.ornl.gov
Telephone: +1 (865) 241-3952
7. References:
Deshmukh, I. 1986. Primary production of a grassland in Nairobi National Park. Journal of Applied Ecology 39: 115-123. doi:10.2307/2403085
Kinyamario, J.I., and S.K. Imbamba. 1992. Savanna at Nairobi National Park, Kenya, pp. 25-69. IN: Long, S.P., M.B. Jones, and M.J. Roberts (eds.). Primary Productivity of Grass Ecosystems of the Tropics and Sub-tropics. Chapman and Hall, London. 267 pp.
Long, S.P., and M.B. Jones. 1992. Introduction, aims, goals, and general methods, pp. 1-24. IN: Long, S.P., M.B. Jones, and M.J. Roberts (eds.). Primary Productivity of Grass Ecosystems of the Tropics and Sub-tropics. Chapman and Hall, London. 267 pp.
Long, S.P., E. Garcia Moya, S.K. Imbamba, A. Kamnalrut, M.T.F. Piedade, J.M.O. Scurlock, Y.K. Shen, and D.O. Hall. 1989. Primary productivity of natural grass ecosystems of the tropics: A reappraisal. Plant and Soil 115(2): 155-166. doi:10.1046/j.1365-2486.2001.00448.x
Lusigi, W.J. 1978. Planning Human Activities on Protected Natural Ecosystems. Strauss and Cramer, Germany.
Macharia, J.N.M. 1981. Bioproduction in Relation to Photosynthesis in Four Grassland Ecosystems in Kenya. MSc Thesis, University of Nairobi, Kenya.
Olson, R.J., K.R. Johnson, D.L. Zheng, and J.M.O. Scurlock. 2001. Global and Regional Ecosystem Modeling: Databases of Model Drivers and Validation Measurements. ORNL Technical Memorandum TM-2001/196. Oak Ridge National Laboratory, Oak Ridge, Tennessee, U.S.A.
Olson, R.J., J.M.O. Scurlock, S.D. Prince, D.L. Zheng, and K.R. Johnson (eds.). 2013a. NPP Multi-Biome: Global Primary Production Data Initiative Products, R2. Data set. Available on-line [http://daac.ornl.gov] from the Oak Ridge National Laboratory Distributed Active Archive Center, Oak Ridge, Tennessee, USA. doi:10.3334/ORNLDAAC/617
Olson, R.J., J.M.O. Scurlock, S.D. Prince, D.L. Zheng, and K.R. Johnson (eds.). 2013b. NPP Multi-Biome: NPP and Driver Data for Ecosystem Model-Data Intercomparison, R2. Data set. Available on-line [http://daac.ornl.gov] from the Oak Ridge National Laboratory Distributed Active Archive Center, Oak Ridge, Tennessee, USA. doi:10.3334/ORNLDAAC/615
Owaga, M.L.A. 1980. Primary productivity and herbage utilisation by herbivores in Kaputei plains, Kenya. African Journal of Ecology 18: 1-5. doi:10.1111/j.1365-2028.1980.tb00264.x
Roberts, M.J., S.P. Long, L.L. Tieszen, and C.L. Beadle. 1985. Measurement of plant biomass and net primary production of herbaceous vegetation, pp. 1-19. IN: Coombs, J., D.O. Hall, S.P. Long, and J.M.O. Scurlock (eds.). Techniques in Bioproductivity and Photosynthesis, 2nd Edition. Pergamon Press, Oxford. 200 pp.
Scurlock, J.M.O., and R.J. Olson. 2013. NPP Multi-Biome: Grassland, Boreal Forest, and Tropical Forest Sites, 1939-1996, R1. Data set. Available on-line [http://daac.ornl.gov] from Oak Ridge National Laboratory Distributed Active Archive Center, Oak Ridge, Tennessee, USA. doi:10.3334/ORNLDAAC/653
Strugnell, R.G., and C.D. Pigott. 1978. Biomass, shoot production and grazing of two grasslands in the Ruwenzori National Park, Uganda. Journal of Ecology 66: 73-97. doi:10.2307/2259182