Get Data
Summary:
This data set contains five ASCII files (.txt format). Three files contain productivity data for a mixed prairie at the Matador Field Station, Canada, and two files contain climate data. The 8-km2 Matador Field Station (50.70 N, -107.72 W, Elevation 676 m) is located approximately 47-km north of the city of Swift Current in southern Saskatchewan Province at the northern limit of the "mixed prairie" portion of the North American Great Plains. The study area is located on the bed of a former glacial lake.
One NPP file contains monthly measurements of above-ground standing live and dead biomass and litter made in "Section 16" by harvest methods during the growing season from March or April 1968 to October or November 1972. The second NPP file contains monthly measurements of root biomass made at different depths in "Section 16" during the growing season from April 1968 to July 1971. The third NPP file contains monthly above-ground biomass estimates for a secondary study area during the growing season from May 1970 to August 1972. The climate data are reported from two locations, one file from a weather station at Swift Current (1938-1990) and the other from a weather station at the Field Station during the study period (1968-1972).
The above- and below-ground net primary productivity (ANPP and BNPP, respectively) were calculated for "Section 16" only. ANPP (363 g/m2/yr) was sum of the increase in green biomass over the growing season, plus increase in dead biomass and litter. BNPP (600 g/m2/yr) was the increase in root biomass over the growing season.
Revision Notes: Only the documentation for this data set has been modified. The data files have been checked for accuracy and are identical to those originally published in 1999.
Additional Documentation:
The NPP data collection contains field measurements of biomass, estimated NPP, and climate data for terrestrial grassland, tropical forest, temperate forest, boreal forest, and tundra sites worldwide. Data were compiled from the published literature for intensively studied and well-documented individual field sites and from a number of previously compiled multi-site, multi-biome data sets of georeferenced NPP estimates. The principal compilation effort (Olson et al., 2001) was sponsored by NASA’s Terrestrial Ecology Program. For more information, please visit the NPP web site at http://daac.ornl.gov/NPP/npp_home.html.
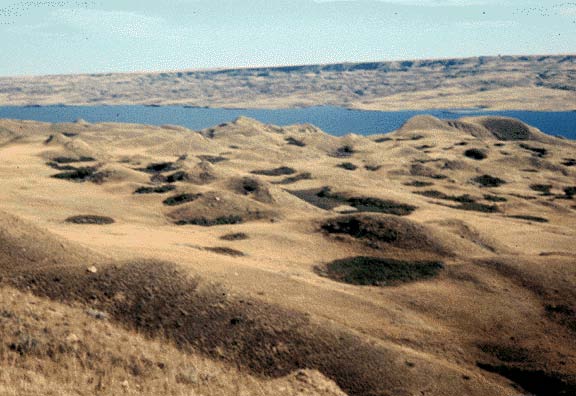
Figure 1. View looking south from the Matador grassland site, Saskatchewan, Canada. (South Saskatchewan River/ Diefenbaker Lake can be seen in the background. The sample plots were located between 1.0 and 2.4-km from this point, on flat topography. Photograph taken August/September 1969).
Data Citation:
Cite this data set as follows:
Coupland, R.T. 2014. NPP Grassland: Matador, Canada, 1968-1972, R1. Data set. Available on-line [http://daac.ornl.gov] from Oak Ridge National Laboratory Distributed Active Archive Center, Oak Ridge, Tennessee, USA. doi:10.3334/ORNLDAAC/469
This data set was originally published as:
Coupland, R.T. 1999. NPP Grassland: Matador, Canada, 1968-1972. Data set. Available on-line [http://daac.ornl.gov] from Oak Ridge National Laboratory Distributed Active Archive Center, Oak Ridge, Tennessee, U.S.A.
Table of Contents:
- 1 Data Set Overview
- 2 Data Description
- 3 Applications and Derivation
- 4 Quality Assessment
- 5 Acquisition Materials and Methods
- 6 Data Access
- 7 References
1. Data Set Overview:
Project: Net Primary Productivity (NPP)
Productivity of a mixed prairie grassland was monitored in "Section 16" of the Matador Field Station, Canada, from April 1968 through October 1972 (above-ground) and April 1968 to early July 1971 (below-ground). Another study of above-ground biomass dynamics was conducted at a secondary site ("Section 10") from May 1970 to mid-August 1972. Monthly measurements of above-ground standing live and dead biomass and litter were made by harvest methods in "Section 16" and "Section 10". Root biomass was also measured in "Section 16". Untreated, burned, irrigated, fertilized, and grazed treatment areas were assessed for productivity, but only data for the untreated areas are included in this data set.
This study was part of a total ecosystem study (the Matador Project), the objective of which was to measure energy flow of a grassland ecosystem by investigating its structure and function. As part of the International Biological Programme (IBP), the Matador Project was funded by the National Research Council of Canada and headquartered at the University of Saskatchewan. Other studies at the same site examined biomass and activity of all groups of flora, fauna, and microorganisms, as well as abiotic factors that affect energy flow and nutrient cycling.
The 8-km2 Matador Field Station (50.70 N, -107.72 W, Elevation 676 m) is located approximately 47-km north of the city of Swift Current in southern Saskatchewan Province, approximately 180-km SSW of Saskatoon, at the northern limit of the "mixed prairie" portion of the North American Great Plains. This area is on the bed of a former glacial lake which has been cut by the South Saskatchewan River. The construction of a dam upstream created Diefenbaker Lake immediately to the south. The effect of grazing by cattle on the plot areas, which began in 1905 and was mostly limited to the winter months until terminated in 1961, was minimal or absent. The principal study area for above- and below-ground plant production was located within "Section 16". The study site is 400-m x 60-m and sampling took place within 4-m x 4-m subplots.
A secondary study area ("Section 10") was initiated in 1970 and above-ground biomass was measured.
The above- and below-ground net primary productivity values (ANPP and BNPP, respectively) were calculated for "Section 16" only. ANPP (363 g/m2/yr) was sum of the increase in green biomass over the growing season, plus increase in dead biomass and litter. BNPP (600 g/m2/yr) was the increase in root biomass over the growing season (Esser, 2013). Productivity values are also reported in Olson et al. (2013a; b), but do not agree with the values given here because different calculation methods were used.
Climate data are available from a weather station at Swift Current (50.28 N, -107.68 W, Elevation 818 m) near Matador for the period 1938-1990 and from a weather station at the Matador Field Station during this study.
2. Data Description:
Site: Matador, Saskatchewan, Canada
Site Boundaries: (All latitude and longitude given in decimal degrees)
| Site (Region) | Westernmost Longitude | Easternmost Longitude | Northernmost Latitude | Southernmost Latitude | Elevation (m) |
|---|---|---|---|---|---|
| Matador, Saskatchewan, Canada | -107.72 | -107.72 | 50.7 | 50.7 | 676 |
Spatial Resolution
Not available.
Temporal Coverage
Biomass measurements were made from 1968/04/17 through 1972/10/23. Sampling dates within individual data files vary (see Table 1). Climate data are available from 1938/01/01 through 1990/12/31.
Temporal Resolution
Biomass measurements were made at roughly 2-week intervals during the growing seasons. All biomass estimates are based on plant dry matter accumulation, expressed as g/m2. Climate data are expressed as monthly and annual precipitation amounts (mm) and monthly and annual average maximum/minimum temperature (C). Monthly and annual climatic means are provided for the 1938-1990 period.
Data File Information
Table 1. Data files in this data set archive
| FILE NAME | TEMPORAL COVERAGE | FILE CONTENTS |
|---|---|---|
| mtd1_npp.txt | 1968/04/17 - 1972/10/23 | Above-ground biomass data for an ungrazed grassland in Section 16 at the Matador Field Station, Canada |
| mtd2_npp.txt | 1968/04/24 - 1971/07/06 | Below-ground biomass data for an ungrazed grassland in Section 16 at the Matador Field Station, Canada |
| mtd3_npp.txt | 1970/05/06 - 1972/08/15 | Above-ground biomass data for an ungrazed grassland in Section 10 at the Matador Field Station, Canada |
| mtd1_cli.txt | 1968/06/01 - 1971/12/31 | Monthly and annual climate data from weather station at the Matador Field Station, Canada. |
| mtd2_cli.txt | 1938/01/01 - 1990/12/31 | Monthly and annual climate data from a weather station at Swift Current near the Matador Field Station, Canada |
NPP data: Productivity estimates for the Matador sites are provided in three files (Table 1). The data sets are ASCII files (.txt format). The first 18 lines are metadata; data records begin on line 19. The variable values are delimited by semi-colons. All NPP units are in g/m2 (dry matter weight). There are no missing values.
Table 2. Column headings in above-ground NPP files ("Sections 16 and 10")
| COLUMN HEADING | DEFINITION | UNITS |
|---|---|---|
| Site | Site where data were gathered (code refers to site identification) | Text |
| Treatmt | Long term management of site (code refers to treatment described in metadata in data file; number refers to study site) | |
| Year | Year in which data were collected | Numeric |
| Mn | Month in which data were collected | |
| Day | Day on which data were collected | |
| Jdate | Date in Julian year | |
| Tyear | Date in decimal year (year plus the Julian date divided by 365) | |
| nplots | Number of sampling plots | |
| AGbiomass | Above-ground living biomass | g/m2 |
| Stdead | Above-ground standing dead biomass | |
| Olddead | Monthly above-ground standing old dead matter | |
| AGtotclip | Total above-ground biomass (living plus dead material) | |
| litter | Above-ground litter material |
Sample NPP Data Record (above-ground data, "Section 16") <mtd1_npp.txt>
| Site; Treatmt; Year; Mo; Dy; Jdate; Tyear; nplots; AGbiom; Stdead; AGtotclip; litter mtd ; none16; 1968; 04; 17; 107; 1968.293; 25; 20.29; 346.03; 366.32; 219.56 mtd ; none16; 1968; 05; 14; 134; 1968.367; 25; 44.20; 344.79; 388.99; 267.02 mtd ; none16; 1968; 06; 03; 154; 1968.422; 25; 69.61; 324.56; 394.17; 211.41 ... |
Sample NPP Data Record (above-ground data, "Section 10") <mtd3_npp.txt>
| Site; Treatmt; Year; Mo; Dy; Jdate; Tyear; nplots; AGbiom; Stdead; AGtotclip; litter mtd ; none10; 1970; 05; 06; 126; 1970.345; 10; 41.43; 236.98; 278.41; 336.87 mtd ; none10; 1970; 06; 09; 160; 1970.438; 10; 88.06; 238.26; 326.32; 375.89 mtd ; none10; 1970; 07; 07; 188; 1970.515; 10; 128.31; 233.60; 361.91; 344.50 ... |
Table 3. Column headings in below-ground NPP files ("Section 16")
| COLUMN HEADING | DEFINITION | UNITS |
|---|---|---|
| Site | Site where data were gathered (code refers to site identification) | Text |
| Treatmt | Long term management of site (code refers to treatment described in metadata in data file; number refers to study site) | |
| Year | Year in which data were collected | Numeric |
| Mn | Month in which data were collected | |
| Day | Day on which data were collected | |
| Jdate | Date in Julian year | |
| Tyear | Date in decimal year (year plus the Julian date divided by 365) | |
| nplots | Number of sampling plots | |
| BG0-10 | Below-ground biomass in 0-10 cm increment | g/m2 |
| BG10-20 | Below-ground biomass in 10-20 cm increment | |
| BG20-30 | Below-ground biomass in 20-30 cm increment | |
| BG0-30 | Total below-ground biomass, 0-30 cm depth | |
| BGest.0-150 | Estimated total below-ground biomass, 0-150 cm depth |
Note: All values are from Coupland et al. (1974) and related papers. See References.
Sample NPP Data Record (below-ground data, Section "16") <mtd2_npp.txt>
| Site; Treatmt; Year; Mo; Dy; Jdate; Tyear; BG0-10; BG10-20; BG20-30; BG0-30; BGest.0-150 mtd ; none16; 1968; 04; 24; 114; 1968.312; 1219; 283; 174; 1676; 2749 mtd ; none16; 1968; 05; 26; 146; 1968.400; 1335; 275; 183; 1794; 2942 mtd ; none16; 1968; 07; 22; 203; 1968.556; 1121; 298; 199; 1618; 2654 ... ... |
Climate Data. The climate data set is an ASCII file (.txt format). The variable values are delimited by semicolons. The value -999.9 is used to denote missing values.
| COLUMN HEADINGS | DEFINITION |
|---|---|
| Site | Unique 3-character code for each site based on the first three consonants in the site name (e.g., mtd for Matador) |
| Temp (Temporal) |
Indicates whether the values in that row are either long-term (i.e, mulit-year) or annual data for the specified parameter. For multi-year, the values are: mean=mean values (monthly and annual) calculated for the years of data as noted in the documentation numb=number of years of data included in a reported mean value stdv=standard deviation of a mean value Annual data: 19XX=monthly and annual parameter values for the specified year (e.g., 1972) |
| Parm | Parameter, indicates the meteorological data reported in that row. prec-total precipitation for the month or year tmax=maximum temperature for the month or year reported in degrees C tmin=minimum temperature for the month or year reported in degrees C |
|
Description of specific Temp and Parm data values: Long-term data: site;mean;prec; Multi-year mean of total precipitation for each month [Jan, Feb, Mar, …, Dec] and mean of total annual precipitation across all years [Year] (mm) site;mean;tmax; Multi-year mean of maximum temperature for each month [Jan, Feb, Mar, …, Dec] and mean of annual maximum temperature across all years [Year] (C) site;mean;tmin; Multi-year mean of minimum temperature for each month [Jan, Feb, Mar, …, Dec] and mean of annual minimum temperature across all years [Year] (C) … site; numb and stdv; repeat for prec, tmax, and tmin; Annual data: site;19XX;prec; Total precipitation for each month [Jan, Feb, Mar,.....Dec] and total precipitation for the year 19XX [Year] (mm) site;19XX;tmax; Maximum temperature for each month [Jan, Feb, Mar,.....Dec] and maximum for the year 19XX [Year] (C) site;19XX;tmin; Minimum temperature for each month [Jan, Feb, Mar,.....Dec] and minimum for the year 19XX [Year] (C) … site;19XX;(prec, tmax, and tmin); repeat for reported years. Annual data missing value note: If a monthly parm value is missing, the parm value for [Year] is also set to missing (-999.9). |
Sample climate data record for Swift Current Weather Station
| Site;Temp;Parm; Jan; Feb; Mar; Apr; May; Jun; Jul; Aug; Sep; Oct; Nov; Dec; Year mtd ;mean;prec; 19.7; 16.4; 18.9; 25.3; 42.8; 72.5; 50.1; 41.9; 34.0; 19.2; 16.8; 19.3; 377.5 mtd ;mean;tmax; -8.1; -5.4; 0.1; 10.1; 17.3; 21.6; 25.6; 24.8; 18.2; 12.0; 1.0; -4.9; 26.5 mtd ;mean;tmin; -18.2; -15.5; -9.9; -1.9; 4.0; 8.6; 11.4; 10.3; 5.2; -0.2; -8.8; -14.6; -20.6 ... mtd ;stdv;prec; 9.5; 8.7; 13.4; 18.4; 29.8; 41.4; 29.4; 27.8; 24.1; 13.9; 11.4; 10.4; 75.7 mtd ;stdv;tmax; 5.3; 4.0; 4.1; 3.6; 2.4; 2.2; 1.8; 2.4; 3.0; 2.9; 4.0; 4.1; 1.7 … mtd ;1939;tmax; -3.3; -12.8; -0.1; 12.6; 18.9; 16.3; 25.9; 26.1; 19.0; 8.9; 9.8; 3.2; 26.1 mtd ;1939;tmin; -12.9; -23.9; -11.7; -1.4; 5.6; 6.9; 11.9; 9.7; 5.5; -3.2; -2.7; -7.6; -23.9 Where, Temp (temporal) - specific year or long-term statistic: mean = mean based on all years numb = number of years stdv = standard deviation based on all years Parm (parameter): prec = precipitation for month or year (mm) tmax = mean maximum temperature for month or year (C) tmin = mean minimum temperature for month or year (C) |
3. Data Application and Derivation:
The accumulation of biomass, or NPP, is the net gain of carbon by photosynthesis that remains after plant respiration. While there are many fates for this carbon, the ANPP value presented here is the sum of the increase in above-ground biomass, dead matter, and litter.
The International Biological Program (IBP) was a world-wide attempt from the mid-1960s to the mid-1970s to collect data on representative ecosystems and develop computer models of them. The Matador NPP study was part of Canada’s contribution to IBP.
The grassland monthly above- and below-ground biomass dynamics data for the Matador grassland site are provided for comparison with models and estimation of NPP. Climate data are provided for use in driving ecosystem/NPP models.
4. Quality Assessment:
None available.
5. Data Acquisition Materials and Methods:
Site Information
The study site was located at the Matador Field Station about 180-km south southwest of Saskatoon, Saskatchewan, Canada. Vegetation of the study area was classified by Coupland et al. (1974) as the Agropyron-Koelertia Faciation of the Mixed Prairie (Stipa-Bouteloua) Association. It is also classified as modified Bailey ecoregion temperate dry steppe, #330. The grassland is located at the northern limit of the "mixed prairie" portion of the North American Great Plains. The native vegetation at the site is dominated by Agropyron dasystachyum (Northern Wheatgrass), A. smithii (Western Wheatgrass), and Koeleria cristata (Junegrass), with an understory of Carex eleocharis (Low Sedge), some Stipa viridula (Green Needlegrass), and a few forbs. Agropyron app. accounts for 75% of the total biomass. The site was moderately to heavily grazed from 1905 to 1961. The area was ungrazed during the study.
Two sections of the 8-km2 Matador Field Station were used for this study: Section 16 and Section 10. The study areas are on the bed of a former glacial lake which had been cut by the South Saskatchewan River. The construction of a dam upstream created Diefenbaker Lake immediately to the south. The terrain is undulating to rolling and is broken by isolated hills and valleys. The sample plots, however, are located on flat topography. The soil type is well-drained, moderately calcareous brown soils of clay to heavy clay texture. Nitrogen and phosphorus are bound to soil components and only small amounts are available to plants at any one time.
The climate at Matador is semiarid. Precipitation was about 380-mm per year over the 1938-1990 period, coming as rain in summer and mostly snow in winter. The height and density of the vegetation at Matador is determined to a large extent on how much snow is trapped. Two-thirds of the precipitation falls during the growing season. Average growing season water use accounts for 90% of the annual precipitation. The mean annual temperature is 3.6 degrees C with a mean monthly temperature of -12.8 degrees C in January and 19.4 degrees C in July. The frost free period averages 112 days.
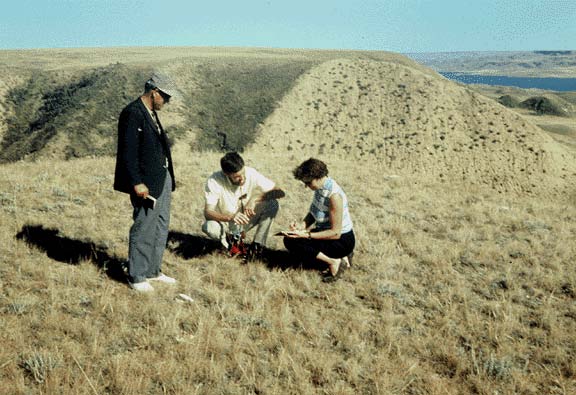
Figure 2. Field work at the Matador grassland site, Saskatchewan, Canada. (The sample plots were located between 1.0 and 2.4-km from this point, on flat topography. Photograph taken August/September 1969).
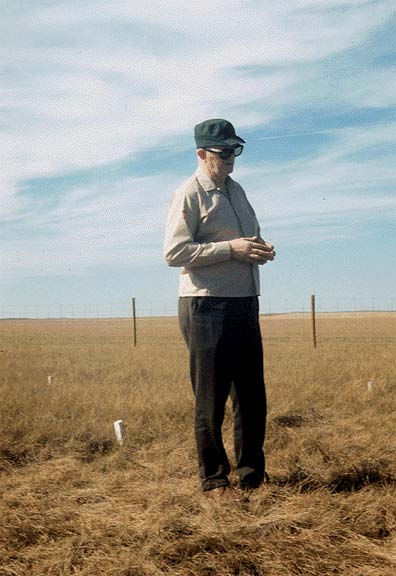
Figure 3. R. T. Coupland (Director, Matador Project, University of Saskatchewan) at the Matador grassland site, Saskatchewan, Canada. Photograph taken August/September 1969).
Methods
Monthly measurements of above-ground standing live and dead biomass and litter were made starting in either March or April and ending in October or November of each year. Root biomass was also measured. The principal study area for plant production, located within "Section 16", was 400 m x 60 m in size, and sampling took place within 4 x 4 m subplots. A secondary study area for above-ground biomass studies ("Section 10") was initiated in 1970.
Climate data
Climate data accompanying this NPP data set are from two weather stations: Swift Current (50.28 N, -107.68 W, Elevation 818 m) (1938-1990) and Matador Field Station (50.70 N, -107.72 W Elevation 676 m) (1968-1971). Climate data include daily observations of Tmax, Tmin, and precip amount.
For a given month, the maximum value of the daily Tmax for that month and the minimum value of the Tmin for that month is provided. For the year, the maximum value of the monthly Tmax is the annual Tmax and for the year the minimum value of the monthly Tmin values is the annual Tmin. Daily precipitation amount is summed to yield a monthly precipitation amount and the monthly precipitation is summed to provide an annual precipitation amount.
The multi-year mean monthly Tmax is the average of the Tmax values for that month for each year of the record. For example the mean monthly Tmax for April is the mean of each April’s Tmax for the observation period of record. Mean monthly Tmin and Mean monthly precip amount are calculated similarly.
6. Data Access:
This data is available through the Oak Ridge National Laboratory (ORNL) Distributed Active Archive Center (DAAC).
Data Archive Center:
Contact for Data Center Access Information:
E-mail: uso@daac.ornl.gov
Telephone: +1 (865) 241-3952
7. References:
Coupland, R.T., J.R. Willard, and E.A. Ripley. 1974. Summary of activities, 1967-1974. Canadian Committee for IBP, Matador Project Technical Report No. 69. Saskatoon, Canada: University of Saskatchewan. 244 p.
Olson, R.J., K.R. Johnson, D.L. Zheng, and J.M.O. Scurlock. 2001. Global and Regional Ecosystem Modeling: Databases of Model Drivers and Validation Measurements. ORNL Technical Memorandum TM-2001/196. Oak Ridge National Laboratory, Oak Ridge, Tennessee, U.S.A.
Additional Sources of Information:
Coupland, R.T. 1973a. Producers: I. Dynamics of aboveground standing crop. Canadian Committee for IBP, Matador Technical Report No. 27, University of Saskatchewan, Saskatoon, Canada. 159 p.
Coupland, R.T. 1973b. Producers: III. Rated of dry matter production and of nutrient and energy flow through shoots, Canadian Committee for IBP, Matador Technical Report 33. University of Saskatchewan, Saskatoon, Canada. 85 p.
Coupland R.T. 1974a. Producers: IV. Under-ground plant parts, Canadian Committee for IBP, Matador Technical Report 41. University of Saskatchewan, Saskatoon, Canada. 73 p.
Coupland R.T. 1974b. Producers: VI. Summary of studies of primary production by biomass and shoot observation methods, Canadian Committee for IBP, Matador Technical Report 62. University of Saskatchewan, Saskatoon, Canada. 84 p.
Coupland R.T., and Z.M. Abougendia. 1974. Producers: V. Dynamics of shoot development in grasses and sedges, Canadian Committee for IBP, Matador Technical Report 51. University of Saskatchewan, Saskatoon, Canada. 110 p.
Esser, G. 2013. NPP Multi-Biome: Global Osnabruck Data, 1937-1981. Data set. Available on-line [http://daac.ornl.gov] from Oak Ridge National Laboratory Distributed Active Archive Center, Oak Ridge, Tennessee, USA. doi:10.3334/ORNLDAAC/214
Li, Y.S., and R.E. Redmann. 1992. Nitrogen budget of Agropyron dasystachyum in Canadian mixed prairie. American Midland Naturalist, 128(1): 61-71.
Olson, R.J., J.M.O. Scurlock, S.D. Prince, D.L. Zheng, and K.R. Johnson (eds.). 2013a. NPP Multi-Biome: Global Primary Production Data Initiative Products, R2. Data set. Available on-line [http://daac.ornl.gov] from the Oak Ridge National Laboratory Distributed Active Archive Center, Oak Ridge, Tennessee, USA. doi:10.3334/ORNLDAAC/617
Olson, R.J., J.M.O. Scurlock, S.D. Prince, D.L. Zheng, and K.R. Johnson (eds.). 2013b. NPP Multi-Biome: NPP and Driver Data for Ecosystem Model-Data Intercomparison, R2. Data set. Available on-line [http://daac.ornl.gov] from the Oak Ridge National Laboratory Distributed Active Archive Center, Oak Ridge, Tennessee, USA. doi:10.3334/ORNLDAAC/615