Get Data
Summary:
This data set provides three data files in text format (.txt). One file contains monthly biomass measurements and Net Primary Productivity (NPP) estimates made between April 1984 and July 1990 on a semi-natural tropical monsoon grassland in southern Thailand. The second file contains a year-long record of monthly biomass measurements and NPP estimates made on a portion of the same grassland that was accidentally burned in January 1985. The third file contains monthly and annual climate data for the study site for the period 1973-1989.
Two accidental fires occurred during the course of the study; the one in January 1985 burnt 40% of the study area and the other in February 1986 burnt most of the site. During 1985, sampling occurred simultaneously on unburned primary and burned secondary portions of the grassland; afterwards sampling continued on the primary site. Measurements of above- and below-ground live and dead biomass were made on the 15th day of each month.
NPP estimates were calculated from changes in biomass and decomposition rates in unburned areas from 1984 through 1986. From April 1984 to April 1985, NPP was 2,036 g/m2/yr, with below-ground organs contributing 23% of this total. Production in the unburned area in 1985 was substantially lower (1,677 g/m2/yr) which coincided with a 35% decrease in mean leaf area index. NPP in the 1985 burned area was only slightly lower (1,524 g/m2/yr); however, NPP was substantially lower after the second fire in 1986 (134 g/m2/yr).
Revision Notes: Only the documentation for this data set has been modified. The data files have been checked for accuracy and are identical to those originally published in 1996.
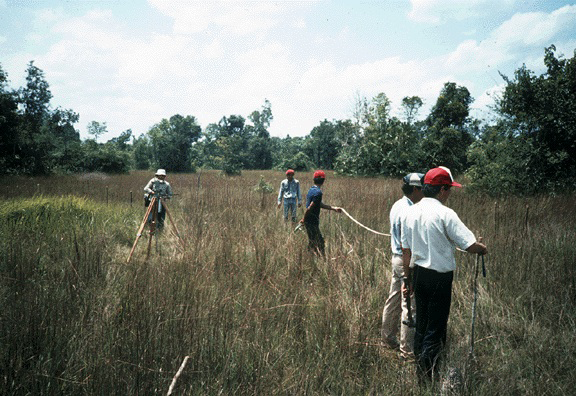
Figure 1. Initial study site surveying at the Klong Hoi Khong grassland site, Thailand. (Graduate students from Prince of Songkla University, Hat Yai, are marking out quadrat sampling blocks. Photograph taken April 1984 by Dr. J.M.O. Scurlock, ORNL).
Additional Documentation
The NPP data collection contains field measurements of biomass, estimated NPP, and climate data for terrestrial grassland, tropical forest, temperate forest, boreal forest, and tundra sites worldwide. Data were compiled from the published literature for intensively studied and well-documented individual field sites and from a number of previously compiled multi-site, multi-biome data sets of georeferenced NPP estimates. The principal compilation effort (Olson et al., 2001) was sponsored by the NASA Terrestrial Ecology Program. For more information, please visit the NPP web site at http://daac.ornl.gov/NPP/npp_home.shtml.
Data Citation:
Cite this data set as follows:
Kamnalrut, A. 2015. NPP Grassland: Klong Hoi Khong, Thailand, 1984-1990, R1. Data set. Available on-line [http://daac.ornl.gov] from Oak Ridge National Laboratory Distributed Active Archive Center, Oak Ridge, Tennessee, USA. http://dx.doi.org/10.3334/ORNLDAAC/147
This data set was originally published as:
Kamnalrut, A. 1996. NPP Grassland: Klong Hoi Khong, Thailand, 1984-1990. Data set. Available on-line [http://daac.ornl.gov] from Oak Ridge National Laboratory Distributed Active Archive Center, Oak Ridge, Tennessee, U.S.A.
Table of Contents:
- 1 Data Set Overview
- 2 Data Description
- 3 Applications and Derivation
- 4 Quality Assessment
- 5 Acquisition Materials and Methods
- 6 Data Access
- 7 References
1. Data Set Overview:
Project: Net Primary Productivity (NPP)
This work was carried out under the United Nations Environment Programme (UNEP) project on "Primary Productivity and Photosynthesis of Semi-Natural Ecosystems of the Tropics and Sub-tropics." The study commenced in 1984, and forms part of an ongoing project through support from UNEP and many other sources. Five sites were chosen for the project: a dry savanna in Nairobi National Park, Kenya; a monsoon savanna in the Klong Hoi Khong field site, Thailand; a saline grassland in the Montecillo field site, Mexico; a floodplain grassland on the island of Marchantaria (near Manaus), Brazil; and a bamboo stand in Miao Shan, China. Prior to this study, information on production, photosynthesis and carbon flow of grasslands (the world's largest terrestrial biome) was sparse in comparison to that for other biomes. Furthermore, research on temperate grasslands suggested that previous methods used [i.e., maximum-minimum method for shoots only or standard methods of the International Biological Programme (IBP)] underestimate production in tropical grasslands. New developments and advances in field and remote sensing methodologies not available to earlier IBP studies were identified by the UNEP project and a uniform approach was adopted, and tailored to the demographic characteristics of each site where necessary, for the UNEP study.
The Klong Hoi Khong data set contains contains a long time series of monthly biomass measurements and NPP estimates made between April 1984 and July 1990 on a tropical monsoon grassland belonging to Prince of Songkla University in southern Thailand. Two accidental fires occurred during the course of the study; the one in January 1985 burnt 40% of the study area and the other in February 1986 burnt most of the site. During 1985, sampling occurred simultaneously on unburned primary and burned secondary portions of the grassland; afterwards sampling continued on the primary site. Measurements of above- and below-ground live and dead biomass were made on the 15th day of each month.
Data for the study site were originally reported in Kamnalrut and Evenson (1992). NPP estimates were calculated from changes in biomass and decomposition of dead matter in unburned areas from 1984 through 1986. NPP for the first 12 months of the study (April 1984 to April 1985) was 2,036 g/m2/yr. Below-ground organs contributed 23% of this total. Production in the unburned area in 1985 was substantially lower, the total of the 12 months being 1,677 g/m2/yr. This decrease relative to 1984 coincided with a 35% decrease in mean leaf area index. In the 1985 burned secondary area, NPP was only slightly lower (1,524 g/m2/yr). NPP was substantially lower after the second fire. In 1986, on the site that was burned twice, NPP was only 134 g/m2/yr (Kamnalrut and Evenson, 1992). NPP values for this site are also reported in other published accounts. Differences are due to different measurement and calculation methods (Table 1).
Table 1. ANPP, BNPP, and TNPP values for unburned Klong Hoi Khong savanna reported by various published data sources.
| Source | Units | ANPP | BNPP | TNPP |
|---|---|---|---|---|
| Kamnalrut and Evenson (1992) | g/m2/yr | 1,568 | 468 | 2,0361 |
| Scurlock and Olson (2013) | 1,595 | 625 | 2,220 | |
| GPPDI Class B Site # 76 (MI 137) in Olson et al. (2013a) | gC/m2/yr | 170 | 50 | 220 |
| GPPDI Class B Site # 76 (MI 138) in Olson et al. (2013a) | 190 | 60 | 250 | |
| GPPDI Class B Site # 76 (MI 139) in Olson et al. (2013a) | 720 | 280 | 1,000 | |
| EMDI Class B site #76 in Olson et al. (2013b) | 360 | 130 | 490 |
Note: MI = Measurement identification number. 1This value covers the first 12 months of the study (April 1984 to April 1985) (Kamnalrut and Evenson, 1992).
2. Data Description:
Spatial Coverage
Site: Klong Hoi Khong, Thailand
Site Boundaries: (All latitude and longitude given in decimal degrees)
| Site (Region) | Westernmost Longitude | Easternmost Longitude | Northernmost Latitude | Southernmost Latitude | Elevation (m) |
|---|---|---|---|---|---|
| Klong Hoi Khong, Thailand | 100.93 | 100.93 | 6.33 | 6.33 | 30 |
Spatial Resolution
One hectare exclosure with 0.25-m2 quadrats in a randomized block design.
Temporal Coverage
1984/04/15-1990/07/15 for the primary study area (i.e., unburned portion until the fire of February 1986); 1985/01/15-1985/12/15 for the secondary study area (burned in January 1985) and 1973-1989 for the climate data. There are gaps in both time series.
Temporal Resolution
Monthly measurements made on the 15th day of each month.
Data File Information
Table 2. Data file descriptions
| FILE NAME | TEMPORAL COVERAGE | FILE CONTENTS |
|---|---|---|
| kln1_npp.txt | 1984/04/15-1990/07/15 | Monthly biomass and NPP data for the unburned portion of the monsoon grassland at Klong Hoi Khong, Thailand until the fire of February 1986 and then for the burned/recovering portion thereafter |
| kln2_npp.txt | 1985/01/15-1985/12/15 | Monthly biomass and NPP data for the portion of monsoon grassland at Klong Hoi Khong, Thailand that was burned in January 1985 |
| kln_cli.txt | 1973/01/01-1989/12/31 | Air temperature data from a weather station at the study site and precipitation data from a weather station at the Hat Yai airport 10-km from the study site |
NPP Data. The results of this study are provided in two text files (.txt format), one file for each treatment (Table 3). The variable values are delimited by semicolons. The first 18 lines are metadata; data records begin on line 19. Missing data are denoted by the value -999.9. All biomass units are expressed in g/m2 (dry matter weight). NPP units are expressed as g/m2 per sampling period (dry matter weight).
Table 3. Column headings in NPP file for the monsoon grasslands <kln1_npp.txt> and <kln2_npp.txt>
| COLUMN HEADING | DEFINITION | UNITS |
|---|---|---|
| Site | Site where data were gathered (code refers to site identification) | text |
| Treatmt | Long term management of site (code refers to treatment described in metadata in data file) | |
| Year | Year in which data were collected | yyyy |
| Mn | Month in which data were collected | mm |
| Dy | Day on which data were collected | dd |
| Tyear | Date in decimal year (year plus the Julian date divided by 365) | numeric |
| AGbiomass | Above-ground biomass. | g/m2 |
| Stdead | Standing dead biomass | |
| litter | Dead biomass found above ground | |
| AGtotmatter | Total above-ground biomass (live + dead + litter) | |
| BGbiomass | Below-ground live biomass | |
| BGdead | Below-ground dead biomass | |
| BGtotmatter | Total below-ground biomass (live + dead) | |
| ANPP | Above-ground net primary production | g/m2 per sampling period |
| BNPP | Below-ground net primary production |
Sample NPP Data Record for the primary study area (i.e., unburned portion of monsoon grassland until the fire of February 1986 and then the burned/recovering portion thereafter) <kln1_npp.txt>
| Site;Treatmt;Year;Mn;Dy;Tyear;AGbiomass;AGtotdead;Stdead;litter;AGtotmatter;BGbiomass;BGdead;BGtotmatter;
ANPP;BNPP [units g/m2] kln;1_lngtrm;1984;04;15;1984.290; 308.4; 427.4;-999.9; 735.7; 284.6; 372.8; 657.4;-999.9;-999.9 kln;1_lngtrm;1984;05;15;1984.370; 446.6; 648.8;-999.9;1095.4; 338.8; 153.2; 492.1; 424.5;-136.2 kln;1_lngtrm;1984;06;15;1984.460; 392.5; 526.1;-999.9; 918.6; 494.2; 252.1; 746.3; -50.5; 307.1 kln;1_lngtrm;1984;07;15;1984.540; 318.0; 525.8;-999.9; 843.8; 377.1; 173.6; 550.7; 35.6;-143.5 kln;1_lngtrm;1984;08;15;1984.620; 391.2; 603.1;-999.9; 994.3; 198.4; 86.9; 285.3; 277.2;-239.4 ... |
Sample NPP Data Record for the portion of monsoon grassland that was burned in January 1985 <kln2_npp.txt>
| Site;Treatmt;Year;Mn;Dy;Tyear;AGbiomass;Stdead;litter;AGtotmatter;BGbiomass;BGdead;BGtotmatter [units g/m2] kln;2_burn85;1985;01;15;1985.040; 16.0;-999.9;-999.9; 97.6; 390.4; 240.5; 630.9;-999.9;-999.9 kln;2_burn85;1985;02;15;1985.130; 76.6;-999.9;-999.9; 147.6; 365.0; 147.6; 512.6; 64.9; -74.1 kln;2_burn85;1985;03;15;1985.200; 134.4;-999.9;-999.9; 200.0; 363.5; 104.6; 468.2; 65.5; 15.2 kln;2_burn85;1985;04;15;1985.290; 201.2;-999.9;-999.9; 324.0; 676.9; 115.0; 791.9; 151.0; 344.4 kln;2_burn85;1985;05;15;1985.370; 226.8;-999.9;-999.9; 348.5; 399.5; 110.9; 510.4; 31.8;-259.3 ... |
Climate Data. Climate data are provided in one text file (.txt format). The first lines are metadata and the variable values are delimited by semicolons. There are no missing values.
Sample Climate Data Record
| Site;Temp;Parm; Jan; Feb; Mar; Apr; May; Jun; Jul; Aug; Sep; Oct; Nov; Dec; Year kln;mean;prec; 44.9; 13.0; 45.9;109.9;181.1; 92.9;104.1;101.5;164.1;217.1;266.5;200.1;1541.1 kln;mean;tmax; 30.8; 32.5; 34.0; 34.3; 33.4; 33.3; 32.9; 33.1; 32.1; 31.6; 30.3; 29.8; 34.9 kln;mean;tmin; 21.4; 21.7; 22.5; 23.7; 24.2; 23.4; 23.1; 23.2; 23.3; 23.5; 23.0; 22.2; 21.1 kln;numb;prec; 17.0; 17.0; 17.0; 17.0; 17.0; 17.0; 17.0; 17.0; 17.0; 17.0; 17.0; 17.0; 17.0 kln;numb;tmax; 17.0; 17.0; 17.0; 17.0; 17.0; 17.0; 17.0; 17.0; 17.0; 17.0; 17.0; 17.0; 17.0 kln;numb;tmin; 17.0; 17.0; 17.0; 17.0; 17.0; 17.0; 17.0; 17.0; 17.0; 17.0; 17.0; 17.0; 17.0 kln;stdv;prec; 90.1; 18.1; 43.4; 80.6; 53.9; 47.1; 53.5; 68.3; 61.4;117.4;147.0;137.3; 199.3 kln;stdv;tmax; 1.0; 1.0; 1.1; 1.4; 0.7; 1.0; 0.9; 1.1; 0.4; 0.6; 1.1; 1.1; 0.8 kln;stdv;tmin; 0.8; 0.6; 0.6; 1.2; 1.3; 0.5; 0.5; 0.5; 0.8; 1.0; 0.9; 0.5; 0.6 kln;1973;prec; 38.0; 10.0; 85.0; 86.0;153.0;116.0; 95.0;141.0; 60.0;244.0;239.0;116.0;1383.0 kln;1973;tmax; 31.0; 32.7; 34.1; 35.7; 33.6; 33.3; 32.8; 32.1; 32.1; 30.5; 29.4; 27.9; 35.7 kln;1973;tmin; 22.0; 22.1; 22.7; 23.5; 23.8; 24.1; 23.7; 23.3; 23.1; 23.3; 23.1; 22.1; 22.0 kln;1974;prec; 11.0; 69.0; 27.0;110.0;198.0;119.0; 70.0; 71.0;115.0; 99.0;430.0;248.0;1567.0 kln;1974;tmax; 28.6; 31.3; 32.4; 33.2; 33.0; 32.3; 33.6; 32.4; 32.1; 32.5; 30.2; 30.4; 33.6 kln;1974;tmin; 20.6; 21.6; 21.5; 23.2; 23.3; 23.4; 22.8; 23.4; 22.8; 22.9; 22.0; 22.0; 20.6 … Where, Temp (temporal) - specific year or long-term statistic: mean = mean based on all years numb = number of years stdv = standard deviation based Parm (parameter): prec = precipitation for month or year (mm) tmin = minimum temperature for month or year (C) tmax = maximum temperature for month or year (C) |
3. Data Application and Derivation:
Primary production and the factors that influence it have been studied in various grassland ecosystems around the world but prior to this undertaking, no studies of monsoon grassland productivity in southeast Asia had been reported and most previous studies in tropical grasslands had not taken mortality between harvests into account. This study aimed to assess total NPP of a semi-natural monsoon grassland by monitoring monthly changes in above- and below-ground biomass, dead material, and decomposition. Accidental fires at the study site allowed the study of the recovery of production.
This work was carried out under the United Nations Environment Programme (UNEP) project on "Primary P and Photosynthesis of Semi-Natural Ecosystems of the Tropics and Sub-tropics." The data collected by this study contribute greatly to the understanding of the structures and production capacities of the several types of grassland ecosystems.
Grassland biomass dynamics data for Klong Hoi Khong are provided for comparison with models and estimation of NPP. Climate data are provided for use in driving ecosystem/NPP models.
4. Quality Assessment:
NPP of grasslands is subject to a number of different methods of estimation from biomass data, some of which may be inappropriate for particular biome types. Methodology of estimation/calculation needs to be taken into account, as well as methodology of measurement, when making comparisons between different regions. Errors in biomass measurement may also occur between different study sites. For short time series of data it may be assumed that measurement methodology remains consistent; however, over very long time series changes in staff, tools, etc. may lead to "calibration" errors.
Prior to this undertaking, no studies of monsoon grassland productivity in southeast Asia had been reported. However, previous work by Caldwell (1975) and Singh and Joshi (1979) suggested that NPP for this biome should range from 40 to 3,810 g/m2/yr. NPP for Klong Hoi Khong calculated from changes in biomass and decomposition of dead matter were within the mid to upper part of this range prior to the second fire and exceed the 1,000 g/m2/yr average suggested by Murphy (1975) (although the difference in the latter is more likely methodological than environmental).
The variability of biomass and NPP between years and between treatments at Klong Hoi Khong reflects the dominant influence of climatic and physical factors on this ecosystem. On a seasonal basis, total biomass correlated well with the amount of rainfall received. Lower production after repeated burning indicated depleted reserves and a decreased capacity to recover.
5. Data Acquisition Materials and Methods:
Site description
The Klong Hoi Khong study site is a semi-natural moist type of tropical grassland. The study site of several hectares is situated within a larger experimental field area belonging to Prince of Songkla University in southern Thailand, about 40-km southwest of Hat Yai in Songkhla Province. This area is climatically classified as wet monsoonal tropics where maximum and minimum temperatures show only small seasonal fluctuations while the rainfall pattern exhibits extreme seasonal variability. Temperature data collected at the study site yielded maximum/minimum ranges of 34.9/21.1 degrees C and mean annual rainfall recorded at the meteorological station at Hat Yai airport (10-km from the study site) averaged 1,541 mm over the 1973-1989 period. Prolonged periods of precipitation around the monsoons are interrupted by only 2-3 months of dry weather.
In tropical monsoonal southeast Asia, evergreen forests are regarded as climatic climax vegetation. However, ancient shifting cultivation in the region, in association with poor drainage, infertile soils, and periodic fires, has converted many tropical forests to a continuous grass/sedge stratum surrounding isolated trees and clumps of trees (5-12 m tall). The grasslands are commonly burned during the dry season to encourage grassland regrowth for grazing during the rainy season. The study site has supported a humid savanna for at least 50-100 years with very occasional cattle grazing but, like much of the region, is under pressure for conversion to arable crops or rubber plantations (Kamnalrut and Evenson, 1992; Long et al., 1989).
Soil at the study site is a humic gley with an average A horizon depth of 40 cm. It is formed from old alluvial parent material and is poorly drained, often sodded or flooded at the end of the wet season. During the dry period, the water table can drop to 4 m below surface.
The vegetation of the study site is a continuous grassland with scattered trees. Grasses constitute >60% of the community cover, with Eulalia trispicata and Lophopogon intermedius dominating the grass species. Sedges account for about 10% of cover, with Fimbristylis tristachya the most abundant. Dillenia hookerii is the commonest dicotyledonous ground cover, and Dipterocarpus obtusifolius is the major tree species.
Table 4. Site characteristics
| Description | Values |
|---|---|
| mean annual precipitation | 1,541.1 mm |
| mean monthly minimum temperature | 21.4 C (Jan) |
| mean monthly maximum temperature | 34.3 (C) (Apr) |
| vegetation type | humid savanna |
| dominant species | Eulalia trispicata (C4) |
| historical long-term management regime | converted from forest 50-100 years ago; fire every 5 years |
| max above-ground live biomass (typical month) | 442 g/m2 (Nov) |
| soil type | humic gley |
| soil pH | 5.5 (0-20 CM) |
| soil texture (sand/ silt/ clay) | 0.58 / 0.40 / 0.02 |
| soil carbon content | 1.1% OM (0-20 cm) |
| soil nitrogen content | 0.066% (0-20 cm) |
Changes in live biomass and dead matter, above and below ground, were measured at monthly intervals (Kamnalrut and Evenson, 1992; Long et al., 1989; Roberts et al., 1985).
Dry weight of each above-ground category was determined each month by clipping to ground level within 20 quadrats, 1.0-m x 0.25-m, located by a randomized block design. Clipped material from each quadrat was sub-sampled to approx. 100 g fresh weight before sorting. Litter (fallen dead matter) was carefully swept and collected from the area of each quadrat. Live leaves were separated from dead on the basis of tissue necrosis, dead portions being removed from otherwise green leaves. Similar sorting methods were used for stems, paying attention to removal of dead sheaths from live stems.
Below-ground plant matter was sampled by removing soil cores from the center of each quadrat. For the first two years of data collection, 5-10 soil cores were taken each month. Later measurements comprised 40 soil cores combined in groups of four to make 10 samples (in order to reduce sample variance). Soil cores were taken to a 15 cm depth, since initial studies showed that this accounted for more than 90% of the root system. Soil cores were washed over a 2-mm sieve, since ability to pass through a 2-mm mesh was taken as the arbitrary division between recognizable dead matter and particulate organic matter (for both above- and below-ground matter). Large roots were removed and weighed separately from fine roots (<1-mm diameter). Fine roots were sub-sampled to about 1.0 g fresh weight. Live and dead roots were separated on the basis of tissue necrosis, using vital staining with tetrazolium salts where visual discrimination was not otherwise possible.
All sorted plant matter was thoroughly washed and dried to constant weight at 90 degrees C.
Monthly decomposition rates were determined using litter bags. Dead above-ground matter was placed at the ground surface, and dead below-ground matter was inserted at 5 cm depth with the soil carefully replaced above the litter bag. Litter bags were of 2-mm nylon mesh, 8-cm x 6-cm, containing approx. 2.0 g dead matter obtained at random from the previous monthly sample. They were recovered from the field after one month, their contents washed over a 2-mm mesh sieve and dried to constant weight. Loss of material was taken to be the rate at which a random sample of dead matter would decompose over that month, and was expressed as a relative rate of decomposition.
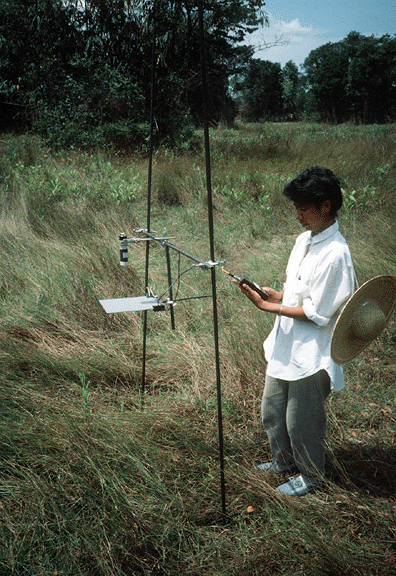
Figure 2. Canopy reflectance measurement within the Klong Hoi Khong grassland site, Thailand. (A graduate student from Prince of Songkla University, Hat Yai, is using a red/near-infrared spectral ratio meter. Photograph taken April 1986 by Dr. J.M.O. Scurlock, ORNL).
6. Data Access:
This data set is available through the Oak Ridge National Laboratory (ORNL) Distributed Active Archive Center (DAAC).
Data Archive:
Web Site: http://daac.ornl.gov
Contact for Data Center Access Information:
E-mail: uso@daac.ornl.gov
Telephone: +1 (865) 241-3952
7. References:
Caldwell, M.M. 1975. Primary production of grazing lands, pp. 41-74. IN: Cooper, J.P. (ed.). Photosynthesis and Productivity in Different Environments. IBP Vol. 3. Cambridge University Press, Cambridge. 739 pp.
Kamnalrut, A., and J.P. Evenson. 1992. Monsoon grassland in Thailand, pp. 100-126. IN: Long, S.P., M.B. Jones, and M.J. Roberts (eds.). Primary Productivity of Grass Ecosystems of the Tropics and Sub-tropics. Chapman and Hall, London. 267 pp.
Long, S.P., and M.B. Jones. 1992. Introduction, aims, goals, and general methods, pp. 1-24. IN: Long, S.P., M.B. Jones, and M.J. Roberts (eds.). Primary Productivity of Grass Ecosystems of the Tropics and Sub-tropics. Chapman and Hall, London. 267 pp.
Long, S.P., E. Garcia Moya, S.K. Imbamba, A. Kamnalrut, M.T.F. Piedade, J.M.O. Scurlock, Y.K. Shen, and D.O. Hall. 1989. Primary productivity of natural grass ecosystems of the tropics: A reappraisal. Plant and Soil 115(2): 155-166.
Murphy, P.G. 1975. Net primary production in terrestrial ecosystems, 217-231. IN: Lieth, H., and R.H. Whittaker (eds.). Primary Productivity of the Biosphere. Springer-Verlag, Berlin. 352 pp.
Olson, R.J., K.R. Johnson, D.L. Zheng, and J.M.O. Scurlock. 2001. Global and Regional Ecosystem Modeling: Databases of Model Drivers and Validation Measurements. ORNL Technical Memorandum TM-2001/196. Oak Ridge National Laboratory, Oak Ridge, Tennessee, U.S.A.
Olson, R.J., J.M.O. Scurlock, S.D. Prince, D.L. Zheng, and K.R. Johnson (eds.). 2013a. NPP Multi-Biome: Global Primary Production Data Initiative Products, R2. Data set. Available on-line [http://daac.ornl.gov] from the Oak Ridge National Laboratory Distributed Active Archive Center, Oak Ridge, Tennessee, U.S.A. doi:10.3334/ORNLDAAC/617
Olson, R.J., J.M.O. Scurlock, S.D. Prince, D.L. Zheng, and K.R. Johnson (eds.). 2013b. NPP Multi-Biome: NPP and Driver Data for Ecosystem Model-Data Intercomparison, R2. Data set. Available on-line [http://daac.ornl.gov] from the Oak Ridge National Laboratory Distributed Active Archive Center, Oak Ridge, Tennessee, U.S.A. doi:10.3334/ORNLDAAC/615
Roberts, M.J., S.P. Long, L.L. Tieszen, and C.L. Beadle. 1985. Measurement of plant biomass and net primary production of herbaceous vegetation, pp. 1-19. IN: Coombs, J., D.O. Hall, S.P. Long, and J.M.O. Scurlock (eds.). Techniques in Bioproductivity and Photosynthesis, 2nd Edition. Pergamon Press, Oxford. 200 pp.
Scurlock, J.M.O., and R.J. Olson. 2013. NPP Multi-Biome: Grassland, Boreal Forest, and Tropical Forest Sites, 1939-1996, R1. Data set. Available on-line [http://daac.ornl.gov] from Oak Ridge National Laboratory Distributed Active Archive Center, Oak Ridge, Tennessee, U.S.A. doi:10.3334/ORNLDAAC/653
Singh, J.S., and M.C. Joshi. 1979. Tropical grasslands: primary production, pp. 197-218. IN: Coupland, R.T. (ed). Grassland Ecosystems of the World: Analysis of Grasslands and Their Uses. IBP Vol. 18. Cambridge University Press, Cambridge. 432 pp.