Get Data
Summary:
This data set contains three files (.txt format). Two of the files contain stand characteristics, above- and below-ground biomass, and above- and below-ground production allocation data for Scots pine (Pinus sylvestris) forests near Jadraas, Sweden. One file is for a young regenerating forest (14-20 years old), and the other is for an old-growth forest (120-125 years old). The field measurements were made by destructive and non-destructive methods between 1973 and 1983. The third file contains climate data recorded at the Jadraas site from 1974 through 1990.
The research was conducted under the auspices of the SWECON (Swedish Coniferous Forest Biome) Project to enhance understanding of plant biomass dynamics and factors regulating plant growth. Most of the research concerned plant and vegetation processes, but particular interest was also given to soil processes, consumption processes, and energy and water exchange in the canopy and the soil.
Total net primary production (NPP) in the young forest was estimated at 860 g/m2/year (above-ground = 372 g/m2/year; below-ground = 488 g/m2/year). NPP for the old-growth forest was not calculated; however, the data set contains estimates of branch and trunk growth (43 g/m2/year and 106 g/m2/year, respectively), annual litterfall (135-162 g/m2/year), needle grazing loss (1.55 g/m2/year), fine tree root production (188 g/m2/year), and understory root production (30 g/m2/year).
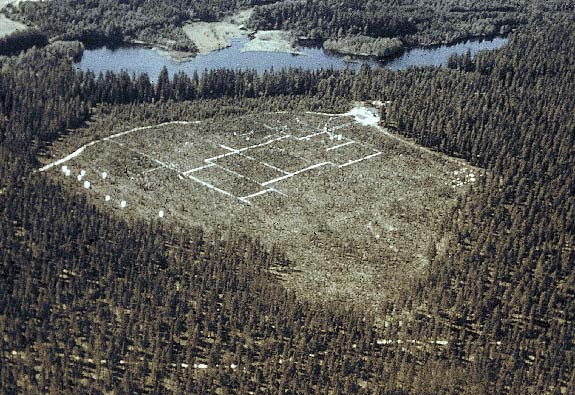
Figure 1. General view of the "Ih II" experimental area of young (15-years-old) Pinus sylvestris at the Jadraas study
site, Sweden. (The layout of treatment plots and wooden walkways can be seen. The experiment is surrounded
by mature forest about 120 years old. Photograph taken summer 1975.)
Revision Notes: The NPP data file has been split into two files, one for the young regenerating forest and one for old-growth forest . The data files have been revised to correct previously reported data and information and to add new data from published sources. Please see the Data Set Revisions section of this document for detailed information.
Additional Documentation:
The NPP data collection contains field measurements of biomass, estimated NPP, and climate data for terrestrial grassland, tropical forest, temperate forest, boreal forest, and tundra sites worldwide. Data were compiled from the published literature for intensively studied and well-documented individual field sites and from a number of previously compiled multi-site, multi-biome data sets of georeferenced NPP estimates. The principal compilation effort (Olson et al., 2001) was sponsored by the NASA Terrestrial Ecology Program. For more information, please visit the NPP web site at http://daac.ornl.gov/NPP/npp_home.html.
Data Citation:
Cite this data set as follows:
Linder, S., and G. I. Agren. 2013. NPP Boreal Forest: Jadraas , Sweden, 1973-1990, R1. Data set. Available on-line [http://daac.ornl.gov] from Oak Ridge National Laboratory Distributed Active Archive Center, Oak Ridge, Tennessee, USA. doi:10.3334/ORNLDAAC/202
This data set was originally published as:
Linder, S., and G. I. Agren. 1998. NPP Boreal Forest: Jadraas , Sweden, 1973-1980. Data set. Available on-line [http://daac.ornl.gov] from Oak Ridge National Laboratory Distributed Active Archive Center, Oak Ridge, Tennessee, USA
Table of Contents:
- 1 Data Set Overview
- 2 Data Description
- 3 Applications and Derivation
- 4 Quality Assessment
- 5 Acquisition Materials and Methods
- 6 Data Access
- 7 References
- 8 Data Set Revision Information
1. Data Set Overview:
Project: Net Primary Productivity (NPP)
Productivity of a boreal coniferous forest was determined at the Jadraas research site under the SWECON (Swedish Coniferous Forest Biome) Project which started in 1972. In this intensive study, the dynamics of above- and below-ground biomass were monitored, together with energy and water budgets, and nutrient and soil processes, from 1973 through 1983. Some experimental treatments and measurements have continued beyond 1983 but are not included in this data set.
The 1.5 x 2.5 km Jadraas study site (60.82 N 16.50 E) is situated at Ivantjärnsheden near Jadraas in central Sweden, at the southern limit of the "northern coniferous" region, about 30 km northwest of the town of Gävle. The site experiences cool summers with long days, and long, cold winters. Summer droughts occur because of the sandy soils with low water storage capacity. Land use history in the region includes forest grazing, burning for crops and grazing, charcoal burning, tar burning, logging, and tree felling for paper pulp. Charcoal and tar burning probably dominated recent land use at Jadraas , and the site was probably completely treeless around 1850-1860 due to charcoal consumption for smelting.
The research plots at the site represent an age series of Scots pine (Pinus sylvestris) forest stands, ranging from those which were clear-felled in 1977 (Plot "Ih 0") to those which were 125 years old in 1979 (i.e., established about 1854; Plot "Ih V"). The studies of ecosystem productivity that are included in this data set were concentrated in Plot "Ih II" which was harvested in 1957 and thinned of seed trees in 1962 (and thus being between 14 and 20 years old when the productivity measurements were made), and in Plot "Ih V" which was 120-125 years old when productivity measurements were made. Although several fertilization and irrigation treatments were made in different areas within Plot "Ih II," the data presented herein are from untreated (control) plots. Similarly, the Plot "Ih V" was untreated.
Total net primary production of the 20-year-old untreated stand (Plot "Ih II") in 1979 was estimated at 860 g/m2/year (above-ground = 372 g/m2/year; below-ground = 488 g/m2/year) (Linder and Axelsson, 1982; Persson, 1980b; Scurlock and Olson, 2012). Estimates of TNPP for the 120-125 year-old stand are not reported in this data set; however, the data set contains estimates of branch and trunk growth (43 g/m2/year and 106 g/m2/year, respectively), annual litterfall (135-162 g/m2/year), needle grazing loss (1.55 g/m2/year), fine tree root production (188 g/m2/year), and understory root production (30 g/m2/year) from various studies (Bringmark, 1977 and Persson, 1980a).
As reported in the cited literature (but not presented herein), TPP was doubled in the irrigated and fertilized treatment areas in Plot "Ih II" to 1,680 g/m2/ year, with more carbon allocated to shoot than root growth (above-ground = 1,222 g/m2/year; below-ground = 724 g/m2/ year). Fertilization resulted in dramatic increases in productivity, persisting long after treatment was discontinued. Irrigation did not significantly increase productivity, with or without fertilizer.
ANPP, BNPP, and TNPP estimates for Jadraas untreated sites are also reported Gower et al. (2001; 2012) and Olson et al. (2012a; b) (Table 1).
Table 1. ANPP, BNPP, and TNPP values reported by various published data sources
| File Name or Description | Data Source(s) | Sub-Site | ANPP | BNPP | TNPP |
|---|---|---|---|---|---|
| gC/m2/year | |||||
| jdr1_npp_r1.txt | Agren et al. (1980)1,2 | jdr Ih_II (14-yr-old stand) | 54 | 91 | 145 |
| Linder and Axelsson (1982) and Persson (1980b)1,3 | jdr Ih_II (20-yr-old stand) | 177 | 232 | 409 | |
| jdr2_npp_r1.txt | Bringmark (1977) and Persson (1980a)1,4 | jdr Ih_V (120-yr-old stand) | 135 | 104 | 239 |
| NPP_Multibiome_EnvReview _Table_A1_R1.xls |
Scurlock and Olson (2012) based on Linder and Axelsson (1982) and Persson (1980a)1 | jdr (20-yr-old stand) | 177 | 232 | 409 |
| GPPDI_ClassA_NPP_162_R2.csv | Olson et al. (2012a) | Class 137 (MI 133) (14-yr-old stand based on Agren et al. (1980)5 | 56 | NA | 152 |
| Class 137 (MI 134) (20-yr-old stand based on ORNL estimates) | 177 | 232 | 409 | ||
| Class 137 (MI 131) (20-yr-old stand based on Linder and Axelsson (1982) | 176 | 285 | 462 | ||
| Class A 137 (MI 132) (120-yr-old stand based Bringmark (1977) and Persson (1980a)1 | 138 | 103 | 240 | ||
| EMDI_ClassA_NPP_81_R2.csv | Olson et al. (2012b) | Class A 1376 | 137 | 207 | 316 |
| borfornpp2.csv | Gower et al. (2001; 2012) | Class II Jadraas 14-yr7 | 56 | NA | NA |
| borfornpp1_r1.csv | Class I Jadraas 20-yr8 | 177 | 285 | 462 | |
| Class I Jadraas 120-yr9 | 138 | 103 | 241 | ||
Notes: NA = Not available. MI = Measurement identification number.
The differences in NPP values reported in this table are mainly due to differences in calculation methods, as explained in these notes.
Please consult original references for details.
Please see the Data Set Revisions
section of this document for detailed information on the revised data sets
(R1, R2, etc.).
1For this table, NPP data from the original data source were converted from grams of dry weight per meter square per year
to grams of carbon per meter square per year using a conversion factor of 0.475.
2NPP values are estimates for "average tree" summed to stand level
3ANPP estimates are based on measurements of branch + trunk + stump growth (90 gC/m2/yr) plus needle
growth (87 gC/m2/yr).
BNPP estimates are based on measurements of fine root growth (190 gC/m2/yr) + coarse root growth (42 gC/m2/yr).
4ANPP estimates are based on measurements of branch + trunk growth (71 gC/m2/yr)
plus litterfall (64 gC/m2/yr). BNPP estimates are based on measurements
of fine root production (89.3 gC/m2/yr) + understory root production (14.3 gC/m2/yr).
5ANPP and TNPP estimates from the original data source were converted from grams of dry weight per meter
square per year to grams of carbon per meter square per year using a conversion factor of 0.5.
6ANPP is the average
of 4 values reported in the GPPDI data file. BNPP is the average of 3 values reported in the GPPDI data file.
TNPP = ANPP + BNPP based on these averages.
7ANPP estimate from the original data source was converted from grams of dry weight per
meter square per year to grams of carbon per meter square per year using a conversion factor of 0.5.
8ANPP estimates are based on allometry calculations of branch + trunk + stump growth (102 gC/m2/yr)
needle growth (75 gC/m2/yr). BNPP estimates are based on allometry calculations
of fine root growth (230 gC/m2/yr) + coarse root growth (55 gC/m2/yr).
9ANPP estimates are based on allometry calculations of branch + trunk + stump growth (75 gC/m2/yr)
plus needle growth (63 gC/m2/yr).
There is no estimate of fine root growth or coarse root growth in source although a total BNPP estimate based
on allometry calculations is provided.
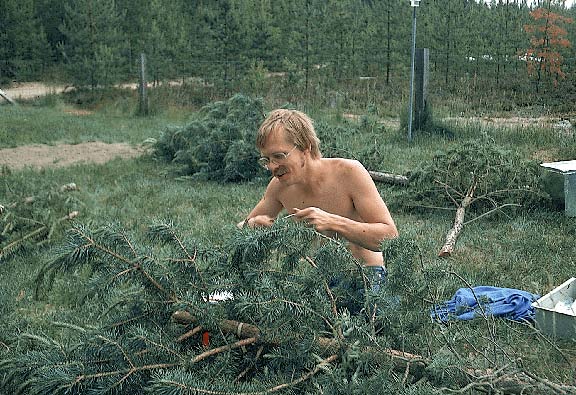
Figure 2. Destructive measurements on young Pinus sylvestris at the Jadraas study site, Sweden. (Bo Johansson, SWECON Project technician, is determining shoot length. Photograph taken June 1976 by Dr. S. Linder, Swedish University of Agricultural Sciences, Uppsala.).
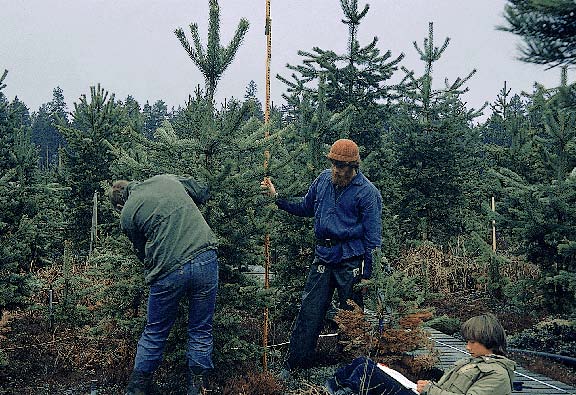
Figure 3. Non-destructive measurements on young Pinus sylvestris at the Jadraas study site, Sweden. (Photograph taken 18th May 1978 by Dr. B. Axelsson, Swedish University of Agricultural Sciences, Uppsala).
2. Data Description:
This data set contains three text files. Two of the files contain stand characteristics, above- and below-ground biomass, and above- and below-ground production allocation data for Scots pine (Pinus sylvestris) forests near Jadraas , Sweden. One file is for a young regenerating forest (14-20 years old) and the other is for an old-growth forest (120-125 years old). The field measurements were made by destructive and non-destructive methods between 1973 and 1983. The third file contains climate data recorded at the Jadraas site from 1974 through 1990.
Spatial Coverage
Site: Jadraas , Sweden
| Site (Region) | Westernmost Longitude | Easternmost Longitude | Northernmost Latitude | Southernmost Latitude | Elevation (m) |
|---|---|---|---|---|---|
| Jadraas , Sweden; | 16.50 | 16.50 | 60.82 | 60.82 | 185 |
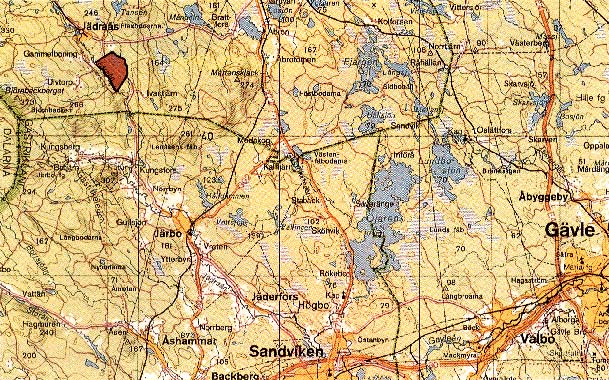
Figure 4. Location map for Jadraas Experimental Forest, which is administered by the Swedish University of Agricultural Sciences, Uppsala, Sweden. The Jadraas site is marked in red in the top left side of the map; it comprises 360 hectares, of which 275 hectares are fertile forest land. The land is owned by the forest company STORA. Map reproduced by kind permission of Dr. S. Linder and the Swedish University of Agricultural Sciences.
Site Information
Ivantjarnsheden is a Scots pine - heath - lichen stand on sand at Jadraas in central Sweden. It was chosen as the main research site for the SWECON because of the homogeneity of substrates, dry soils with fairly even percolation and without influence of water table close to the soil surface, and representative forest ecosystems that occur throughout Sweden. The research plots were selected so as to represent different stages in the rotation period of a pine stand.
Ivantjarnsheden is located just north of the border between the Boreal (northern coniferous or taiga) zone of northern Sweden and the Boreo-nemoral (southern coniferous) zone of southern Sweden. The transition is comparatively narrow with regard to topography, geography, climate, and biogeography. It contains both northern and southern plant and animal species. The research area is a level sedimentary sandy plain at 185 m above mean sea level (M.S.L.). The vegetation is mainly a dry pine - dwarf shrub - lichen heath of the Cladonio-Pinetum (boreale) association or the lichen and lichen-dwarf-shrub forest type growing on an ordinary podsol.
Within the research site, the dominant soil particle sizes at 15 cm depth are fine to medium sand (0.125-0.5 mm), much of which is aeolian in origin. At 70 cm depth, the textural composition varies between subareas with particles sizes ranging broadly from fine to coarse sand (0.125-1 mm).
The research plots represent an age-series of Scots pine forest stands from clear-felled in 1977 (Plot "Ih 0") to a 125-year-old stand in 1979 (i.e., established about 1854; Plot "Ih V"). This data set provides measurements from the control, untreated section of Plot "Ih II" and from Plot "Ih V" (also untreated).
Plot "Ih II" was harvested in 1957 and the seed trees thinned in 1962. Fertilization and irrigation treatments commenced in certain sections of the naturally-regenerated "Ih II" plot from about 1960. The control plot in "Ih II" did not receive any treatments and was about 14 years old when productivity measurements started in 1974. The study plots range in size (50 x 50 m or 30 x 30 m quadrats) with smaller subplots of 10 x 10 quadrats. The control Plot "Ih II" is a level, regenerating forest opening surrounded by a mature pine stand (see Figure 1). Dominant soil particles are medium sand at 15 cm and medium to coarse sand at 70 cm depth. The ground water table is 10 m depth at its upper level.
The topography of Plot "Ih V" is also level. It lies in the center of the dominant tree stand of the heath and is probably the most representative of the plots. Dominant soils are fine, medium, and coarse sand at 15 cm depth and medium and coarse sand at 70 cm depth. The ground water table is 10 m depth at its upper level. The vegetation belongs to the Cladonio-Pinetum (boreale) association. The ground vegetation is fairly stabilized from the successional view-point. Biomass estimates indicate somewhat smaller amounts of field layer (Calluna vulgaris and Vaccinium vitis-idaea) than of the bottom layer (Pleurozium schreberi, Cladonia rangiferina, and C. silvatica). The pine tree stand is fairly thin with suppressed spruce underneath. The stand originated in the 1850s and was lightly thinned in about 1962.
In the study plots, elevated walking bridges of untreated wood were placed along the most frequent pathways to prevent damage to vegetation and compaction of soil in both plots. Plot "Ih II" is surrounded by a high fence and Plot "Ih V" by a low one to prevent browsing by moose.
Climate data in this data set are available for the period 1974-1990 from a weather station at the boreal forest site. Mean maximum temperature during the study period was 7.6 degrees C and mean minimum temperature was -0.7 degrees C. Mean annual precipitation during the same time period was 731 mm, with mean annual amounts ranging between 431 and 901 mm. The growing season in the Jadraas area, defined as daily mean air temperature exceeding 6 C, lasts for 161 days on average (May 4-October 12). Occurrence of frost during the growing season is frequent.
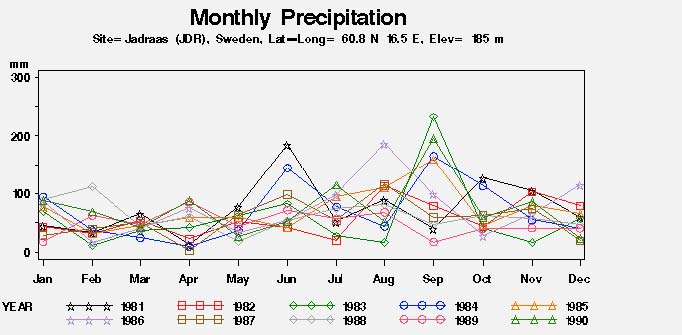
Figure 5. Monthly precipitation 1981-1990 at the Jadraas boreal forest site, Sweden.
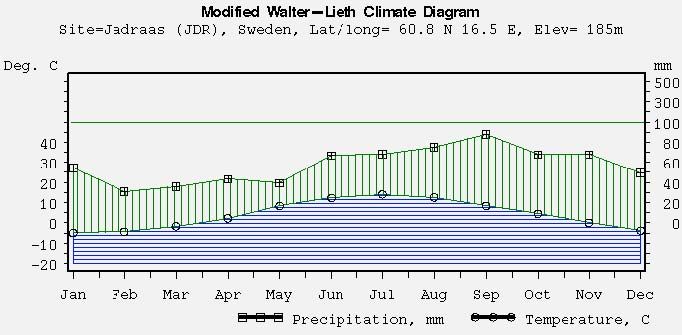
Figure 6. Modified Walter-Lieth climate diagram based upon mean temperature and precipitation data for the Jadraas boreal forest site, Sweden. (criss-cross red shading, where present - period of relative drought; vertical green shading - period of relative humid season).
Spatial Resolution
The Jadraas study site was 1.5 x 2.5 km in total size. The research plots were divided into regular grids of 50 x 50 or 30 x 30 m quadrats which were further subdivided into 10 x 10 m quadrats. Permanent 0.5 x 0.5 m quadrats were randomly distributed inside the larger 10 x 10 m quadrats for non-destructive cover estimates of the field and bottom layers. Soil sampling sites were 1 x 1 m plots within 5-20 randomly placed 10 x 10 m quadrats. Root biomass cores had an area of 36.26 cm2.
Temporal Coverage
Stand structure, biomass, and productivity measurements were made on different occasions during the growing seasons (May-November) between 1973 and 1983. Climate data are available from 1974 through 1990.
Temporal Resolution
Above- and below- ground tree layer stand characteristics, biomass, and productivity measurements were made at Plot "Ih II" when the stand was 14 years old and again when it was 15-20 years old. Tree biomass and production measurements were made at Plot "Ih V" when the stand was 120 and 125 years old . Stand characteristics and vegetation and soil nutrient content were measured in Plot "Ih V" when the stand was 117-118 years old. Cover analyses of the field and bottom layers at Plots "Ih II" and "Ih V" were carried out each year during August-October. Root sampling took place at intervals of 2-3 weeks during the growing season.
All NPP estimates are based on plant dry matter accumulation, expressed as g/m2 (dry matter weight). Climate data are expressed as monthly and annual precipitation amounts (mm) and monthly and annual average maximum/minimum temperature (C). Monthly and annual climatic means are provided for the 1974-1990 period.
Data File Information
Table 2. Data files in this data set archive
| FILE NAME | TEMPORAL COVERAGE | FILE CONTENTS |
|---|---|---|
| jdr1_npp_r1.txt | 1973/05/01-1980/11/31 | Stand characteristics, above- and below-ground biomass, and above- and below-ground production allocation data for a young regenerating (untreated) boreal forest near Jadraas , Sweden |
| jdr2_npp_r1.txt | 1973/05/01-1983/11/30 | Stand characteristics, above- and below-ground biomass, and above- and below-ground production allocation data for an old-growth (untreated) boreal forest near Jadraas , Sweden |
| jdr_cli.txt | 1974/01/01-1990/12/31 | Monthly and annual precipitation amount and maximum/minimum temperature data from a weather station at the boreal forest site near Jadraas , Sweden |
NPP Data. NPP estimates for the Jadraas , Sweden sites are provided in two text files (.txt format, Table 2), one for each site. The variable values are delimited by semi-colons. The first 18 lines are metadata; data records begin on line 19. The value -999.9 is used to denote missing values. All NPP units are in g/m2 (dry matter weight).
Sample NPP Data Record (jdr1_npp_r1.txt)
| Site; Treatmt; Year; Month; Day; parameter; amount; units; Reference/ Comments jdr; Ih_II; 1974; -999.9; -999.9; stand_age; 14; years; Agren et al. (1980) "average tree" jdr; Ih_II; 1974; -999.9; -999.9; height; 278; cm; Agren et al. (1980) "average tree" jdr; Ih_II; 1974; -999.9; -999.9; needles; 123.0; g/m2; Agren et al. (1980) "average tree" jdr; Ih_II; 1974; -999.9; -999.9; branches; 62.4; g/m2; Agren et al. (1980) "average tree" jdr; Ih_II; 1974; -999.9; -999.9; trunks; 125.6; g/m2;; Agren et al. (1980) "average tree" jdr; Ih_II; 1974; -999.9; -999.9; ANPP; 113; g/m2/year; Agren et al. (1980) "average tree" jdr; Ih_II; 1974; -999.9; -999.9; BNPP; 192; g/m2/year; Agren et al. (1980) "average tree" jdr; Ih_II; 1974; -999.9; -999.9; TNPP; 305; g/m2/year; Agren et al. (1980) "average tree" ... |
Sample NPP Data Record (jdr2_npp_r1.txt)
| Site; Treatmt; Year; Month; Day; parameter; amount; units; Reference/ Comments jdr; Ih_V; 1977; -999.9; -999.9; stand_age; 120; years; Bringmark (1977) ... jdr; Ih_V; 1977; -999.9; -999.9; needles; 393.7; g/m2; Bringmark (1977) jdr; Ih_V; 1977; -999.9; -999.9; shoots; 81.7; g/m2; Bringmark (1977) jdr; Ih_V; 1977; -999.9; -999.9; branches; 810.5; g/m2; Bringmark (1977) jdr; Ih_V; 1977; -999.9; -999.9; trunks; 4824.3; g/m2; Bringmark (1977) ... jdr; Ih_V; 1979; -999.9; -999.9; stand_age; 125; years; Axelsson and Brakenhielm (1980) ... jdr; Ih_V; -999.9; -999.9; -999.9; Totlittfall; 162; g/m2/year; Berg et al. (1995) ... jdr; Ih_V; 1979; -999.9; -999.9; branch_growth; 43.4; g/m2/year; Bringmark (1977) jdr; Ih_V; 1979; -999.9; -999.9; trunk_growth; 106.1; g/m2/year; Bringmark (1977) jdr; Ih_V; 1977; -999.9; -999.9; Totlittfall; 135.2; g/m2/year; Bringmark (1977) ... |
Table 3. Column headings in NPP file
| COLUMN HEADING | Defintion | Units |
|---|---|---|
| Site | Site where data were gathered (code refers to site identification) | Text |
| Treatmt | Sub-plot where data were collected | Text |
| Year | Year in which data were collected | Numeric |
| Month | Month in which data were collected | Numeric |
| Day | Day on which data were collected | Numeric |
| parameter | Parameters measured (see definitions in Table 3) | Text |
| amount | Data values | Numeric |
| units | Unit of measure | Text |
| References / comments | Primary sources of data plus explanatory comments | Text |
Table 4. Parameter definitions in NPP file (jdr1_npp_r1.txt)
| PARAMETER | DEFINITION | UNITS | SOURCE |
|---|---|---|---|
| stand_age | Average age of trees in Plot "Ih II" when measurements were made | years | Table 1, Agren et al. (1980) |
| height | Average tree height in Plot "Ih II" when measurements were made | cm | |
| needles | Leaf biomass for the untreated stand in Plot "Ih II" when measurements were made1 | g/m2 | |
| branches | Leaf biomass for the untreated stand in Plot "Ih II" when measurements were made1 | ||
| trunks | Leaf biomass for the untreated stand in Plot "Ih II" when measurements were made1 | ||
| ANPP | Above-ground net primary production for the untreated stand in Plot "Ih II"2 | g/m2/year | Table 4, Agren et al. (1980) |
| BNPP | Below-ground net primary production of P. sylvestris (fine + coarse roots) in the untreated stand of Plot "Ih II"3 | p. 514, Persson (1978); p. 311, Agren et al. (1980) | |
| TNPP | Total net primary production for the untreated stand in Plot "Ih II" | by addition | |
| stand-age | Age range of canopy and understory trees in Plot "Ih II" when measurements were made4 | years | various sources |
| height | Mean height of trees in Plot "Ih II" when measurements were made | cm | Table 2, Axelsson and Brakenhielm (1980) |
| numdensity | Tree density in Plot "Ih II" when measurements were made | trees/ha | |
| finerootprodn | Annual average fine root and necromass (< 2 mm dia.) production of P. sylvestris in Plot "Ih II" when measurements were made5 | g/m2/year | p. 514, Persson (1978) |
| largerootprodn | Minimum annual coarse root (2 - < 10 mm dia.) production of P. sylvestris in Plot "Ih II" when measurements were made5 | ||
| litter | Litter biomass (attached dead plant debris not included) | g/m2 | Table 5, Persson (1980b) |
| finerootprodn | Annual turnover of fine (dead and living) roots of P. sylvestris in the F/H layer plus fine roots in the mineral soil in the control stand of Plot "Ih II" based on pooled seasonal averages | g/m2/year | p. 82, Persson (1980b) |
| Undstry_rootprodn | Annual turnover of fine (dead and living) roots of dominant understory species (Calluna vulgaris and Vaccinium vitis-idaea) in the F/H layer plus fine roots in the mineral soil in the control stand of Plot "Ih II" based on pooled seasonal averages | ||
| pineroots | Total root biomass (< 10 mm) of P. sylvestris in control Plot "Ih II" in the 0-30 cm soil layers6 | g/m2 | Table 2, Persson (1980b) |
| otherroots | Total root biomass (< 10 mm) of other plants (Betula spp. + Empetrum nigrum + Calluna vulgaris + Vaccinium vitis-idaea + V. myrtillus + Deschampsia fluxuosa) in control Plot "Ih II" in the 0-30 cm soil layers6 | ||
| pinedeadroots | Total root necromass (< 10 mm) of P. sylvestris in control Plot "Ih II" in the 0-30 cm soil layers6 | ||
| otherdeadroots | Total root necromass (< 10 mm) of other plants (Betula spp. + Empetrum nigrum + Calluna vulgaris + Vaccinium vitis-idaea + V. myrtillus + Deschampsia fluxuosa) in control Plot "Ih II" in the 0-30 cm soil layers6 | ||
| stand_age | Age of control stand (Plot "Ih II") during 1979 sampling period | years | Linder and Axelsson (1982) |
| LAI | Average leaf area index for April-May 1979 sampling period for control site in Plot "Ih II" | m2/m2 | |
| LAI | Average leaf area index for July-August 1979 sampling period for control site in Plot "Ih II" | ||
| needles | Biomass of current + older needles in control site of Plot "Ih II" | g/m2 | |
| branches | Biomass of branches in control site of Plot "Ih II" | ||
| trunks | Biomass of stems in control site of Plot "Ih II" | ||
| stumps | Biomass of stumps in control site of Plot "Ih II" | ||
| AGbiomass | Total above-ground biomass in control site of Plot "Ih II" (sum of above) | by addition | |
| coarseroots | Biomass of coarse roots (> 1 mm in diameter) in control site of Plot "Ih II" | Linder and Axelsson (1982) | |
| needle_growth | Annual needle growth (current needles growth + shoot axis growth) in control site of Plot "Ih II" | g/m2/year | Table 4, Linder and Axelsson (1982) |
| branch_growth | Annual branch growth in control site of Plot "Ih II" | ||
| trunk_growth | Annual stem growth in control site of Plot "Ih II" | ||
| stump_growth | Annual stump growth in control site of Plot "Ih II" | ||
| ANPP | Total annual above-ground net primary production in control site of Plot "Ih II" (sum of above) | by addition | |
| finerootprodn | Estimated annual fine root production in control site of Plot "Ih II" based on the amount of carbon needed to balance the carbon budget for the stand | Table 4, Linder and Axelsson (1982) | |
| largerootprodn | Annual coarse root production in control site of Plot "Ih II" | ||
| BNPP | Total annual below-ground net primary production in control site of Plot "Ih II" (sum of above) | by addition | |
| TNPP | Total net primary production in control site of Plot "Ih II" (ANPP + BNPP) | ||
| N_fixation | Mean annual N2-fixation in Plot "Ih II" | gN/m2/year | p. 339, Granhall and Lindberg (1980) |
| soilpH (0-10cm) | Soil pH, 0-10 cm depth in Plot "Ih II" | dimensionless | Table 2, Axelsson and Brakenhielm (1980) |
| soilpH (10-20cm) | Soil pH, 10-20 cm depth in Plot "Ih II" |
Notes:
1Calculations of above-ground biomass estimates for stand components were made by replacing needle, branch, and trunk biomass for an average tree (in gC dw) with values in g/m2 for each stand component (assuming 50% carbon content).
2 Calculations of above-ground NPP estimates for the untreated stand were made by
summing average tree growth of needles, branches, and trunks (in gC/yr), then converting this estimate to gC/ha/yr for the stand, and then converting the
result to g/m2/yr (again, assuming 50% carbon content).
3Calculations of below-ground NPP estimates for the untreated stand were made by adding cumulative annual total in the
fine-root necromass to a minimum estimate of the production of coarse roots and stumps for P. sylvestris in the stand.
See p. 514, Persson (1978) for details.
4In 1979, Plot "Ih II" had a 20-year-old tree population with an understory of younger pine, thus the age range.
5The value for fine root production is the average from two strata in each 10 x 10 m plot (i.e., P. sylvestris growing above clusters of heather, Calluna vulgar, and P. sylvestris growing in non-Calluna mosaics of reindeer lichens, cup lichens, etc.). 6Estimates are pooled averages from 13 samples taken during 1974-1975.
Table 5. Parameter definitions in NPP file (jdr2_npp_r1.txt)
| PARAMETER | DEFINITION | UNITS | SOURCE |
|---|---|---|---|
| stand_age | Average age of trees in Plot "Ih V" when measurements were made (1977) | years | Bringmark (1977) |
| stand_age | Average age of trees in Plot "Ih V" when measurements were made (1979) | years | Table 2, Axelsson and Brakenhielm (1980) |
| height | Average tree height in Plot "Ih V" when measurements were made (1973) | cm | |
| numdensity | Tree density in Plot "Ih V" when measurements were made (1973) | trees/ha | |
| basal_area | Basal area of tree stand in Plot "Ih V" when measurements were made (1973) | m2/ha | Bringmark (1977) |
| basal_area | Basal area of tree stand in Plot "Ih V" when measurements were made (1974); from a randomized sample of trees, used for branch sampling in an insect laval abundance study | Table 1, Larsson and Tenow (1980) | |
| needles | Total needle biomass of P. sylvestris in Plot "Ih V" based on samples taken in June and October of 1974 | g/m2 | Table 3, Larsson and Tenow (1980) |
| needles_S.E. | Standard error for total needle biomass in Plot "Ih V" based on samples taken in June and October of 1974 | ||
| needles | Needle biomass of current needles plus older needles of P. sylvestris in Plot "Ih V" in 1977 | g/m2 | Table 1, Bringmark (1977) |
| shoots | Shoot biomass of current shoots plus older shoots of P. sylvestris in Plot "Ih V" in 1977 | ||
| branches | Branch biomass of P. sylvestris in Plot "Ih V" in 1977 | ||
| trunks | Trunk + bark biomass of P. sylvestris in Plot "Ih V" in 1977 | ||
| AGbiomass | Total above-ground biomass of P. sylvestris in Plot "Ih V" in 1977 | by addition | |
| stumps+bigroots | Biomass of stumps + large roots of P. sylvestris in Plot "Ih V" in 1977 | g/m2 | Table 1, Bringmark (1977) |
| coarse+fine roots | Biomass of coarse + fine roots of P. sylvestris in Plot "Ih V" in 1977 | ||
| Undstry_AGbiomass | Above-ground biomass of heather + cowberry in Plot "Ih V" in 1977 | ||
| Undstry_BGbiomas | Below-ground biomass of heather roots + cowberry rhizomes in Plot "Ih V" in 1977 | ||
| mosses+lichens | Biomass of mosses + lichens in Plot "Ih V" in 1977 | ||
| Stdead | Biomass of standing dead tree branches, heather, and cowberry in Plot "Ih V" in 1977 | ||
| litter | Total surface litter in Plot "Ih V" in 1977 | ||
| deadroots | Total root litter in Plot "Ih V" in 1977 | ||
| stand_age | Estimated age of Scots pine in Plot "Ih V" in 1973 | years | p. 110, Berg et al. (1995) |
| needles | Needle biomass of Scots pine in Plot "Ih V" in 1979-80 | g/m2 | Figure 1, Berg et al. (1995) based on data from Andersson et al. (1980) |
| cones | Cone biomass of Scots pine in Plot "Ih V" in 1979-80 | ||
| shoots+branches | Shoot and branch biomass of Scots pine in Plot "Ih V" in 1979-80 | ||
| trunks | Stemwood and stembark biomass of Scots pine in Plot "Ih V" in 1979-80 | ||
| AGbiomass | Total above-ground biomass of Scots pine in Plot "Ih V" in 1979-80 | ||
| stumps+Totroots | Stump and root biomass of Scots pine in Plot "Ih V" in 1979-80 | ||
| Undstry_AGbiomass | Above-ground biomass of ground vegetation in Plot "Ih V" in 1979-80 | ||
| Undstry_BGbiomass | Below-ground biomass of ground vegetation in Plot "Ih V" in 1979-80 | ||
| litter | Surface litter biomass in Plot "Ih V" in 1979-80 | ||
| humus | Humus biomass in Plot "Ih V" in 1979-80 | ||
| Totlittfall | Average total litterfall from Scots pine canopy (needles + twigs + cones + attached dead) during a 10-year study (1973-1983) | g/m2/year | p. 111, Berg et al. (1995) |
| branch_growth | Annual growth increment of branches and shoots in Plot "Ih V" in 1977 | g/m2/year | Table 2, Bringmark (1977) |
| trunk_growth | Annual growth increment of stemwood in Plot "Ih V" in 1977 | ||
| Totlittfall | Total annual litterfall (needles + cones + twigs + other matter) in Plot "Ih V" in 1977 | ||
| branch_growth_N | Nitrogen increment in branches and shoots in Plot "Ih V" in 1977 | g/m2/year | Table 2, Bringmark (1977) |
| trunk_growth_N | Nitrogen increment in stemwood in Plot "Ih V" in 1977 | ||
| Totlittfall_N | Nitrogen increment in litterfall (needles + cones + twigs + other matter) in Plot "Ih V" in 1977 | ||
| branch_growth_P | Phosphorus increment in branches and shoots in Plot "Ih V" in 1977 | g/m2/year | Table 2, Bringmark (1977) |
| trunk_growth_P | Phosphorus increment in stemwood in Plot "Ih V" in 1977 | ||
| Totlittfall_P | Phosphorus increment in total litterfall (needles + cones + twigs + other matter) in Plot "Ih V" in 1977 | ||
| needles-N | Nitrogen concentration in Scots pine current and older needles in Plot "Ih V" in 1977 | g/m2 | Table 1, Bringmark (1977) |
| shoots-N | Nitrogen concentrations in Scots pine current and older shoots in Plot "Ih V" in 1977 | ||
| branches-N | Nitrogen concentrations in Scots pine branches in Plot "Ih V" in 1977in 1977 | ||
| trunks-N | Nitrogen concentrations in Scots pine stemwood and stembark in Plot "Ih V" in 1977 | ||
| AGbiomass-N | Nitrogen concentrations in above-ground Scots pine biomass in Plot "Ih V" in 1977 | ||
| stumps+bigroots-N | Nitrogen concentrations in Scots pine stumps and big roots in Plot "Ih V" in 1977 | ||
| coarse+fine_roots-N | Nitrogen concentrations in Scots pine fine (< 10 mm) and coarse roots (10-50 mm) in Plot "Ih V" in 1977 | ||
| Undstry_AGbiomass-N | Nitrogen concentrations in heather and cowberry above-ground biomass (capsules, current shoots, C + 1 shoots C + 2 shoots, and older stems) in Plot "Ih V" in 1977 | ||
| Undstry_BGbiomass-N | Nitrogen concentrations in heather and cowberry below-ground biomass (fine roots < 2 mm, large roots > 2 mm, and rhizomes) in Plot "Ih V" in 1977 | ||
| mosses+lichen-N | Nitrogen concentrations in mosses and lichens in Plot "Ih V" in 1977 | ||
| Stdead-N | Nitrogen concentrations in standing dead (Scots pine, heather, and cowberry) in Plot "Ih V" in 1977 | ||
| litter-N | Nitrogen concentrations in total surface litter in Plot "Ih V" in 1977 | ||
| deadroots-N | Nitrogen concentrations in total root litter in Plot "Ih V" in 1977 | ||
| needles-P | Phosphorus concentration in Scots pine current and older needles in Plot "Ih V" in 1977 | g/m2 | Table 1, Bringmark (1977) |
| shoots-P | Phosphorus concentrations in Scots pine current and older shoots in Plot "Ih V" in 1977 | ||
| branches-P | Phosphorus concentrations in Scots pine branches in Plot "Ih V" in 1977in 1977 | ||
| trunks-P | Phosphorus concentrations in Scots pine stemwood and stembark in Plot "Ih V" in 1977 | ||
| AGbiomass-P | Phosphorus concentrations in above-ground Scots pine biomass in Plot "Ih V" in 1977 | ||
| stumps+bigroots-P | Phosphorus concentrations in Scots pine stumps and big roots in Plot "Ih V" in 1977 | ||
| coarse+fine_roots-P | Phosphorus concentrations in Scots pine fine (< 10 mm) and coarse roots (10-50 mm) in Plot "Ih V" in 1977 | ||
| Undstry_AGbiomass-P | Phosphorus concentrations in heather and cowberry above-ground biomass (capsules, current shoots, C + 1 shoots C + 2 shoots, and older stems) in Plot "Ih V" in 1977 | ||
| Undstry_BGbiomass-P | Phosphorus concentrations in heather and cowberry below-ground biomass (fine roots < 2 mm, large roots > 2 mm, and rhizomes) in Plot "Ih V" in 1977 | ||
| mosses+lichen-P | Phosphorus concentrations in mosses and lichens in Plot "Ih V" in 1977 | ||
| Stdead-P | Phosphorus concentrations in standing dead (Scots pine, heather, and cowberry) in Plot "Ih V" in 1977 | ||
| litter-P | Phosphorus concentrations in total surface litter in Plot "Ih V" in 1977 | ||
| deadroots-P | Phosphorus concentrations in total root litter in Plot "Ih V" in 1977 | ||
| needles-C | Concentration of carbon in live needles, green litter | percent | Table 2, Larsson and Tenow (1980) |
| needles-N | Concentration of nitrogen in live needles, green litter | ||
| needles-P | Concentration of phosphorus in live needles, green litter | ||
| grazing_loss | Grazing loss in Plot "Ih V" defined as the removal of leaf material from the foliage by leaf-eating insect larvae over the full feeding period in 1974 | g/m2/year | p. 292, Larsson and Tenow (1980) |
| fineroots | Fine root biomass (< 2 mm in diameter) of P. sylvestris (0-30 cm depth) in Plot "Ih V" in 1974-19751 | g/m2 | Table 1, Persson (1980a) in Persson, T. (ed.). (1980) |
| Totroots | Total root biomass (< 10 mm in diameter) of P. sylvestris (0-30 cm depth) in Plot "Ih V" from in 1974-19751 | ||
| deadroots | Dead root biomass (< 2 mm in diameter) of P. sylvestris (0-30 cm depth) in Plot "Ih V" in 1974-19751 | ||
| Undstry_fineroots | Fine root biomass (< 2 mm in diameter) of understory vegetation (Empetrum nigrum + Calluna vulgaris + Vaccinium vitis-idaea) (0-30 cm depth) in Plot "Ih V" in 1974-19751 | ||
| Undstry_Totroots | Total root biomass (< 10 mm in diameter) of understory vegetation (Empetrum nigrum + Calluna vulgaris + Vaccinium vitis-idaea) (0-30 cm depth) in Plot "Ih V" from in 1974-19751 | ||
| Undstry_deadroots | Dead root biomass (< 2 mm in diameter) of understory vegetation (Empetrum nigrum + Calluna vulgaris + Vaccinium vitis-idaea) (0-30 cm depth) in Plot "Ih V" in 1974-19751 | ||
| finerootprodn | Annual turnover of fine roots of P. sylvestris from whole core (0-30 cm depth) | g/m2/year | p. 255, Persson (1980a) in Persson, T. (ed.). (1980) |
| Undstry_rootprodn | Annual turnover of fine roots of Calluna vulgaris from whole core (0-30 cm depth) | ||
| needlitt_decomp | Weight losses of needle litter in litter bags sampled six times over a 1,099 day period in Plot "Ih V" | percent | Table 1, Berg and Staaf (1980) |
| needlitt_lignin | Needle (Klason) lignin composition in needle litter after incubation periods (initial composition to 1,009 days) in Plot "Ih V" | percent of actual weight | Table 2, Berg and Staaf (1980) |
| needlitt_N | Total nitrogen composition in needle litter after incubation periods (initial composition to 1,009 days) in Plot "Ih V" | ||
| N_fixation | Mean annual N2-fixation in Plot "Ih II" | gN/m2/year | p. 339, Granhall and Lindberg (1980) |
| soilpH (0-10cm) | Soil pH, 0-10 cm depth in Plot "Ih II" | dimensionless | Table 2, Axelsson and Brakenhielm (1980) |
| soilpH (10-20cm) | Soil pH, 10-20 cm depth in Plot "Ih II" | ||
| soil_C (0-10cm) | Carbon content in iron podsol in Plot "Ih V" at 0-10 cm depth | percent of dry weight | Table 1, Bringmark (1980) |
| soil_C (10-20cm) | Carbon content in iron podsol in Plot "Ih V" at 10-20 cm depth | ||
| soil_C (20-30cm) | Carbon content in iron podsol in Plot "Ih V" at 20-30 cm depth | ||
| soil_C (0-30cm) | Organic material in mineral soil (0-30 cm depth) | g/m2 | Figure 1, Berg et al. (1995) |
| soil_N (0-10cm) | Nitrogen content in iron podsol in Plot "Ih V" at 0-10 cm depth | percent of dry weight | Table 1, Bringmark (1980) |
| soil_N (10-20cm) | Nitrogen content in iron podsol in Plot "Ih V" at 10-20 cm depth | ||
| soil_N (20-30cm) | Nitrogen content in iron podsol in Plot "Ih V" at 20-30 cm depth | ||
| soil_B.D. (0-10cm) | Bulk density of iron podsol in Plot "Ih V" at 0-10 cm depth | percent | Table 1, Bringmark (1980) |
| soil_B.D. (10-20cm) | Bulk density of iron podsol in Plot "Ih V" at 10-20 cm depth | ||
| soil_B.D. (20-30cm) | Bulk density of iron podsol in Plot "Ih V" at 20-30 cm depth |
Notes: 1Estimates are pooled averages from 8 samples taken during 1974-1975.
Climate Data. The climate data for the Jadraas site are provided in one file (.txt format) (Table 2). The first 18 lines are metadata; data records begin on line 19. The variable values are delimited by semicolons. There are no missing values.
Sample Climate Data Record
| Site;Temp;Parm; Jan; Feb; Mar; Apr; May; Jun; Jul; Aug; Sep; Oct; Nov; Dec; Year JDR;mean;prec; 58.4; 31.9; 38.5; 45.4; 42.0; 71.3; 72.8; 80.5; 93.3; 71.4; 72.7; 52.6; 730.8 JDR;mean;tmax; -3.5; -2.5; 1.6; 6.4; 14.8; 18.0; 20.3; 18.8; 12.3; 7.0; 1.3; -3.0; 7.6 JDR;mean;tmin; -9.7; -9.1; -7.2; -3.2; 2.0; 7.5; 9.1; 7.3; 4.7; 1.1; -3.1; -7.4; -0.7 JDR;numb;prec; 17.0; 17.0; 17.0; 17.0; 17.0; 17.0; 17.0; 17.0; 17.0; 17.0; 17.0; 17.0; 12.0 JDR;numb;tmax; 17.0; 17.0; 17.0; 17.0; 17.0; 17.0; 17.0; 17.0; 17.0; 17.0; 17.0; 17.0; 12.0 JDR;numb;tmin; 17.0; 17.0; 17.0; 17.0; 17.0; 17.0; 17.0; 17.0; 17.0; 17.0; 17.0; 17.0; 12.0 JDR;stdv;prec; 24.4; 27.8; 14.4; 30.8; 19.0; 41.9; 39.6; 44.1; 62.2; 55.0; 28.4; 26.7; 34.5 JDR;stdv;tmax; 4.4; 4.0; 2.6; 1.3; 1.1; 1.4; 1.6; 1.4; 1.7; 1.3; 2.0; 3.0; 2.1 JDR;stdv;tmin; 4.1; 4.1; 2.5; 1.5; 1.4; 1.4; 1.4; 1.4; 1.7; 1.3; 1.8; 3.0; 2.1 JDR;1974;prec; 52.9; 8.0; 19.2; 31.6; 42.0; 49.5;118.2; 28.4; 89.2;234.7;104.5; 51.6; 829.8 JDR;1974;tmax; 0.8; 1.5; 3.4; 6.8; 15.6; 17.8; 22.6; 21.5; 15.5; 7.9; 3.5; 0.9; 22.6 JDR;1974;tmin; -6.1; -5.4; -4.9; -3.2; 0.1; 6.8; 6.8; 8.6; 5.2; 0.1; -2.1; -4.9; -6.1 JDR;1975;prec; 52.9; 8.0; 19.2; 31.6; 59.4; 28.6; 19.5; 54.6; 78.9; 23.3; 26.9; 28.7; 431.6 JDR;1975;tmax; 0.8; 1.5; 3.4; 6.8; 15.6; 17.8; 22.6; 21.5; 15.1; 7.9; 3.5; 0.9; 22.6 JDR;1975;tmin; -6.1; -5.4; -4.9; -3.2; 1.9; 7.2; 11.5; 9.5; 7.4; 1.6; -1.2; -3.6; -6.1 … Where, Temp (temporal) - specific year or long-term statistic: mean = mean based on all years numb = number of years stdv = standard deviation based on all years Parm (parameter): prec = precipitation for month or year (mm) tmax = mean maximum temperature for month or year (C) tmin = mean minimum temperature for month or year (C) |
3. Data Application and Derivation:
The accumulation of biomass, or NPP, is the net gain of carbon by photosynthesis that remains after plant respiration. While there are many fates for this carbon, this data set accounts for above- and below-ground production in the young forest and branch and trunk growth, litterfall, needle grazing loss, and root production in the old-growth forest. These are considered the major components of NPP.
The central aim of the long-term ecosystem studies conducted within the Swedish Coniferous Forest Project was to enhance understanding of plant biomass dynamics and factors regulating plant growth. Most of the research concerned plant and vegetation processes, but particular interest was also given to soil processes, consumption processes, and energy and water exchange in the canopy and the soil.
The biomass dynamics data for the Jadraas sites are provided for comparison with models and estimation of NPP. Climate data are provided for use in driving ecosystem/NPP models.
4. Quality Assessment:
Measurements were made using methods adopted by the International Biological Program (IBP). The data provided are of generally good quality based on the site locations and time frame. Data were examined for general consistency and clarity.
Sources of Error
See individual studies.
5. Data Acquisition Materials and Methods:
Tree and Stand Structure in the Young Scots Pine Stand (14 years) (Flower-Ellis et al., 1976 as in Agren et al., 1980). In the late winter of 1972/73, the stand was subjected to a cleaning-thinning. Eighteen sample trees were collected for measurements of basal diameter, tree height, component numbers and lengths, and annual increments. In 1974, a 10 x 10 m grid of small quadrats already laid out was extended to cover the whole stand and 25 were chosen at random for inventory of tree height, DBH, girth, length of leading, previous year's and three-year-old shoots, number of live and dead whorls, number of live branches, and height to lowest live branch. All trees 100 cm and more in height on the sample plots were measured. The total number of trees measured was 319. Limited destructive sampling was conducted to estimate dry weight distribution.
Biomass Distribution in the Young Scots Pine Stand (20 years) Linder and Axelsson (1982). Distribution of biomass was determined by methods adopted by IBP. In the autumn of 1979 the heights and diameters at breast height of all trees on the control plot were measured. The tree population on the plot was thereafter divided into three classes, each representing a third of the total basal area and one tree per class was taken for detailed biomass studies. The coarse root systems of the harvested trees were excavated in May of the following year. The trees were analyzed whorl by whorl and the dry weight of needles and branches was determined and separated into age-classes. The growth of stems, branches, and coarse roots was determined from measurements of ring width and density. By assuming that the plot consisted of representative trees, the amounts of biomass per hectare were estimated by multiplying the tree structures by the number of trees per hectare.
Root Production in the Young Scots Pine Stand (15-20 years) (Persson, 1980b). The spatial distribution of fine-root production of P. sylvestris and other species (Betula spp., Empetrum nigrum, Calluna vulgaris, Vaccinium vitis-idaea, V. myrtillus, and Deschampsia fluxuosa) was investigated by core sampling during an entire growth period, 1974-1975. The samples were removed with a long steel corer with an internal diameter at the hardened steel cutting edge of 6.7 cm (area 35.26 cm2). Random samples of 16 cores were made in both strata giving a total number of 416 cores. Sampling took place at intervals of 2-3 weeks during the growing season. Cores were sliced into three 10 cm sections, starting at the soil surface - from the L horizon, the uppermost being divided into F/H and mineral soil horizons. Living and dead root fragments (biomass and necromass, respectively) were sorted into different species and diameter fractions. Dead root fragments < 1 mm in diameter were ascribed to necromass in cases where they were longer than 2 cm; otherwise they were included in the soil organic matter. Dead root fragments > 1 mm in diameter were ascribed to necromass in cases where they were longer than 1 cm. The majority of necromass was longer than 2 cm and 1 cm, respectively. Litter biomass in the L horizon was also estimated, but sampling methods are not described in Persson (1980b).
Annual Carbon Budget for the Young Scots Pine Stand (15-20 years) (Agren et al., 1980; Persson, 1978). The annual carbon budget for a "mean" tree was estimated by incorporating independent estimates of all the major carbon inflows and outflows (i.e., net photosynthesis, respiration, growth, and mortality). To obtain a complete budget it was necessary to combine data from different years (1974-1976) measured at the control Plot "Ih II" at the Jadraas study site. The carbon budget for the stand was obtained by replacing gC/year with kgC/ha/year. This value was then converted to g/m2/year by assuming 50% carbon content.
N Fixation in the Young Scots Pine Stand (15-20 years) (Granhall and Lindberg, 1978, 1980). Randomized sampling sites (1 x 1 m plots) within 5-20 randomly placed 10 x 10 m quadrats were used for consecutive sampling. See Granhall and Lindberg (1978) for description of sampling procedures.
Needle Biomass, Grazing Loss, and Bioelement Concentrations in Live Needles from the 120-year-old Scots Pine Stand (Larsson and Tenow, 1980). The biomass of different needle age-classes was estimated by sampling vertical columns of foliage from the forest canopy using a skylift. Grazed needles were searched and partly eaten needles picked off and pooled in a pile (a). Their intact twin needles or nearest intact needle pair (in cases where both needles in a pair were eaten) were pooled in another pile (b) and remaining intact needles in a third (c). After counting the needle pairs in each pile, the piles were dried at +85 C for 48 hours and weighed to the nearest 0.001 g. The difference, b - a, approximated the grazed amount of needle biomass, and the sum, a + b + c + (b - a), equaled the total needle biomass. Concentrations of bioelements in the live needle samples were determined by standard laboratory methods. Larsson and Tenow (1980) provide a detailed description of sampling and analysis procedures.
Biomass Distribution in the 120-year-old Scots Pine Stand (Bringmark, 1977). Biolement fluxes of all the investigated compartments of the ecosystem, as well as increments of branches and stemwood, are derived from dry weights and concentrations. Dry weights were provided by J. Flower-Ellis (pers. comm.) and H. Persson (pers. comm.). Information on measurement procedures not available.
Biomass Distribution in the 120-year-old Scots Pine Stand Berg et al. (1995) based on data from Andersson et al. (1980). Information on measurement procedures not available.
Root Biomass and Production in the 120-year-old Scots Pine Stand (Persson, 1980a). Samples (area 36.26 cm2) were removed by coring. Random samples of 30 cores were made on each sampling occasion giving a total number of 240 cores (with 210 of these cores being sorted). The cores were sliced into 10 cm sections starting at the litter (L) horizon, the uppermost section being divided into F/H and mineral soil horizons. The root fragments were then classified into different diameter fractions as described above for the young Scots pine stand (15-20 years). Fine root production was calculated according to the methods described in Persson (1978, 1980b).
Litter Decomposition in the 120-year-old Scots Pine Stand (Berg and Staaf, 1980). About 2 g of needle litter was enclosed in 8 x 8 cm litter bags made terylene net with a mesh size of 1 mm. Litter bags were placed on the litter (L) layer in a measurement plot (1 x 1 m) in each of 20 blocks in a randomized block design. The experiment commenced on October 23, 1974, and ran for three years (1,009 days) to October 27, 1977. One sample was collected from each of the 20 plots on six occasions. The contents of the litter bags were cleaned of moss, lichen and dwarf shrub remnants, dried at 85 degrees C, weighed individually, and then pooled. Chemical composition of needle litter after different incubation periods (initial composition, after 370 days, after 554 days, and after 1,099 days) was analyzed using standard laboratory methods.
Chemical Properties of Soils in the 120-year-old Scots Pine Stand Bringmark (1980, 1995). Information on measurement procedures not available.
Climate Data. Climate was monitored at the Jadraas forest site. Measurements included precipitation and maximum/minimum temperature. Monthly and annual means are reported in the climate file from 1974 through 1990.
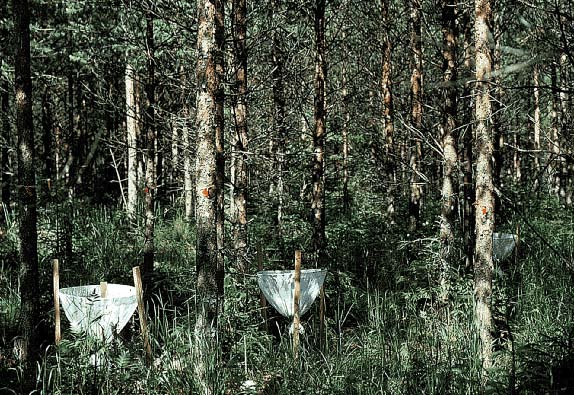
Figure 7. Needle litter traps in the irrigated and fertilized (IF) treatment at the Jadraas study site, Sweden. (After 7 years of treatment, tree girth and height have both increased significantly compared with control plots, and the understory is considerably more dense. Photograph taken July 1982 by Dr. S. Linder, Swedish University of Agricultural Sciences, Uppsala).
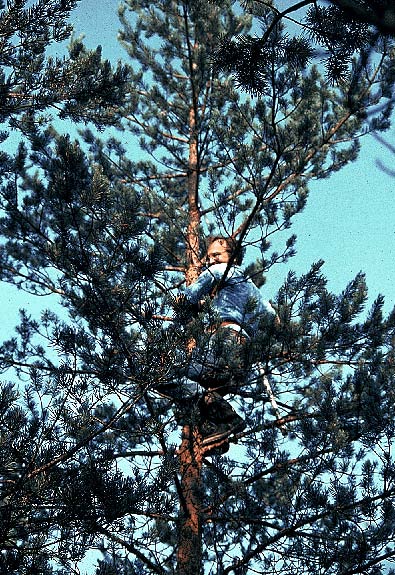
Figure 8. Sampling for current-year shoots at the Jadraas study site, Sweden. (Dr. S. Kellomäki is climbing a pine tree, now 30 years old, in the irrigated and fertilized plot. Photograph taken July 1990 by Dr. S. Linder, Swedish University of Agricultural Sciences, Uppsala).
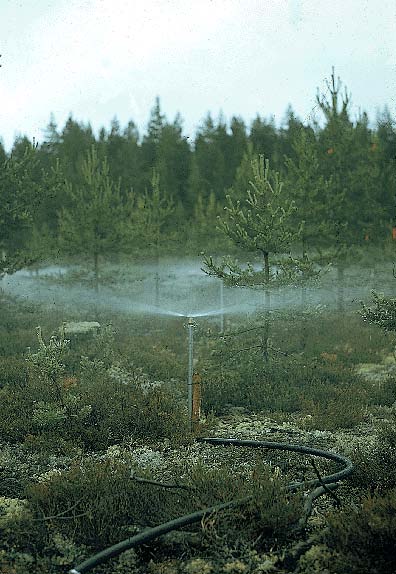
Figure 9. Sprinkler system on one of the irrigated and fertilized (IF) plots at the beginning of the SWECON study at the Jadraas study site, Sweden. (A dilute solution of complete fertilizer was applied daily at 0500 during the growing season. The understory is dominated by heather [Calluna vulgaris] and reindeer lichen [Cladonia sp.]. Photograph taken June 1974 by Dr. S. Linder, Swedish University of Agricultural Sciences, Uppsala).
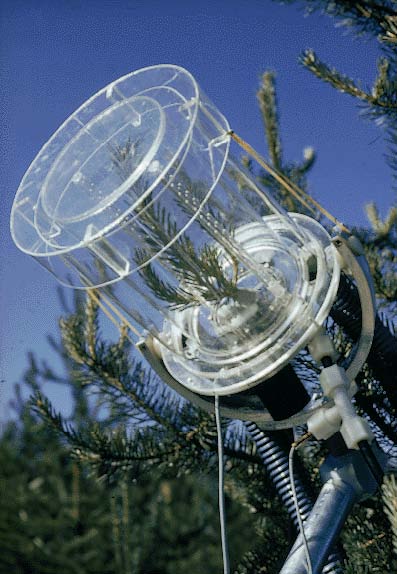
Figure 10. Temperature-controlled shoot cuvette for continuous measurement of gas exchange in young Pinus sylvestris at the Jadraas study site, Sweden. (Cooling air passes between the double walls of the chamber, and air from the center of the cuvette is circulated to an infra-red gas analyzer for analysis of CO2 assimilation and respiration. Photograph taken summer 1975 by Dr. S. Linder, Swedish University of Agricultural Sciences, Uppsala).
6. Data Access:
This data is available through the Oak Ridge National Laboratory (ORNL) Distributed Active Archive Center (DAAC).
Data Archive Center:
Contact for Data Center Access Information:
E-mail: uso@daac.ornl.gov
Telephone: +1 (865) 241-3952
7. References:
Ågren, G.I., B. Axelsson, J.G.K. Flower-Ellis, S. Linder, H. Persson, H. Staaf, and E. Troeng. 1980. Annual carbon budget for a young Scots pine, pp. 307-313. In: Persson, T. (ed.). Structure and Function of Northern Coniferous Forests: An Ecosystem Study. Ecological Bulletins (Stockholm), No. 32. 609 pp.
Andersson, F., Axelsson, B., Lohm, D., Perttu, K. & Agren G. 1980. Skogen som miljo. Naturvetenskapliga Forskningsradets arsbok 1979-1980. Forska for livet. Naturvetenskapliga forskningsriidet. Stockholm, pp. 142-179. (In Swedish).
Axelsson, B., and S. Brakenhielm. 1980. SWECON investigation sites - biological and physiographical features, pp. 25-64. In: Persson, T. (ed.). Structure and Function of Northern Coniferous Forests: An Ecosystem Study. Ecological Bulletins (Stockholm), No. 32. 609 pp.
Berg, B., and H. Staaf. 1980. Decomposition rate and chemical changes of Scots pine needle litter. II. Influence of chemical composition, pp. 373-390. In: Persson, T. (ed.). Structure and Function of Northern Coniferous Forests: An Ecosystem Study. Ecological Bulletins (Stockholm), No. 32. 609 pp.
Berg, B., C. McClaugherty, A.V. de Santo, M.-B. Johansson, and G. Ekbohm. 1995. Decomposition of litter and soil organic matter - can we distinguish a mechanism for soil organic matter buildup? Scandinavian J. Forest Research 10, 108-119.
Bringmark, L. 1977. A bioelement budget of an old Scots pine forest in central Sweden. Silva Fennica 11: 201-209.
Bringmark, L. 1980. Ion leaching through a podsol in a Scots pine stand, pp 341-361. In: Persson, T. (ed.). Structure and Function of Northern Coniferous Forests: An Ecosystem Study. Ecological Bulletins (Stockholm), No. 32. 609 pp.
Flower-Ellis, J.G.K., and H. Persson. 1980. Investigation of structural properties and dynamics of Scots pine stands, pp. 125-138. In: Persson, T. (ed.). Structure and Function of Northern Coniferous Forests: An Ecosystem Study. Ecological Bulletins (Stockholm), No. 32. 609 pp.
Flower-Ellis, J.G.K., A. Albrektson, and L. Olsson. 1976. Structure and growth of some young Scots pine stands. (1) Dimensional and numerical relationships. Swedish Coniferous Forest Project Technical Report 3, 98 pp.
Granhall, U., and T. Lindberg. 1980. Nitrogen input through biological nitrogen fixation, pp. 333-340. In: Persson, T. (ed.). Structure and Function of Northern Coniferous Forests: An Ecosystem Study. Ecological Bulletins (Stockholm), No. 32. 609 pp.
Larsson, S., and O. Tenow. 1980. Needle-eating insects and grazing dynamics in a mature Scots pine forest in Central Sweden, pp. 269-306. In: Persson, T. (ed.). Structure and Function of Northern Coniferous Forests: An Ecosystem Study. Ecological Bulletins (Stockholm), No. 32. 609 pp.
Linder, S., and B. Axelsson. 1982. Changes in carbon uptake and allocation patterns as a result of irrigation and fertilization in a young Pinus sylvestris stand, pp. 38-44. In: Waring, R.H. (ed.). Carbon Uptake and Allocation in Subalpine Ecosystems as a Key to Management. Forest Research Laboratory, Oregon State University, Corvallis.
Olson, R.J., K.R. Johnson, D.L. Zheng, and J.M.O. Scurlock. 2001. Global and Regional Ecosystem Modeling: Databases of Model Drivers and Validation Measurements. ORNL Technical Memorandum TM-2001/196. Oak Ridge National Laboratory, Oak Ridge, Tennessee, USA
Persson, H. 1978. Root dynamics in a young Scots pine stand in central Sweden. Oikos 30: 508-519.
Persson, H. 1980a. Death and replacement of fine roots in a mature Scots pine stand, pp. 251-260. In: Persson, T. (ed.). Structure and Function of Northern Coniferous Forests: An Ecosystem Study. Ecological Bulletins (Stockholm), No. 32. 609 pp.
Persson, H. 1980b. Spatial distribution of fine-root growth, mortality and decomposition in a young Scots pine stand in Central Sweden. OIKOS 34: 77-87. Copenhagen.
Additional Sources of Information:
Gower, S.T., O. Krankina, R.J. Olson, M. Apps, S. Linder, and C. Wang. 2001. Net Primary Production and Carbon Allocation Patterns of Boreal Forest Ecosystems. Ecological Applications. 11:1395-1411.
Gower, S.T., O. Krankina, R.J. Olson, M. Apps, S. Linder, and C. Wang. 2012. NPP Boreal Forest: Consistent Worldwide Site Estimates, 1965-1995, R[evision]1. Data set. Available on-line [http://daac.ornl.gov] from the Oak Ridge National Laboratory Distributed Active Archive Center, Oak Ridge, Tennessee, USAdoi:10.3334/ORNLDAAC/611
Granhall, U., and T. Lindberg. 1978. Nitrogen fixation in some coniferous forest ecosystems, pp. 178-192. In: U. Granhall (ed.). Environmental Role of Nitrogen-Fixing Blue-Green Algae and Asymbiotic Bacteria. Ecological Bulletins (Stockholm) No. 26.
Olson, R.J., J.M.O. Scurlock, S.D. Prince, D.L. Zheng, and K.R. Johnson (eds.). 2012a. NPP Multi-Biome: Global Primary Production Data Initiative Products, R2. Data set. Available on-line [http://daac.ornl.gov] from the Oak Ridge National Laboratory Distributed Active Archive Center, Oak Ridge, Tennessee, USAdoi:10.3334/ORNLDAAC/617
Olson, R.J., J.M.O. Scurlock, S.D. Prince, D.L. Zheng, and K.R. Johnson (eds.). 2012b. NPP Multi-Biome: NPP and Driver Data for Ecosystem Model-Data Intercomparison, R2. Data set. Available on-line [http://daac.ornl.gov] from the Oak Ridge National Laboratory Distributed Active Archive Center, Oak Ridge, Tennessee, USAdoi:10.3334/ORNLDAAC/615
Scurlock, J.M.O., and R.J. Olson. 2002. Terrestrial net primary productivity - A brief history and a new worldwide database. Environ. Rev. 10(2): 91-109. doi:10.1139/a02-002
Scurlock, J.M.O., and R.J. Olson. 2012. NPP Multi-Biome: Grassland, Boreal Forest, and Tropical Forest Sites, 1939-1996, R1. Data set. Available on-line [http://daac.ornl.gov] from Oak Ridge National Laboratory Distributed Active Archive Center, Oak Ridge, Tennessee, USAdoi:10.3334/ORNLDAAC/653
8. Data Set Revisions:
Revision Summary:
The NPP data file, jdr_npp.txt, has been split into two files, one for the young regenerating Scots pine forest (jdr1_npp_r1.txt) and one for the old-growth Scots pine forest (jdr2_npp_r1.txt). The data files have been revised to correct temporal coverage, to correct some previously reported data and information, and to add new data from published sources.
In the NPP data file, jdr1_npp _r1.txt (young pine), root biomass data have been corrected to agree with values in Table 2 of Persson (1980b). The date when coarse roots were harvested has been corrected to agree with Linder and Axelsson (1982). Needle growth from Linder and Axelsson (1982) has been added.
In the NPP data file, jdr2_npp _r1.txt (old-growth pine), the date when tree height was measured and the date when needles were harvested in the autumn of 1974 have been corrected to agree with Axelsson and Brakenhielm (1980) and Larsson and Tenow (1980), respectively. The dates when stand age was estimated, above-and below-ground biomass was measured, and litterfall was collected were corrected to agree with those dates reported by Berg et al. (1995). The dates when soil bioelements were measured was corrected to agree with Bringmark (1980).
All other values in the data files are consistent with published sources.
Data File Changes:
Below-ground biomass data for Plot "Ih II" (young regenerating stand) in jdr1_npp _r1.txt have been corrected to agree with values in Table 2 of Persson (1980b).
| Parameter Field* | Uncorrected in jdr_npp.txt | Corrected in jdr1_npp_r1.txt |
|---|---|---|
| g/m2 | ||
| pineroots | 75.9 | 49.8 |
| otherroots | 252.9 | 153.1 |
| pinedeadroots | 232.3 | 164.7 |
| otherdeadroots | 152.1 | 94.5 |
The date (year and month) when coarse roots (> 1 mm in diameter) were sampled in Plot "Ih II" (young regenerating stand) in jdr1_npp _r1.txt has been corrected to agree with Linder and Axelson (1982).
| Parameter Field* | Uncorrected in jdr_npp.txt | Corrected in jdr1_npp_r1.txt | ||
|---|---|---|---|---|
| Year | Month | Year | Month | |
| coarseroots | 1979 | 10 | 1980 | 05 |
Needle growth in Plot "Ih II" (young regenerating stand) from Table 4 in Linder and Axelson (1982) has been added to jdr1_npp _r1.txt.
| Parameter Field* | Uncorrected in jdr_npp.txt | Corrected in jdr1_npp_r1.txt |
|---|---|---|
| g/m2/year | ||
| needle_growth | NR | 182 |
Note: NR: Not reported.
The temporal coverage of the data file, jdr2_npp_r1.txt, for Plot "Ih V" (old-growth forest) has been corrected.
| Uncorrected in jdr_npp.txt | Corrected in jdr1_npp_r1.txt |
|---|---|
| 1973-1980 | 1973-1983 |
The date (year) when tree height was measured in Plot "Ih V" (old-growth forest) has been corrected in jdr2_npp_r1.txt to agree with the date in Table 2 of Axelsson and Brakenhielm (1980).
| Parameter Field* | Uncorrected in jdr_npp.txt | Corrected in jdr2_npp_r1.txt |
|---|---|---|
| Year | ||
| height | 1974 | 1973 |
The date (month/day) when needles were harvested for biomass estimates in Plot "Ih V" (old-growth forest) in the autumn of 1974 has been corrected in jdr2_npp_r1.txt to agree with the date in Table 3 of Larsson and Tenow (1980).
| Parameter Field* | Uncorrected in jdr_npp.txt | Corrected in jdr2_npp_r1.txt | ||
|---|---|---|---|---|
| Month | Day | Month | Day | |
| needles | 06 | 11 | 10 | 24 |
| needles_S.E. | 06 | 11 | 10 | 24 |
The dates (year) when stand age was estimated, above-and below-ground biomass was measured, and litterfall was collected in Plot "Ih V" (old-growth forest) have been corrected in jdr2_npp_r1.txt to agree with the dates reported by Berg et al. (1995).
| Parameter Field* | Uncorrected in jdr_npp.txt | Corrected in jdr2_npp_r1.txt |
|---|---|---|
| Year | ||
| stand_age | -999.9 | 1973 |
| needles | 1979-80 | |
| cones | ||
| shoots+branches | ||
| trunks | ||
| AGbiomass | ||
| stumps+Totroots | ||
| Undstry_AGbiomass | ||
| Undstry_BGbiomass | ||
| litter | ||
| humus | ||
| Totlittfall | 1973-83 | |
Note: The total litterfall value is the annual average over the 10-year study (1973-1983).
The date (year) when soil bioelements and bulk density were measured in samples from Plot "Ih V" (old-growth forest) have been corrected in jdr2_npp_r1.txt to agree with the dates reported by Bringmark (1980).
| Parameter Field* | Uncorrected in jdr_npp.txt | Corrected in jdr2_npp_r1.txt |
|---|---|---|
| Year | ||
| soil_C(0-10cm) | 1980 | 1975-76 |
| soil_C(10-20cm) | ||
| soil_C(20-30cm) | ||
| soil_C(0-30cm) | ||
| soil_N(0-10cm) | ||
| soil_N(10-20cm) | ||
| soil_N(20-30cm) | ||
| soil_B.D. (0-10cm) | ||
| soil_B.D. (10-20cm) | ||
| soil_B.D. (20-30cm) | ||
*See data set Guide document for parameter definitions.
The data values in flk1_npp_r1.txt and flk2_npp_r1.txt are now correct.
Data User Action: If you downloaded the referenced data set from the ORNL DAAC on-line archive before July 15, 2013, you should download it again.
Revision History:
Original Citation
Linder, S., and G. I. Agren. 1998. NPP Boreal Forest: Jadraas , Sweden, 1973-1980. Data set. Available on-line [http://daac.ornl.gov] from Oak Ridge National Laboratory Distributed Active Archive Center, Oak Ridge, Tennessee, USA