Get Data
Summary:
Net primary productivity (NPP) estimates were compiled by the Global Primary Production Data Initiative (GPPDI). The database covers 2,523 individual sites and 5,164 half-degree grid cells and underwent extensive review under the Ecosystem Model-Data Intercomparison (EMDI) process. The GPPDI database includes NPP measurements that were collected over a long time period by many investigators using a variety of methods. The measurements are categorized as either Class A, from intensively studied sites; Class B, from “extensive” sites; or reported as Class C, 0.5° latitude-longitude grid cells.
The data set contains six comma-separated files (.csv format). There are two files for each class. One file for each class contains site locations, elevation, NPP estimates, climate data, biome and dominant species information, and references. The other file for each class contains model validation outlier flags derived from site-specific reviews.
This document and a companion file (Olson et al., 2001) describe the compilation of NPP estimates under the GPPDI. The results of the EMDI review and outlier analysis produced a refined set of NPP estimates and model driver data (the EMDI database; Olson et al., 2001; 2013). Another ORNL DAAC data set (Zheng et al., 2013) contributed to the compilation of GPPDI.
Revision Notes: This data set has been revised to correct previously reported ANPP, BNPP, and TNPP estimates for three OTTER Transect sites, USA, in the Class A NPP data file and BNPP, and TNPP estimates for Vindhyan, India, in the Class B NPP data file. Please see the Data Set Revisions section of this document for detailed information.
Additional Documentation
The NPP data collection contains field measurements of biomass, estimated NPP, and climate data for terrestrial grassland, tropical forest, temperate forest, boreal forest, and tundra sites worldwide. Data were compiled from the published literature for intensively studied and well-documented individual field sites and from a number of previously compiled multi-site, multi-biome data sets of georeferenced NPP estimates. The principal compilation effort (Olson et al., 2001) was sponsored by the NASA Terrestrial Ecology Program. For more information, please visit the NPP web site at http://daac.ornl.gov/NPP/npp_home.html.
Data Citation:
Cite this data set as follows:
Olson, R.J., J.M.O. Scurlock, S.D. Prince, D.L. Zheng, and K.R. Johnson (eds.). 2013. NPP Multi-Biome: Global Primary Production Data Initiative Products, R2. Data set. Available on-line [http://daac.ornl.gov] from the Oak Ridge National Laboratory Distributed Active Archive Center, Oak Ridge, Tennessee, USA. doi:10.3334/ORNLDAAC/617
This data set was originally published as:
Olson, R.J., J.M.O. Scurlock, S.D. Prince, D.L. Zheng, and K.R. Johnson (eds.). 2001.
NPP Multi-Biome: Global Primary Production Data Initiative Products. Data set. Available
on-line [http://daac.ornl.gov] from the Oak Ridge National Laboratory Distributed Active
Archive Center, Oak Ridge, Tennessee, U.S.A.
Table of Contents:
- 1 Data Set Overview
- 2 Data Description
- 3 Applications and Derivation
- 4 Quality Assessment
- 5 Acquisition Materials and Methods
- 6 Data Access
- 7 References
- 8 Data Set Revisions
1. Data Set Overview:
Project: Net Primary Productivity (NPP)
The GPPDI was established as an activity of the IGBP Data and Information System, a coordinated international program to improve worldwide estimates of terrestrial NPP for parameterization, calibration, and validation of NPP models at various scales (Olson et al., 2001; Prince et al., 1995). Extensive worldwide NPP data were assembled with model driver data, including vegetation, climate, and soils data, to perform model intercomparisons and assess how well regional model predictions agree with observed data. To assess the accuracy of global model forecasts of terrestrial carbon cycling, two EMDI workshops were held (December 1999 and April 2001). The workshops included 11 biogeochemical, satellite-driven, detailed process, and dynamic vegetation global model types. The approach was to run regional or global versions of the models for sites with NPP measurements (i.e., not fine-tuned for specific site conditions) and analyze the model-data differences.
The NPP data compiled under GPPDI activities resulted in more than 7,500 estimates of NPP globally from ecological sites as well as estimates of NPP for regularly gridded regions using agricultural and forestry statistics that have high spatial density over those regions. The GPPDI results represent a more comprehensive database of measurements than has previously existed. Methods for extrapolating from point measurements to grid cells were reviewed and used to estimate NPP for croplands (Prince et al., 2001) and other biomes (Zheng et al., 2003; 2004). The results of these compilations are included in the multi-biome GPPDI database (this data set) and gridded GPPDI (Zheng et al., 2013). The results of the EMDI data review and outlier analysis were compiled into the EMDI data base (Olson et al., 2013). In addition, 72 site-specific NPP data sets were compiled by the ORNL DAAC with grassland sites constituting over half the collection. Seven multi-biome data sets were also compiled containing NPP estimates for over 1,700 sites.
The GPPDI database includes NPP measurements collected over a long time period by many investigators using a variety of methods. The minimum requirements for data to be included were as follows:
• the use of one or more accepted methods to estimate above- or below-ground NPP;
• geographical location for the study site;
• definition of biome or vegetation type; and
• a citable reference to peer-reviewed publication, symposium, or workshop proceedings; book chapter; or technical memorandum.
The measurements of NPP are categorized as either Class A, intensively studied sites; Class B, “extensive” sites; or Class C, 0.5° latitude-longitude grid cells.
- Class A sites – data for Class A sites represent intensively studied or well-documented study sites (e.g., with site-specific climate, soils information, etc.) and have complete NPP measurements and good documentation. Sites include grassland, tropical forest, temperate forest, and boreal forest biomes. Although most of these NPP estimates have been published in the literature, complete information on the methods and site conditions was often not readily available.
- Class B sites – data for Class B sites represent more numerous “extensive” sites with less documentation and site-specific information available and include study sites from many biomes compiled from existing collections of data. The information on Class B sites is generally “as provided” and is not fully standardized or consistent between sites.
- Class C cells – data for Class C cells represent regional collections of 0.5°-grid cell sites from many biomes compiled from collections of data that have NPP estimates. The EMDI Class C cells represent the results of scaling up from point measurements to grid cells.
The resulting GPPDI database contains six comma-separated files (.csv format). There are two files for each class. One file for each class contains site locations, elevation, NPP estimates, climate data, biome and dominant species information, and references. The other file for each class contains model validation outlier flags derived from site-specific reviews. Documentation of the content and organization of the GPPDI database are provided in this document and in Olson et al. (2001).
The Global Analysis, Interpretation, and Modeling Task Force of the International Geosphere-Biosphere Programme sponsored the EMDI Workshops; the National Center for Ecological Analysis and Synthesis (NCEAS) provided support for data organization and distribution; and the Terrestrial Ecology Program within NASA’s Office of Earth Science (U.S. National Aeronautics and Space Administration, Office of Earth Science, Terrestrial Ecology Program, Activity No. 46WM16401) supported the NPP data compilation.
2. Data Description:
The GPPDI database contains six comma-separated files (.csv format). There are two files for each class (A, B, and C). One file for each class contains site locations, elevation, NPP estimates, climate data, biome and dominant species information, and references. The other file for each class contains model validation outlier flags derived from site-specific reviews.
Spatial Coverage
Site: Global
Site Boundaries:(All latitude and longitude given in decimal degrees)
| Site (Region) | Westernmost Longitude | Easternmost Longitude | Northernmost Latitude | Southernmost Latitude | Elevation (m) |
|---|---|---|---|---|---|
| Global | -156.7 | 176.6 | 75.55 | -49.75 | 0 - 4,903.1 |
Site Information
NPP estimates are provided for 2,525 point sites and 5,164 0.5º-grid cells distributed worldwide (Figure 1). The point measurements of NPP were categorized as either Class A (162 sites), representing intensively studied or well-documented study sites (e.g., with site-specific climate, soils information, etc.); Class B (2,363 sites), representing more numerous “extensive” sites with less documentation and site-specific information available; or Class C, representing regional collections of 5,164 half-degree latitude-longitude grid cells.
| Class Site Categories | Westernmost Longitude | Easternmost Longitude | Northernmost Latitude | Southernmost Latitude | Elevation (m) |
|---|---|---|---|---|---|
| Class A (162 sites) | -148.25 | 152.45 | 66.37 | -27.75 | 30 - 2,450 |
| Class B (2,363 sites) | -156.7 | 176.6 | 75.55 | -47.7 | 0 - 4,240 0 - 6,568 |
| Class C (5,164 0.5º-grid cells) | -122.25 | 152.75 | 48.75 | -49.75 | 1 - 4,903.1 |
Note: Reported elevations are given along with elevations computed by TerrainBase Digital Elevation Model (DEM) where available. DEM elevations are in parenthesis.
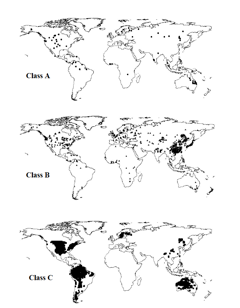
Figure 1. Global distribution of Class A and Class B sites and Class C grid cells
Spatial Resolution
The measurements are based on sampling of small field plots (m2 to 1 ha). Gridded data are half-degree latitude-longitude grid cells.
Temporal Coverage
The point and gridded measurements included here cover the period from 1931 to 1996. This coverage does NOT include all years for all sites.
Temporal Resolution
Each individual point or grid measurement provides an annual NPP estimate. All NPP estimates are based on plant dry matter accumulation, expressed as gC/m2/year (carbon content of dry matter weight).
Data File Information
Table 1. Data files in this data set archive
| FILE NAME | TEMPORAL COVERAGE | FILE CONTENTS |
|---|---|---|
| GPPDI_ClassA_Flags_162.csv | 1931/01/01-1996/01/01 | Class A flags |
| GPPDI_ClassA_NPP_162_R2.csv | 1931/01/01-1996/01/01 | NPP data for Class A sites |
| GPPDI_ClassB_Flags_2363.csv | 1931/01/01-1996/01/01 | Class B flags |
| GPPDI_ClassB_NPP_2363_R1.csv | 1931/01/01-1996/01/01 | NPP data for Class B sites |
| GPPDI_ClassC_Flags_5164.csv | 1931/01/01-1996/01/01 | Class C flags |
| GPPDI_ClassC_NPP_5164.csv | 1931/01/01-1996/01/01 | NPP data for Class C sites |
NPP Data. The GPPDI database contains six data files in comma-separated-value (.csv) format (Table 1). The values -999 and -9999 are used to denote missing data values. N/A is used in text fields to indicate missing information. All NPP units are in gC/m2/yr (carbon content of dry matter weight).
Table 2. Column headings and parameter definitions in Class A NPP data file
| COLUMN HEADING | DEFINITION | UNITS |
|---|---|---|
| SITE_ID | Site identification number based on latitude and longitude | Numeric |
| LAT_DD | Latitude, rounded to two decimal places. Southern latitudes are negative | Decimal degrees |
| LONG_DD | Longitude, rounded to two decimal places. Western longitudes are negative | |
| LAT_OLD | Original latitude, as reported in the references. Southern latitudes are negative | |
| LONG_OLD | Original longitude, as reported in the references. Western longitudes are negative | |
| ELEV_GIV | Elevation of the site, as reported in the references | Meters |
| SOURCE | Compiler of data | Text |
| COUNTRY | Country name where study was located | |
| BIOMENEW | Biome type, standardized to 21 EMDI classes, based on biome, species, and vegetation type | |
| VEG_TYPE | Vegetation type as given in references, somewhat standardized | |
| SPECIES | Dominant species | |
| TEMP_ANN | Annual average temperature, extracted from global gridded climate | Degrees Celsius |
| PREC_ANN | Annual total precipitation, extracted from global gridded climate | Millimeters |
| ANPP_C | Above-ground NPP, carbon content | gC/m2/yr |
| BNPP_C | Below-ground NPP, carbon content | |
| TNPP_C | Total NPP, carbon content | |
| REFERENC | Reference for the NPP value. See Olson et al. (2001) for reference list. | Text |
| YEAR_REF | Year of reference | YYYY or N/A if included in reference |
| MEAS_ID | Unique measurement ID number | Numeric |
Table 3. Column headings and parameter definitions in Class B NPP data file
| COLUMN HEADING | DEFINITION | UNITS |
|---|---|---|
| SITE_ID | Site identification number based on latitude and longitude | Numeric |
| LAT_DD | Latitude, rounded to two decimal places. Southern latitudes are negative | Decimal degrees |
| LONG_DD | Longitude, rounded to two decimal places. Western longitudes are negative. | |
| LAT_OLD | Original longitude, as reported in the references. Southern latitudes are negative | |
| LONG_OLD | Original longitude, as reported in the references. Western longitudes are negative. | |
| ELEV_GIV | Elevation of the site, as given | Meters |
| ELEV_DEM | Elevation extracted from a global DEM (1 km resolution) | |
| SITE_OLD | Site identifier | Text |
| SOURCE | Compiler of data | |
| COUNTRY | Country name | |
| BIOMENEW | Biome type, standardized to 21 EMDI classes, based on biome, species, and vegetation type | |
| SUBBIOME | Sub Biome, e.g., conifer, deciduous, etc | |
| VEG_TYPE | Vegetation type as given, somewhat standardized | |
| SPECIES | Dominant species | |
| TEMP_ANN | Annual average temperature, extracted from global gridded climate | Degrees Celsius |
| PREC_ANN | Annual total precipitation, extracted from global gridded climate | Millimeters |
| ANPP_C | Above-ground NPP, carbon content | gC/m2/yr |
| BNPP_C | Below-ground NPP, carbon content | |
| TNPP_C | Total NPP, carbon content | |
| REFERENC | Reference for the NPP value. See Olson et al. (2001) for reference list. | Text |
| YEAR_REF | Year of reference | YYYY or N/A if included in reference |
| MEAS_ID | Unique measurement ID number | Numeric |
Table 4. Column headings and parameter definitions in Class C NPP data file
| COLUMN HEADING | DEFINITION | UNITS |
|---|---|---|
| CELL_ID | Identification number assigned to cells | Numeric |
| LAT_DD | Latitude in degree of 0.5 degree cell centroid. Southern latitudes are negative | Decimal degrees |
| LONG_DD | Longitude in degree of 0.5 degree cell centroid. Western longitudes are negative | |
| ELEV | Elevation of the cell | Meters |
| SOURCE | Compiler of data | Text |
| BIOME2 | Biome type, consolidated into 14 EMDI classes | |
| BIOME | Biome type, as given, somewhat standardized | |
| TAVE | Annual average temperature, extracted from global gridded climate | Degrees Celsius |
| PRECIP | Annual total precipitation, extracted from global gridded climate | Millimeters |
| NDVI | Annual average Normalized Difference Vegetation Index (NDVI) | Numeric |
| ANPP_C | Above-ground NPP, carbon content | gC/m2/yr |
| TNPP_C | Total NPP, carbon content |
Sample NPP Data Record (GPPDI_ClassB_NPP_2363_R1.csv)
| MEAS_ID,SITE_ID,LAT_DD,LONG_DD,LAT_OLD,LONG_OLD,ELEV_GIV,ELEV_DEM,SITE_OLD, SOURCE,COUNTRY,BIOMENEW,SUBBIOME,VEG_TYPE,SPECIES,TEMP_ANN,PREC_ANN,ANPP_C, BNPP_C,TNPP_C,REFERENC,YEAR_REF 1,1,-45.7,-70.3,-45.7,-70.3,-999,522,rmy,ORNL,ARGENTINA,grassland/C3 ,N/A,steppe,Stipa speciosa (C?),8,136,30,-999,-999,ORNL,N/A 2,2,-45.6,-71.42,-45.6,-71.42,-999,898,mdl,ORNL,ARGENTINA,grassland/C3 ,N/A,grassland steppe,Festuca pallescens (C),5.6,374,20,-999,-999,ORNL,N/A ... |
Table 5. Model validation outlier flags derived from site-specific reviews of Class A and B
| COLUMN HEADING | DEFINITION | UNITS |
|---|---|---|
| SITE_ID | Site identification number based on latitude and longitude | Numeric |
| LAT_DD | Latitude, rounded to two decimal places. Southern latitudes are negative | Decimal degrees |
| LONG_DD | Original latitude, as reported in the references. Southern latitudes are negative | |
| ELEV_GIV | Elevation of the site, as given | Meters |
| SOURCE | Compiler of data | Text |
| BIOMENEW | Biome type, standardized to 21 EMDI classes, based on biome, species, and vegetation type | |
| BIOME2 | Biome type, standardized to 14 EMDI classes, based on BIOMENEW | |
| TEMP_ANN | Annual average temperature, extracted from global gridded climate | Degrees Celsius |
| PREC_ANN | Annual total precipitation, extracted from global gridded climate | Millimeters |
| ANPP_C | Above-ground NPP, carbon content | gC/m2/yr |
| BNPP_C | Below-ground NPP, carbon content | |
| TNPP_C | Total NPP, carbon content | |
| NPP_EST | Total NPP, estimated from ANPP or BNPP if no TNPP | |
| MIXED_F | Mixed biome flag, measurement biome not = to BIOMENEW (weight = 100) | Numeric |
| BIOME_F | Biome flag (if crops, pasture, plantations, or wetlands) (weight = 100) | |
| ELEV_MXF | Elevation flag, if > 2,500 m or < -100 m (weight = 10) | |
| MOD_F | Model output flag, if (npp_est - modca_av) / ave(npp) >1* (weight = 10) | |
| PREC_F | Precipitation flag, if *(prec-prec_ann)/ave(prec)>1 (weight = 10) | |
| TAVE_F | Temperature flag, if *(tave-temp_ann)/ave(tave)>1 (weight = 10) | |
| EMDI_F | Flag identifying outliers determined at EMDI Workshop in December 1999 (weight = 10) | |
| ANPP_P5F | Flag indicating ANPP outside 0.05 - 0.95 percentile by BIOME2 (weight = 1) | |
| BNPP_P5F | Flag indicating BNPP outside 0.05 - 0.95 percentile by BIOME2 (weight = 1) | |
| TNPP_P5F | Flag indicating TNPP outside 0.05 - 0.95 percentile by BIOME2 (weight = 1) | |
| ANNPBADF | Flag indicating ANPP > 2,000 gC/m2/yr, ANPP > 95% TNPP (weight = 1) (weight = 1) | |
| BNPPBADF | Flag indicating BNPP > 2,000 gC/m2/yr, BNPP > 95% TNPP | |
| TNPPBADF | Flag indicating TNPP > 2,000 gC/m2/yr, ANPPBADF or BNPPBADF (weight = 1) | |
| AET_RGF | Flag indicating NPP outside .95 CI of NPP=a+b*AET regression (weight = 1) | |
| PREC_RGF | Flag indicating NPP outside .95 CI of NPP=a+b*PREC regression (weight = 1) | |
| TAVE_RGF | Flag indicating NPP outside .95 CI of NPP=a+b*TAVE regression (weight = 1) | |
| ELEV_F | Elevation flag, if (elev_giv – elev_dem) / ave(elev) > 1(weight = 1) | |
| PRECBADF | Flag indicating Prec outside .01-.99 percentile by biome2 (or > 1,000 millimeters in desert) (weight = 1) | |
| TAVEBADF | Flag indicating Temp outside .01-.99 percentile by biome2 (> 6 in boreal forests) (weight = 1) | |
| MODCX_AV | Average ensemble value from up to 11 EMDI models. X is replaced in files with either A, B, or C to correspond to Class. | gC/m2/yr |
| AETCX_AV | Average ensemble value for Actual Evapotranspiration from up to 5 EMDI models. X is replaced in files with either A, B, or C to correspond to Class. | mm/yr |
| MOD_NE | Calculated normalized error between modeled and measured values | Numeric |
| MOD_BIAS | Calculated bias between modeled and measured values | |
| MOD_MAE | Calculated mean actual error between modeled and measured values | |
| ELEV_NE | Calculated normalized error between gridded and site elevation values | |
| PREC_NE | Calculated normalized error between values gridded and site precipitation values | |
| TAVE_NE | Calculated normalized error between gridded and site temperature values | |
| FLAGS | Sum of all the flag values | |
| FLAGS_N | Count of all the flag values |
Notes: This table defines model validation outlier flags derived from site-specific reviews of Class A and B data. See tables D.15 and D.16 in Olson et al. (2001) for more details.
Sample NPP Data Record (GPPDI_ClassB_Flags_2363.csv)
| SITE_ID, LAT_DD, LONG_DD, ELEV, SOURCE, BIOMENEW, BIOME2, TAVE, PREC, ANPP_C, BNPP_C, TNPP_C, NPP_EST, MIXED_F, BIOME_F, ELEV_MXF, PREC_F, TAVE_F, MOD_,F EMDI_F, ANPP_P5F, BNPP_P5F, TNPP_P5F, NPP_P5F, ANPPBADF, BNPPBADF, TNPPBADF, AET_RGF, PREC_RGF, TAVE_RGF, ELEV_F, PRECBADF, TAVEBADF, MODCB_AV, AETCB_AV, MOD_NE, MOD_BIAS, MOD_MAE, ELEV_NE, PREC_NE, TAVE_NE, FLAGS, FLAGS_N 1, -45.7, -70.3, 522, ORNL grassland / C3, grassland, 8.8, 310, 30, -999, -999, 60, 0, 0, 0, 0, 0, 10, 0, 1, -999, -999, 1, 1, -999, -999, 0, 0, 0, -999, 0, 0, 338, 286, 1.397, 278, 4.634, -999, 0.781, 0.098, 13, 15 2, -45.6, -71.42, 898, ORNL grassland / C3, grassland, 7.5, 1047, 20, -999, -999, 40, 0, 0, 0, 0, 0, 10, 0, 1, -999, -999, 1, 1, -999, -999, 0, 0, 0, -999, 0, 0, 586, 485, 1.744, 546, 13.646, -999, 0.947, 0.293, 13, 15 4, -43.17, 171.75, 1040, Gower, ENL forest / temperate, ENL forest / temperate, 7.4, 1537, 740, -999, -999, 949, 0, 0, 0, -999, -999, 0, 0, 0, -999, -999, 0, 0, -999, -999, 0, 0, 0, 0, 0, 0, 648, 589, -0.377, -301, -0.317, -0.133, -999, -999, 0, 14 ... |
Table 6. Model validation outlier flags derived for Class C data
| FLAG NAME | DEFINITION |
|---|---|
| BIOME_F | Biome=crop, bare ground |
| NPP_F | Missing total NPP (totnpp) |
| ELEV_MXF | Elevation > 2,500 m or < -100 m |
| ANPP_P5F | ANPP outside 0.05 percentile by BIOME2 |
| BNPP_P5F | BNPP outside 0.05 percentile by BIOME2 |
| TNPP_P5F | TNPP outside 0.05 percentile by BIOME2 |
| ANNPBADF | ANPP > 2,000 gC/m2/yr, ANPP < 50 or ANPP > 95% TNPP |
| TNPPBADF | TNPP > 3,000 gC/m2/yr, TNPP < 50 or ANPPBADF |
| PRECBADF | Annual precipitation (anu_ppt) outside .01-.99 percentile by biome2 (or > 5,000 millimeters) |
| TAVEBADF | Annual average temperature outside .01-.99 percentile by biome2 (> 30 degrees C) |
| NPPFLAG | Total NPP outside .95 CI of NPP=a+b*MNPP_C regression |
| PRECFLAG | Total NPP outside .95 CI of NPP=a+b*PREC regression |
| TEMPFLAG | Total NPP outside .95 CI of TNPP=a+b*TAVE regression |
| MOD_F | (totnpp – mnpp_c) / ave(npp) >1 |
3. Data Application and Derivation:
Progress in modeling the global carbon cycle was previously inhibited by the lack of adequate observational data for model parameterization and validation, such as NPP and its individual components from field measurements (Scurlock et al., 1999). To address this problem, the GPPDI was set up as a Focus 1 Activity of the International Geosphere Biosphere Programme Data and Information System (IGBP-DIS), a coordinated international program to improve worldwide estimates of terrestrial NPP for parameterization, calibration, and validation of NPP models at various scales (Prince et al., 1995). The objectives were to take extensive but incomplete data sets and make them usable for analyses and models by estimating total NPP in a consistent manner, for points and for large-grid cells. Between 1996 and 2001, the GPPDI process produced more than 7,500 estimates of NPP globally from ecological sites as well as estimates of NPP for regularly gridded regions using agricultural and forestry statistics that have high spatial density over those regions. This represents a more comprehensive database of measurements than had previously existed.
The cumulative progress in compiling complete and consistent NPP data under the GPPDI contributed to the Ecosystem Model-Data Intercomparison (EMDI) workshops at the University of New Hampshire, Durham, New Hampshire, USA, December 5–8, 1999, and at the National Center for Ecological Analysis and Synthesis (NCEAS), Santa Barbara, California, USA, April 18–21, 200l to assess the accuracy of global model forecasts of terrestrial carbon cycling. The approach was to run regional or global versions of the models for sites with NPP measurements (i.e., not fine-tuned for specific site conditions) and analyze the model-data differences. The GPPDI data were analyzed to extract a subset of NPP data suitable for the EMDI workshops.
4. Quality Assessment:
The NPP data have undergone several levels of review or filtering. The activities associated with the GPPDI, especially the three Working Groups funded by NCEAS, provided a literature review that resulted in selecting Class A sites. The EMDI activity provided another level of review for all the data by examining relationships between NPP estimates and associated environmental controlling variables, such as temperature and precipitation. As a results of the EMDI review, flags were assigned to each GPPDI NPP estimate and a subset of GPPDI data was selected for the model-data intercomparison based on the flags.
The data were reviewed at the EMDI I Workshop, and a strategy was developed for additional “outlier analysis” to flag those NPP measurements that, in combination with their driver data and the NPP ensemble model values, appeared to be unrepresentative or represented conditions that the global ecosystem models did not consider (e.g., wetlands). The EMDI Workshop participants also agreed on (1) an approach to assigning consistent biome classes to all sites, (2) standardizing latitude and longitude to two decimal places, and (3) assigning unique identifiers for locations (SITE_ID) and individual measurements (MEAS_ID) within classes for linking with model driver data and validation data.
The specific issues that were addressed include:
• Biome class consistency – The review of biome assignments was prompted in part by the problems in using the satellite-derived land cover for each site (i.e., often this represented the dominant land cover for a 1 x 1 km area, not the cover for the 1 x 1 m to 1-hectare NPP measurement site).
• Managed sites – GPPDI includes some heavily managed sites and wetlands, but the EMDI modelers decided to flag and exclude these sites from the EMDI comparison.
• Multiple NPP values for a site – Some sites in GPPDI data files have several NPP values, often from several vegetation types, possibly as a result of reporting imprecise latitude/longitude coordinates or different studies at the same location. Some GPPDI Class B sites have up to 35 observed NPP values at a site. Each site was assigned an EMDI biome class and the biome of every NPP measurements at the site reviewed. Those NPP data that were inconsistent with the site biome were flagged. A few GPPDI Class C cells also had multiple NPP values where data had been compiled based upon different studies.
See Olson et al. (2001) for detailed discussion of data quality issues and outlier analysis.
Sources of Error
Approximately 50% of Class B measurement sites lacked a site-specific record of elevation. TerrainBase Digital Elevation Model (DEM), which has a 5-minute resolution (approximately 10 km at the equator), was used to generate elevation when missing. Because of the limited precision of both the site coordinates and the DEM algorithm, the latitude/longitude/elevation values may contain significant errors. Approximately 5% of the elevations based on the DEM had significantly negative elevations (>100 m below sea level), a likely indicator of compounded errors.
Missing NPP components for sites were often estimated using the approaches described in Appendices B and C of Olson et al. (2001).
5. Data Acquisition Materials and Methods:
The NCEAS Project "Development of a Consistent Worldwide Net Primary Production (NPP) Database" consisted of meetings of three working groups conducted from December 1997 to October 1998. The purpose of these meetings was to develop methodologies for extrapolating sparse field observations of net primary production, including environmental controls on carbon allocation, and to create data sets representative of major worldwide vegetation and environmental regimes. The methodologies were then used to produce consistent data sets of worldwide NPP estimates, which were previously not available. The data sets were intended to be used by global change researchers to (1) parameterize and validate global primary production models, (2) calibrate models driven by remotely sensed data, and (3) re-examine worldwide patterns of NPP. The data sets include key ecological data such as biomass dynamics, climate and soils information, and NPP, providing a valuable global resource for a variety of other ecological studies such as biodiversity and nutrient cycling.
Under funding from the NASA Terrestrial Ecosystems Program, 72 site-specific NPP data sets were compiled by the ORNL DAAC with grassland sites constituting over half the collection. Seven multi-biome data sets were also compiled containing NPP estimates for over 1,700 sites. Three additional multi-biome data sets, including this GPPDI database as well as EMDI and gridded GPPDI, have also been compiled.
Most of the NPP estimates were originally provided in units of dry biomass (organic matter). These values were converted to carbon units (e.g., gC/m2/yr) using a mass fraction of 0.5 for woody components and 0.45 for grass and foliage components. When investigators were unable to determine whether the biomass was predominantly wood or foliage, a ratio of 0.475 g C per 1 g biomass was used.
I. Data Compilation and Classification to Class Type
- GPPDI Class A Data. The NPP data compiled by the NCEAS Working Groups and other GPPDI activities were used to create the GPPDI Class A data file. Under the auspices of GPPDI, a series of three Working Group meetings were held at NCEAS to take extensive but incomplete NPP data sets and make them usable for analyses and models by estimating total NPP in a consistent manner, for points and for grid cells (i.e., 0.5°). In addition, NPP projects at ORNL and the University of Maryland were funded by the NASA Terrestrial Ecosystems Program to compile much of NPP data described in this section.
One hundred and sixty-two NPP estimates were compiled for 150 unique Class A sites that represent grassland, tropical forest, temperate forest and boreal forest sites with complete NPP measurements (above- and below-ground components) and relatively complete documentation. NPP data for 140 of these sites were the product of the extensive review as part of the NCEAS NPP working groups described in Olson et al. (2001) including 30 tropical forests, 69 boreal forests, and 41 grasslands. These sites had NPP estimates for above- and below-ground components either as provided by the primary data source or as estimated in the respective synthesis papers. Data for the remaining 10 sites came from a variety of site-specific sources that reported NPP for above- and below-ground components. See Olson et al. (2001) for details. The information is generally “as provided”; however, the goal of the NCEAS and ORNL review processes were to select NPP estimates that were based on comparable methods and expressed in common units of measure.
- GPPDI Class B Data. Class B sites represent grassland, tropical forest, temperate forest, boreal forest, tundra, savanna, crops, and plantations sites that have at a minimum ANPP measurements (about 20% have both ANPP and BNPP), a site location, and documentation (e.g., a literature citation). Most of the Class B data (1,324 NPP estimates) represent existing multi-biome collections of data available from the ORNL DAAC (http://daac.ornl.gov/NPP/npp_home.html) (DeAngelis et al., 2013; Esser et al., 2013; Gower et al., 2001; Hall, 1997; Krankina, 2013; Ni et al., 2001, Waring et al., 2013). An additional 130 NPP estimates were assembled from the ORNL NPP collection of individual sites and 909 NPP estimates were acquired from Gower et al. (2001). Although most of these NPP estimates have been published in the literature, complete information on the methods and site conditions was often not readily available. The information on Class B sites is generally “as provided” and is not fully standardized or consistent between sites. The resulting Class B data set contains 2,363 NPP measurements for 1,271 unique sites. Minimum, mean, and maximum NPP values for the 1,271 unique sites were calculated by ORNL and distributed to the modelers. Olson et al. (2001) describe the data sets that were used to compile the Class B data set (e.g., Chinese forest NPP data set; IBP woodlands data set; Osnabrück NPP data set; etc).
- GPPDI Class C Grid Cell-based Data. The GPPDI database contains 5,164 NPP estimates for 0.5º grid cells (Class C cells). Of these, 3,555 estimates (79% in the USA) were developed from 15 studies representing NPP in croplands, sparse vegetation, shrublands, grasslands, and forests worldwide (Zheng et al., 2003). An additional 1,609 cells were added after the Zheng et al. (2004) paper was submitted. The data set contains new data for 2,334 grid cells from Australia, China, South America, Senegal, Finland, and Sweden (Zheng et al., 2013) combined with the 2,830 cells from Class C data for the United States compiled for EMDI I.
II. Model Driver Data
Model driver data (e.g., vegetation type, climate, and soils associated with a site used to parameterize ecosystem models) were compiled from the original data sources for the GPPDI data files specifically for the EMDI workshops. The information is consistent for all sites but may represent a value for a 5-km or 5-minute grid cell within which a Class A or B site is located, thus the data may not necessarily reflect the conditions at the specific site of the NPP measurement.
III. Elevation
For Class A and B sites, the site elevation from the published literature was used when available. Terrain Base Digital Elevation Model (DEM), which has a 5-minute resolution (approximately 10 km at the equator), was used to generate elevation where missing. Because of the limited precision of both the site coordinates and the DEM algorithm, the latitude/longitude/elevation values may contain significant errors. Approximately 5% of the elevations based on the DEM had significantly negative elevations (>100 m below sea level), a likely indicator of compounded errors.
Elevations for Class C cells were derived from the Global Land One-km Base Elevation (GLOBE) Project, a quality-controlled global DEM developed by the US National Geophysical Data Center for International Geosphere-Biosphere Programme, Data and Information System (IGBP-DIS). Aggregation of the GLOBE DEM 1-km elevations to 0.5° cells resulted in only 0.2% of cells with significantly negative elevations. The GLOBE database was not available in 1999 when the Class A and B sites were assigned elevations.
II. Site Classification by Biome
Twenty-one (21) biome classes were defined to represent the data and needs of the models for the EMDI workshops. Sites were assigned to a biome based on initial biome class, sub-biome, species, vegetation type, and elevation.
Table 7. Biome Categories for Class A and B Sites
| Biome Type | Aggregated Biome Type | Number of Sites | |
|---|---|---|---|
| Class A | Class B | ||
| Crops | Managed | 0 | 14 |
| Pasture | Managed | 0 | 17 |
| Plantation | Managed | 0 | 27 |
| Wetland | Managed | 0 | 46 |
| Deciduous broad-leaf forest / boreal | DBL forest / boreal | 6 | 43 |
| Deciduous broad-leaf forest / temperate | DBL forest / temperate | 6 | 233 |
| Deciduous broad-leaf forest / tropical | DBL forest / tropical | 6 | 17 |
| Desert | Desert | 0 | 26 |
| Deciduous needle-leaf forest / boreal | DNL forest / boreal | 9 | 29 |
| Evergreen broad-leaf forest / temperate | EBL forest / temperate | 0 | 250 |
| Evergreen broad-leaf forest / tropical | EBL forest / tropical | 27 | 102 |
| Evergreen needle-leaf forest / boreal | ENL forest / boreal | 56 | 117 |
| Evergreen needle-leaf forest / temperate | ENL forest / temperate | 6 | 210 |
| Grassland / C3 | Grassland | 10 | 41 |
| Grassland / C4 temperate | Grassland | 6 | 18 |
| Grassland / C4 tropical | Grassland | 30 | 32 |
| Mediterranean | Savanna | 0 | 12 |
| Mixed forest | Mixed forest | 0 | 49 |
| Savanna / temperate | Savanna | 0 | 1 |
| Savanna / tropical | Savanna | 0 | 8 |
| Tundra | Tundra | 0 | 24 |
| Subtotal | 162 | 1,317 | |
| Not specified | 0 | 1,046 | |
| Total Records | 162 | 2,363 | |
Table 8. Biome Categories for Class C Sites
| Biome Type | Aggregated Biome Type | Number of Sites |
|---|---|---|
| Class C | ||
| Arid shrubland | Shrubland | 64 |
| Bare ground | Bare ground | 7 |
| Boreal | Forest / boreal | 4 |
| Boreal conifer-dominated | ENL forest / boreal | 82 |
| Boreal forest | Forest / boreal | 66 |
| Closed shrubland | Shrubland | 1 |
| Crop | Crops | 220 |
| Deciduous forest | DBL forest / tropical | 16 |
| Evergreen forest | EBL forest / tropical | 1,195 |
| Forest | Forest / temperate | 2 |
| Grass | Grassland | 2,285 |
| Grassland | Grassland | 33 |
| Open shrubland | Shrubland | 520 |
| Savanna | Savanna | 69 |
| Subtropical forest | Forest / tropical | 10 |
| Temperate forest | Forest / temperate | 342 |
| Wooded grassland | Wooded grassland | 115 |
| Woodland | Forest | 2 |
| Xeric forest | Forrest / xeric | 131 |
| Total Records | 5,164 |
6. Data Access:
These data are available through the Oak Ridge National Laboratory (ORNL) Distributed Active Archive Center (DAAC).
Data Archive Center:
Contact for Data Center Access Information:
E-mail: uso@daac.ornl.gov
Telephone: +1 (865) 241-3952
7. References:
Chambers, J. Q., J. dos Santos, R. J. Ribeiro, and N. Higuchi. 2001. Tree damage, allometric relationships, and above-ground net primary production in Central Amazon forest. Forest Ecology and Management 152, 73-84.
Clark, D. A., S. Brown, D. W. Kicklighter, J. Q. Chambers, J. R. Thomlinson, Jian Ni, and E. A. Holland. 2001. Net primary production in tropical forests: an evaluation and synthesis of existing field data. Ecological Applications 11, 371-384.
Clark, D. A., S. Brown, D. W. Kicklighter, J. Q. Chambers, J. R. Thomlinson, and Jian Ni. 2001 Measuring net primary production in forests: concepts and field methods. Ecological Applications 11, 356-370.
DeAngelis, D.L., R.H. Gardner, and H.H. Shugart. 2013. NPP Multi-Biome: Global IBP Woodlands Data, 1955-1975. Data set. Available on-line [http://daac.ornl.gov] from Oak Ridge National Laboratory Distributed Active Archive Center, Oak Ridge, Tennessee, USA. doi:10.3334/ORNLDAAC/198
Esser, G. 2013. NPP Multi-Biome: Global Osnabruck Data, 1937-1981. Data set. Available on-line [http://daac.ornl.gov] from Oak Ridge National Laboratory Distributed Active Archive Center, Oak Ridge, Tennessee, USA. doi:10.3334/ORNLDAAC/214
Gill, R.A., R.H. Kelly, W.J. Parton, K.A. Day, R.B. Jackson, J.A. Morgan, J.M O. Scurlock, L.L. Tieszen, J. Vande Castle, D.S. Ojima, and X.S. Zhang. 2002. Using simple environmental variables to estimate below ground productivity in grasslands. Global Ecology and Biogeography. 11(1): 79-86.
Gower, S. T., O. Krankina, R. J. Olson, M. Apps, S. Linder, and C. Wang. 2001. Net primary production and carbon allocation patterns of boreal forest ecosystems. Ecological Applications 11: 1395-1411.
Jenkins, J. C., R. A. Birdsey, and Y. Pan. 2001. Biomass and NPP estimation for the mid-Atlantic region (USA) using plot-level forest inventory data. Ecological Applications 11, 1174-1193.
Kicklighter, D. W. 2013. NPP Multi-Biome: TEM Calibration Data, 1992. Available on-line [http://daac.ornl.gov/] from Oak Ridge National Laboratory Distributed Active Archive Center, Oak Ridge, Tennessee, USA. doi:10.3334/ORNLDAAC/471
Krankina, O.N. 2013. NPP Boreal Forest: Siberian Scots Pine Forests, Russia, 1968-1974 R[evision]1. Data set. Available on-line [http://daac.ornl.gov] from Oak Ridge National Laboratory Distributed Active Archive Center, Oak Ridge, Tennessee, USA. doi:10.3334/ORNLDAAC/467
Ni, Jian, Xin-shi Zhang, and J. M. O. Scurlock. 2001. Synthesis and analysis of biomass and net primary productivity in Chinese forests. Annals of Forest Science 58, 351-384.
Olson, R. J., K.R. Johnson, D.L. Zheng, and J.M.O. Scurlock. 2001. Global and Regional Ecosystem Modeling: Databases of Model Drivers and Validation Measurements. ORNL Technical Memorandum TM-2001/196. Oak Ridge National Laboratory, Oak Ridge, Tennessee, U.S.A.
Olson, R. J., J. M. O. Scurlock, S. D. Prince, D. L. Zheng, and K. R. Johnson (eds.). 2013. NPP Multi-Biome: NPP and Driver Data for Ecosystem Model-Data Intercomparison, R[evision]2. Data set. Available on-line [http://daac.ornl.gov] from Oak Ridge National Laboratory Distributed Active Archive Center, Oak Ridge, Tennessee, USA. doi:10.3334/ORNLDAAC/615
Prince, S.D., J. Haskett, M. Steininger, H. Strand, and R. Wright. 2001. Net primary production of U.S. Midwest croplands from agricultural harvest yield data. Ecological Applications 11, 1194-1205.
Prince S.D., R.J. Olson, G. Dedieu, G. Esser, and W. Cramer. 1995. Global Primary Production Data Initiative Project Description. IGBP-DIS Working Paper No. 12. International Geosphere-Biosphere Program - Data and Information System, Toulouse.
Scurlock, J.M.O., W. Cramer, R.J. Olson, W.J. Parton, and S.D. Prince. 1999. Terrestrial NPP: Towards a consistent data set for global model evaluation. Ecol. Appl. 9(3): 913-919.
Waring, R.H., B. Law, and B. Bond. 2013. NPP Temperate Forest: OTTER Project Sites, Oregon, U.S.A., 1989-1991. Data set. Available on-line [http://daac.ornl.gov] from Oak Ridge National Laboratory Distributed Active Archive Center, Oak Ridge, Tennessee, USA. doi:10.3334/ORNLDAAC/472
Zheng, D.L., S.D. Prince, and R. Wright. 2003. Terrestrial net primary production estimates for 0.5 degree grid cells from field observations - a contribution to global biogeochemical modeling. Global Change Biology 9(1): 46-64.
Zheng, D. L., S. D. Prince, and T. Hame. 2004. Estimating net primary production of boreal forests in Finland and Sweden from field data and remote sensing. Journal of Vegetation Science 15(2): 161-170.
Zheng, D.L., S.D. Prince, and R. Wright. 2013. NPP Multi-Biome: Gridded Estimates for Selected Regions Worldwide, 1954-2001, R[evision]3. Data set. Available on-line [http://daac.ornl.gov] from the Oak Ridge National Laboratory Distributed Active Archive Center, Oak Ridge, Tennessee, USA. doi:10.3334/ORNLDAAC/614
Additional Sources of Information:
Please see Olson et al. (2001) for additional data sources and references.
8. Data Set Revisions:
Revision Summary:
The GPPDI Class A data file [GPPDI_ClassA_NPP_162_R1.csv] has been corrected to revise previously reported net primary production (ANPP, BNPP, and TNPP) values for three OTTER transect sites. The GPPDI Class B data file GPPDI_ClassB_NPP_2363.csv] has been corrected to revise previously reported BNPP and TNPP estimates for Vindhyan, India.
Data File Changes:
The GPPDI data file for Class A sites [GPPDI_ClassA_NPP_162_R1.csv ] has been corrected to revise previously reported above-ground, below-ground, and total NPP values for temperate forests at Waring's Woods, Scio (unfertilized), and Juniper/Sisterssites along the OTTER Project transect to agree with values reported in Runyon et al. (1994). GPPDI data for these three OTTER sites in GPPDI_ClassA_NPP_162_R2.csv are now correct.
NOTE:
Uncorrected refers to the file GPPDI_ClassA_NPP_162_R1.csv
Corrected refers to the file GPPDI_ClassA_NPP_162_R2.csv
| Site Identification | Parameter Field | Uncorrected | Corrected |
|---|---|---|---|
| GPPDI Class A 94 (MI 91) (ott Waring's Woods) | ANPP (gC/m2/yr) | 556 | 551 |
| BNPP (gC/m2/yr) | 219 | 181 | |
| TNPP (gC/m2/yr) | 774 | 732 | |
| GPPDI Class A 95 (MI 92) (ott Scio, unfertilized) | ANPP (gC/m2/yr) | 551 | 831 |
| BNPP (gC/m2/yr) | 181 | 238 | |
| TNPP (gC/m2/yr) | 732 | 1,069 | |
| GPPDI Class A 91 (MI 88) (ott Juniper/Sisters) | ANPP (gC/m2/yr) | 67 | 57 |
| TNPP (gC/m2/yr) | 152 | 143 |
The GPPDI data file for Class B sites [GPPDI_ClassB_NPP_2363.csv] has been corrected to revise previously reported BNPP and TNPP estimates that were averaged for three derived savannas at Vindhyan, India. The long-term annual average estimates of BNPP and TNPP for the three sub-sites (Ranitali, Hathinala, and Telburva) were revised to agree with Pandey and Singh (1992). GPPDI data for Vindhyan, India in GPPDI_ClassB_NPP_2363_R1.csv are now correct.
NOTE:
Uncorrected refers to the file GPPDI_ClassB_NPP_2363.csv
Corrected refers to the file GPPDI_ClassB_NPP_2363_R1.csv
| Site Identification | Parameter Field | Uncorrected | Corrected |
|---|---|---|---|
| GPPDI Class B 165 (MI 281) (average of three sub-sites) | BNPP (gC/m2/yr) | 560 | 294 |
| TNPP (gC/m2/yr) | 800 | 549 |
Data User Action: If you downloaded the referenced data set from the ORNL DAAC on-line archive before August 29, 2013, you should download it again from the ORNL DAAC.
Revision History:
Original Citation
Olson, R.J., J.M.O. Scurlock, S.D. Prince, D.L. Zheng, and K.R. Johnson (eds.). 2001. NPP Multi-Biome: Global Primary Production Data Initiative Products. Data set. Available on-line [http://daac.ornl.gov] from the Oak Ridge National Laboratory Distributed Active Archive Center, Oak Ridge, Tennessee, U.S.A.