Get Data
Summary:
This data set contains three files (.txt format) for an established 8.25 ha boreal forest dominated by Norway spruce, Picea abies, at Flakaliden (64.12 N 19.45 E) in northern Sweden. Two data files contain stand characteristics, above- and below-ground biomass, and Net Primary Productivity (NPP) allocation data (one file for plots fertilized and irrigated during the growing season and one file for control plots). The third file provides climate data for the period 1991-1995 from a weather station established at the study site.
The experimental forest was established in 1963 by planting 4-year-old P. abies seedlings after clear-felling, burning, and soil scarification. A yield optimization study was started in 1986 to compare the productivity of the boreal forest under four types of treatment (only the results of fertilization/irrigation and no treatment are presented herein). Treatments began in 1987 and continued through the 1996 growing season. Field measurements were made by inventory and harvest methods. After three years of treatment, height and diameter growth in the fertilized/irrigated stands were double that of the control stand. After 10 years, volume growth of fertilized/irrigated stands were almost four times that of the control.
Total net primary production (TNPP) of the 36-year-old untreated stand in 1995 was 291 g/m2/year. TNPP in the fertilized/irrigated stand (902 g/m2/year) was more than three times that of the control, confirming earlier findings that nutrient availability is a major constraint on forest production in Sweden.
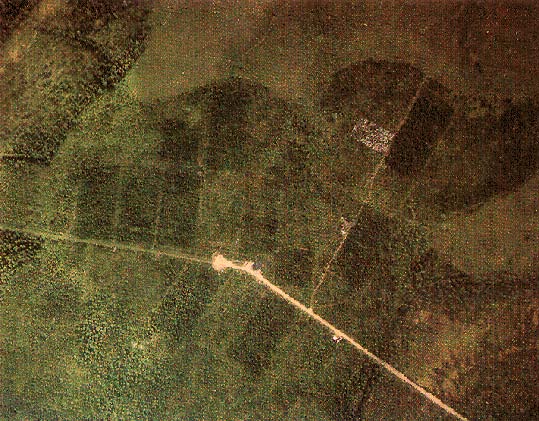
Figure 1. Aerial view of the Flakaliden study site, Sweden, four years after beginning of the fertilization and irrigation treatments. (The fertilized plots stand out as having a darker green canopy color. Photograph taken 1990; reproduced by kind permission of Dr. S.Linder, Swedish University of Agricultural Sciences, Uppsala.)
Revision Notes: NPP data files associated with the yield optimization study at the Flakaliden boreal forest in Sweden have been revised. The year when stemwood was harvested for nutrient analysis after treatment began at the experimental sites has been corrected to agree with that reported in Stockfors and Linder (1998). Additional data for foliage nitrogen content from Linder (1995) and LAI data from Phillips et al. (2001) have been added to both data files. Please see the Data Set Revisions section of this document for detailed information.
Additional Documentation
The NPP data collection contains field measurements of biomass, estimated NPP, and climate data for terrestrial grassland, tropical forest, temperate forest, boreal forest, and tundra sites worldwide. Data were compiled from the published literature for intensively studied and well-documented individual field sites and from a number of previously compiled multi-site, multi-biome data sets of georeferenced NPP estimates. The principal compilation effort (Olson et al., 2001) was sponsored by the NASA Terrestrial Ecology Program. For more information, please visit the NPP web site at http://daac.ornl.gov/NPP/npp_home.shtml.
Data Citation:
Cite this data set as follows:
Linder, S. 2013. NPP Boreal Forest: Flakaliden, Sweden, 1986-1996, R1. Data set. Available on-line [http://daac.ornl.gov] from Oak Ridge National Laboratory Distributed Active Archive Center, Oak Ridge, Tennessee, USA. doi:10.3334/ORNLDAAC/201
This data set was originally published as:
Linder, S. 1998. NPP Boreal Forest: Flakaliden, Sweden, 1986-1996. Data set. Available on-line [http://daac.ornl.gov] from Oak Ridge National Laboratory Distributed Active Archive Center, Oak Ridge, Tennessee, USA
Table of Contents:
- 1 Data Set Overview
- 2 Data Description
- 3 Applications and Derivation
- 4 Quality Assessment
- 5 Acquisition Materials and Methods
- 6 Data Access
- 7 References
- 8 Data Set Revision Information
1. Data Set Overview:
Project: Net Primary Production (NPP)
Productivity of a boreal coniferous forest was determined at the Flakaliden experimental site for a yield optimization study, beginning in 1986. The principal aim was to determine the potential yield of a young stand of Norway spruce, Picea abies, under given climatic conditions, non-limiting soil water, and optimal nutritional status without leaching to groundwater.
The 8.25 ha Flakaliden study site (64.12 N 19.45 E) is situated in northern Sweden, about 60 km west of the city of Umeå. The site has a harsh boreal climate with short, cool summers of long days, and long, cold winters of short days. Monthly mean air temperature ranges from -8.7 C in February to 14.4 C in July. More than one-third of the annual precipitation (approx. 600 mm) falls as snow.
The study site was planted with 4-year old P. abies seedlings in 1963 after clear-felling, prescribed burning, and soil scarification. The fertilization experiment, consisting of four treatments with four replicates each (50 m x 50 m plots), commenced in 1987. Treatments comprised irrigation with sprinklers, solid fertilization, irrigation with liquid fertilizer, and a control. Only the results from control plots and plots receiving a daily supply of nutrients supplied in irrigation water are reported in this data set. The results from the other two treatments (irrigation with no fertilizer applied and annual application of solid fertilizer) are reported in the literature.
The annual dose of nitrogen was initially 100 kg N/ha, the other nutrients (P, K, Ca, S, Mg) being supplied in fixed proportion to N, adjusted annually against needle samples, in an attempt to attain the optimal nutrient dose. The N dose was reduced 25% in 1990. Complete inventories were carried out in 1986, 1991, and 1996, determining height and diameter at breast height for every tree. In the intervening years, about 100 trees per treatment were sub-sampled.
After three years of treatment, height and diameter growth in the fertilized/irrigated stands was double that of the control stand. After 10 years, volume growth of fertilized stands was almost four times that of the control. Data from this site were used to parameterize and test the BIOMASS process-based model; parameter values are available from the references cited herein.
Total net primary production of a 36-year-old untreated stand in 1995 was estimated at 291 g/m2/year (above-ground = 198; below-ground = 93 g/m2/year), and increased more than three times in the fertilized/irrigated treatment to 902 g/m2/ year, with more carbon allocated to shoot than root growth (above-ground = 678; below-ground = 224 g/m2/year) (Linder/McMurtrie, pers. comm., Bergh et al., 1999); Scurlock and Olson, 2012) .
ANPP and TNPP estimates for Flakaliden are also reported in Gower et al. (2001) and Olson et al. (2012a, b) but differ from values presented herein due to different calculation methods (Table 1).
Table 1. ANPP, BNPP, and TNPP values reported by various published data sources
| File Name or Description | Data Source(s) | Sub-Site | ANPP | BNPP | TNPP |
|---|---|---|---|---|---|
| gC/m2/year | |||||
| flk1_npp_r1.txt | Linder/McMurtrie, pers. comm.1 | flk control (36-yr-old stand in 1995)2 | 94 | 44 | |
| flk2_npp_r1.txt | flk irr-fert (36-yr-old stand in 1995)2 | 322 | 106 | 429 | |
| NPP_Multibiome_EnvReview _Table_A1_R1.xls |
Scurlock and Olson (2012) based on Bergh et al. (1999) | flk (values for control site in year 1995) | 94 | 44 | 138 |
| GPPDI_ClassA_NPP_162_R2.csv | Olson et al. (2012a, b)based on Bergh (1997) | Class A 143 (MI 165) | 35 | NA | 156 |
| EMDI_ClassA_NPP_81_R2.csv | Class A 143 | 35 | NA | 156 | |
| borfornpp2.csv | Gower et al. (2001; 2012) based on Bergh (1977) | Class II Flakaliden (30-yr-old stand) | 35 | NA | NA |
Notes: NA = Not available. MI = Measurement identification number.
The differences in NPP values reported in this table are mainly due to differences in calculation methods, as explained in these notes. Please consult original references for details.
Revised data sets (R1, R2, etc) are accompanied by ORNL DAAC Data Set Change Information files. Please see the corresponding documentation for reasons why the data values were revised.
1For this table, NPP data from the original data source were converted from grams of dry weight per meter square per year to grams of carbon per meter square per year using a conversion factor of 0.475.
2The NPP data files (flk1_npp_r1.txt and flk2_npp_r1.txt) also provide NPP data for years 1991-1994.
2. Data Description:
This data set contains three text files for the 8.25 ha Flakaliden study site (64.12 N 19.45 E) in northern Sweden. Two NPP data files contain stand characteristics, above- and below-ground biomass, and production allocation data for the established boreal forest dominated by Norway spruce Picea abies. One of the NPP data files provides the results for a study area treated with a complete nutrient solution which was injected into the irrigation water and supplied daily during the growing season (June to mid-August). The other NPP data file provides the results for a control plot which received no treatment. Treatments began in 1987 and continued through the 1996 growing season. The third data file provides climate data for the period 1991-1995 from a weather station established at the study site. A longer set of climate data is available from the Svartberget Experimental Station (25 km to Northeast; elevation 225 m) but is not included in this data set.
Spatial Coverage
Site: Flakaliden, Sweden
Site Boundaries:(All latitude and longitude given in decimal degrees)
| Site (Region) | Westernmost Longitude | Easternmost Longitude | Northernmost Latitude | Southernmost Latitude | Elevation (m) |
|---|---|---|---|---|---|
| Flakaliden, Sweden | 19.45 | 19.45 | 64.12 | 64.12 | 310-320 |
Site Information
The Flakaliden study site (64.12 N 19.45 E) is situated in northern Sweden, about 60 km west of the city of Umeå. The site has a harsh boreal climate with short, cool summers of long days, and long, cold winters of short days. Monthly mean air temperature ranges from -8.7 C in February to 14.4 C in July, and snow usually covers the frozen ground from mid October to early May. Mean annual precipitation is approximately 600 mm, of which more than one-third falls as snow.
The Flakaliden experiment was laid out in 1986 in a young Norway spruce (P. abies) stand, planted in 1963 with 4-year-old seedlings of a local provenance, after clear-felling, prescribed burning, and soil scarification. At the start of the experiment the mean height of the trees was 3.0 m, diameter at breast height (DBH, 1.3 m) was 36 mm, and the number of trees was (ca.) 2,400 per ha. Two nutrient optimization treatments were included in the experiment. The first treatment was a complete nutrient solution, which was injected into the irrigation water and supplied every day during the growing season (June to mid-August). The second treatment was a solid fertilizer mix, which was applied in early June each year. Control plots and plots with irrigation only were also included. Only the results from control plots and plots receiving a daily supply of nutrients combined with irrigation are reported in this data set. For further details regarding the treatments, see Linder (1995).
The treatment described herein, which began in 1987, was replicated four times, and each replicate consisted initially of a double plot, made up of two 50 m x 50 m plots. Each plot contained a net plot (1,000 m2) surrounded by a buffer zone. All non-destructive measurements were made on the net plot, and destructive sampling was restricted to the buffers. Some of the plots were later used for new treatments, but without reducing the number of true replicates. The total area of the experiment was 8.25 ha.
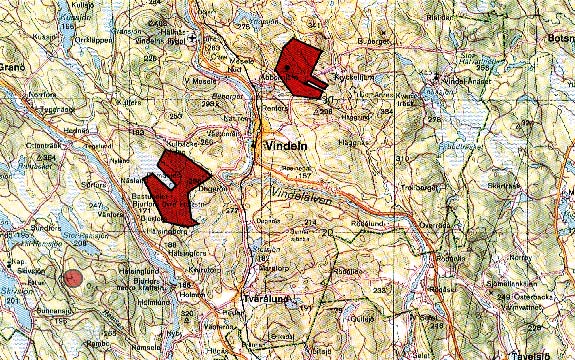
Figure 2. Location map for Flakaliden Experimental Forest, which is administered by the Swedish University of
Agricultural Sciences, Uppsala, Sweden. The Flakaliden site is marked by the large red dot on the bottom left side of the
map; also marked in red are the Svartberget and Kulbäcksliden Experimental Forests, near the town of Vindeln, about 60 km
north-west of Umeå. Map reproduced by kind permission of Dr. S. Linder and the Swedish University of Agricultural
Sciences. (flk_02.jpg)
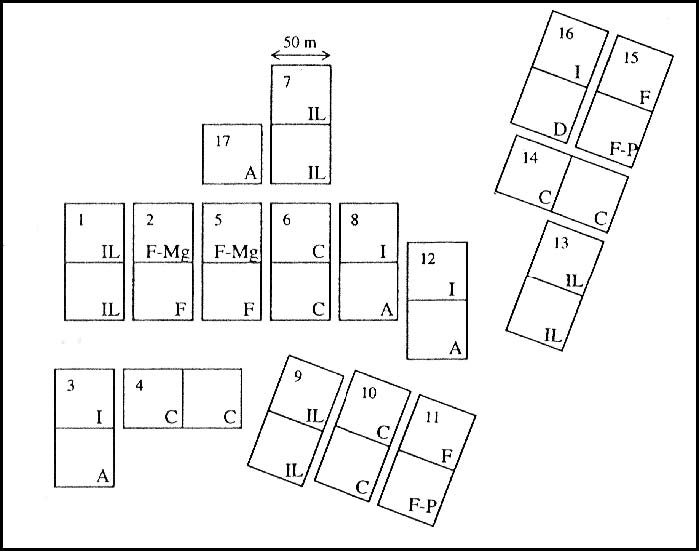
Figure 3. Schematic map of the Flakaliden boreal forest study site. The main experiment consists of untreated control plots (C) and treatments with irrigation (I), annual fertilization with solid fertilizers (F), and 'daily' fertilization (June-August) combined with irrigation (IL). Each treatment is replicated four times. Other treatments include nitrogen fertilization supplemented with wood ash (A), and fertilization with all essential nutrient elements except phosphorus (F-P) or magnesium (F-Mg). One plot is used for a water exclusion treatment (D), where summer precipitation is reduced by 65%. Only the results from C and IL plots are presented in this data set. See Bergh et al. (1998) and Bergh et al. (1999) for further details. (Reproduced by kind permission of Dr. S. Linder, Swedish University of Agricultural Sciences, Uppsala, Sweden). (flk_03.jpg)
Spatial Resolution
The total area of the experiment was 8.25 ha. The experimental plots were 50 m x 50 m in size.
Temporal Coverage
Biomass and NPP measurements were made between 1986 and 1996. The initial complete inventory of all plots was carried out in October 1986 before treatments began. Subsequent complete inventories were conducted in 1991 and 1996. Between years of complete inventory, about 100 trees per treatment were measured each autumn, except 1992. Trees for biomass studies were harvested in 1986 and 1992. Samples for nutrient analysis were collected by harvest in 1994 (stem wood) and between 1987/05/19 and 1993/10/28 (foliage). Soil samples are collected in 1986, prior to treatment. Climate data are available from 1991/01/01 through 1995/08/31.
Temporal Resolution
Complete inventories of the plots were conducted three times between 1986 and 1996. Between years of complete inventory, a sample of trees per treatment were measured each autumn, except 1992. Biomass measurements were made twice, once in 1986 and again in 1996. Stem wood was collected once for nutrient analysis. Foliage was collected on eight occasions from 10 trees on each plot for nutrient analysis. Samples from the ten trees were pooled.
All NPP estimates are based on plant dry matter accumulation, expressed as g/m2 (dry matter weight). Stem increment are reported as m3/ha/yr. Leaf Area index (LAI) is reported as m2/m2. Nutrient concentrations in wood and foliage are reported as percent of dry weight. Climate data are expressed as monthly and annual precipitation amounts (mm) and monthly and annual average maximum/minimum temperature (C). Monthly and annual climatic means are provided for the 1991-1994 period because of missing records in 1995.
Data File Information
Table 2. Data files in this data set archive
| FILE NAME | TEMPORAL COVERAGE | FILE CONTENTS |
|---|---|---|
| flk1_npp_r1.txt | 1986/10/01 - 1996/08/15 |
Stand characteristics, above- and below-ground biomass, and above- and below-ground production allocation data for control plots in an established boreal forest at Flakaliden, Sweden |
| flk2_npp_r1.txt | 1986/10/01 - 1996/08/15 |
Stand characteristics, above- and below-ground biomass, and above- and below-ground production allocation data for fertilized/irrigated plots in an established boreal forest at Flakaliden, Sweden |
| flk_cli.txt | 1991/01/01 - 1995/08/31 |
Monthly and annual precipitation amount and mean maximum/minimum temperature data from a weather station located at the Flakaliden study site |
NPP Data
NPP estimates for the Flakaliden sites are provided in two files, one for each treatment (Table 2). The data sets are text files (.txt format). The variable values are delimited by semicolons. The first 18 lines are metadata; data records begin on line 19. The value -999.9 is used to denote missing values. All NPP units are in g/m2/yr (dry matter weight). Stem increment is reported as m3/ha/yr, and LAI is reported as m2/m2. Nutrient concentrations in wood and foliage are reported as percent of dry weight.
Table 3. Column headings in NPP files
| Column Heading | Definition | Units |
|---|---|---|
| Site | Site where data were gathered (code refers to site identification) | Text |
| Treatmt | Study area where measurements were made; treatment of study plots are described in metadata in data files | Text |
| Year | Year in which data were collected | Numeric |
| Month | Month in which data were collected | |
| Day | Day on which data were collected | |
| parameter | Parameters measured (see definitions in Table 3) | Text |
| amount | Data values | Numeric |
| units | Unit of measure | Text |
| References / comments | Primary references plus explanatory comments | Text |
Table 4. Parameter definitions in NPP files
| Parameter | Definition | Units | Source |
|---|---|---|---|
| stand_age | Age of stand when measurements were made; number of years since 4-year-old seedlings of Norway spruce were planted in 1963 | years |
Table 1, Bergh et al. (1999) |
| height | Mean height of trees when measurements were made | cm |
|
| numdensity | Stocking density when measurements were made | trees/ha |
|
| basal_area | Basal area of plot when measurements were made | m2/ha |
|
| volume | Volume of wood when measurements were made; ob = over bark | m3 ob/ha |
|
| wood_density | Wood basic density at breast height in young Norway spruce trees before and after treatment | g/cm3 | Table 2, Bergh et al. (1999) |
| wood-N | Nitrogen concentration in stem wood xylem before and after treatment | percent | Table 1, Stockfors and Linder (1998) |
| needles-N | Nitrogen concentration in foliage before and after treatment; age-class unknown | percent | Linder/McMurtrie, pers. comm. |
| needles-N | Nitrogen concentration in one-year-old foliage before and after treatment | percent | Table 3, Linder (1995) |
| height | Initial height of stands1 | cm | Table 1, Bergh et al. (1998) |
| basal_area | Initial basal area of stands1 | m2/ha | |
| trunks | Initial stemwood biomass in stands1 | g/m2 | |
| branches | Initial branch biomass in stands1 | ||
| needles | Initial needle biomass in stands1 | ||
| roots | Initial root biomass in stands | ||
| AGbiomass | Initial above-ground biomass (sum stemwood + branches + needles) | by addition | |
| Totbiomass | Initial total biomass (above-ground + root biomass) | ||
| LAI_projected | Initial leaf area index (projected)1 | m2/m2 | Table 1, Bergh et al. (1998) |
| LAI_one_sided | Leaf area index of spruce needles2 | Linder, pers. comm.; Table 1, Phillips et al. (2001) | |
| trunk_incr | Annual increment of stem volume of stands with different treatments | m3/ha/year | Figure 3, Bergh et al. (1999) |
| ANPP | Annual above-ground net primary production for stands with different treatments | g/m2/year | Linder/McMurtrie, pers. comm. |
| BNPP | Annual below-ground net primary production for stands with different treatments | ||
| TNPP | Annual total net primary production for stands with different treatments | ||
| soil_C(humus) | Initial carbon content of soil humus layer3 | g/m2 | Linder, pers. comm. |
| soil_C(0-10cm) | Initial carbon content of soil at 0 to 10 cm depth3 | ||
| soil_C(10-20cm) | Initial carbon content of soil at 10 to 20 cm depth3 | ||
| soil_C(20-30cm) | Initial carbon content of soil at 20 to 30 cm depth3 |
Notes: 1Initial stand characteristics were used by BIOMASS process model to simulate annual gross primary production in stands subjected to different treatments. 2At the end of the study, the fertilized/irrigated plots had nearly closed canopies with a leaf area index of > 6 m2/m2, whereas the control plots were more open (LAI ~ 2.0 m2/m2). 3Measurements were made after burning, but before treatment.
Sample NPP Data Record (flk1_npp_r1.txt)
| flk; control; 1986; -999.9; -999.9; stand_age; 27; years Bergh et al. (1999) flk; control; 1986; -999.9; -999.9; height; 282; cm Bergh et al. (1999) flk; control; 1986; -999.9; -999.9; numdensity; 2595; trees/ha Bergh et al. (1999) flk; control; 1986; -999.9; -999.9; basal_area; 2.61; m2/ha Bergh et al. (1999) flk; control; 1986; -999.9; -999.9; volume; 7.34; m3 ob/ha Bergh et al. (1999) ob = over bark ... flk; control; 1991; -999.9; -999.9; ANPP; 117.0; g/m2/year Linder/McMurtrie, pers.comm. flk; control; 1991; -999.9; -999.9; BNPP; 55.0; g/m2/year Linder/McMurtrie, pers.comm. flk; control; 1991; -999.9; -999.9; TNPP; 172.0; g/m2/year Linder/McMurtrie, pers.comm. flk; control; 1992; -999.9; -999.9; ANPP; 129.6; g/m2/year Linder/McMurtrie, pers.comm. flk; control; 1992; -999.9; -999.9; BNPP; 60.4; g/m2/year Linder/McMurtrie, pers.comm. flk; control; 1992; -999.9; -999.9; TNPP; 190.0; g/m2/year Linder/McMurtrie, pers.comm. ... |
Sample NPP Data Record (flk2_npp_r1.txt)
| flk; irr_fert; 1986; -999.9; -999.9; stand_age; 27; years Bergh et al. (1999) flk; irr_fert; 1986; -999.9; -999.9; height; 296; cm Bergh et al. (1999) flk; irr_fert; 1986; -999.9; -999.9; numdensity; 2345; trees/ha Bbrergh et al. (1999) flk; irr_fert; 1986; -999.9; -999.9; basal_area; 2.65; m2/ha Bergh et al. (1999) flk; irr_fert; 1986; -999.9; -999.9; volume; 7.44; m3 ob/ha Bergh et al. (1999) ob = over bark ... flk; irr-fert; 1991; -999.9; -999.9; ANPP; 398.0; g/m2/year Linder/McMurtrie, pers.comm. flk; irr-fert; 1991; -999.9; -999.9; BNPP; 131.0; g/m2/year Linder/McMurtrie, pers.comm. flk; irr-fert; 1991; -999.9; -999.9; TNPP; 529.0; g/m2/year Linder/McMurtrie, pers.comm. flk; irr-fert; 1992; -999.9; -999.9; ANPP; 479.8; g/m2/year Linder/McMurtrie, pers.comm. flk; irr-fert; 1992; -999.9; -999.9; BNPP; 158.2; g/m2/year Linder/McMurtrie, pers.comm. flk; irr-fert; 1992; -999.9; -999.9; TNPP; 638.0; g/m2/year Linder/McMurtrie, pers.comm. ... |
Climate Data. The climate data for the Flakaliden sites are provided in one file (Table 1). The data set is a text file (.txt format). The variable values are delimited by semicolons. The first 18 lines are metadata; data records begin on line 19. The value -999.9 is used to denote missing values.
Sample Climate Data Record
| flk ;mean;prec; 47.4; 17.4; 37.2; 30.1; 41.4; 60.3; 71.1; 75.7; 48.8; 50.3; 57.6; 59.9; 585.6; flk ;mean;tmax; -4.0; -4.7; 0.2; 4.4; 11.8; 16.4; 19.3; 16.7; 10.3; 2.4; -1.7; -1.9; 20.3; flk ;mean;tmin; -10.6; -11.4; -7.3; -4.3; 0.8; 5.8; 8.5; 7.4; 2.2; -3.3; -6.3; -7.3; -13.3; flk ;numb;prec; 5; 5; 5; 5; 5; 5; 5; 5; 4; 4; 4; 4; 4; flk ;numb;tmax; 5; 5; 5; 5; 5; 5; 5; 5; 4; 4; 4; 4; 4; flk ;numb;tmin; 5; 5; 5; 5; 5; 5; 5; 5; 4; 4; 4; 4; 4; flk ;stdv;prec; 4.7; 14.1; 10.1; 22.4; 22.8; 24.6; 47.2; 41.0; 19.0; 10.0; 29.7; 34.1; 117.6; flk ;stdv;tmax; 2.6; 4.2; 1.2; 2.4; 2.9; 2.8; 2.4; 2.1; 1.2; 2.5; 1.6; 1.7; 2.1; flk ;stdv;tmin; 3.6; 5.9; 2.2; 1.3; 2.3; 1.6; 1.0; 0.5; 1.8; 3.0; 1.6; 2.1; 5.4; flk ;1991;prec; 40.3; 13.9; 49.3; 12.7; 66.4; 74.5; 36.0; 50.9; 53.7; 47.0; 62.0; 30.1; 536.8; flk ;1991;tmax; -2.9; -8.2; -0.9; 5.3; 8.5; 14.2; 20.4; 19.1; 10.0; 4.5; 0.5; -1.1; 20.4; flk ;1991;tmin; -9.0; -13.9; -7.3; -3.8; 0.2; 5.3; 9.6; 8.3; 1.2; -0.8; -4.2; -6.5; -13.9; … Where, Temp (temporal) - specific year or long-term statistic: mean = mean based on all years numb = number of years stdv = standard deviation based on all years Parm (parameter): prec = precipitation for month or year (mm) tmax = mean maximum temperature for month or year (C) tmin = mean minimum temperature for month or year (C) |
3. Data Application and Derivation:
The accumulation of biomass, or NPP, is the net gain of carbon by photosynthesis that remains after plant respiration. While there are many fates for this carbon, this data set accounts for above- and below-ground growth.
Productivity of a boreal coniferous forest was determined at the Flakaliden experimental site for a yield optimization study, beginning in 1986. The principal aim was to determine the potential yield of a young stand of Norway spruce Picea abies, under given climatic conditions, non-limiting soil water, and optimal nutritional status without leaching to groundwater. This data set provides the results for two of the four treatments applied to the Flakaliden sites (daily fertilization/irrigation during the growing season and control or no treatment) .
There was a fast response to fertilization in the stands at Flakaliden. After 3 years of treatment, both height and diameter growth in the fertilized/irrigated stand had doubled in comparison to the non-fertilized/non-irrigated (control) stand. The difference in height and diameter growth between the treatments remained at a similar level during the entire period of study, but the difference in volume growth continued to increase with time. After 10 years of treatment, the volume growth in the fertilized/irrigated stand was almost four times higher than that in the stand without fertilization or irrigation (control plot), and standing volume had almost tripled. Mortality was low (<0.2%) during the studied period, and was mainly caused by suppressed trees being broken by heavy loads of snow.
The biomass dynamics data for the stands at Flakaliden are provided for comparison with models and estimation of NPP. Climate data are provided for use in driving ecosystem/NPP models.
4. Quality Assessment:
There was a strong and significant increase in volume yield at Flakaliden, confirming earlier findings that nutrient availability is a major constraint on forest production in Sweden (Tamm, 1991).
Sources of Error
Information not available.
5. Data Acquisition Materials and Methods:
Treatments
An "optimal" nutritional status to be attained in the foliage of the trees was defined in terms of target needle concentrations for each individual nutrient element. The initial target values for macro-nutrients were derived from studies of "optimal" nutrition of Norway spruce in laboratory and field experiments. The amount and composition of the nutrient solution and fertilizer mix were determined each year. The decision was based on nutrient analysis of foliage and monitoring of nutrients in the soil water, collected by means of suction lysimeters. The amount of irrigation needed was determined in relation to the amount of available water in the rooting zone (0-40 cm), as measured by tensiometers. The target was to maintain soil water between field capacity and a maximum deficit of 10 mm of water. For further details regarding the treatments, see Linder (1995).
Measurements and Growth Estimates
At Flakaliden, complete inventories were carried out in 1986, 1991, and 1996, where DBH and height of every tree on the subplots was measured (ca. 8,000 trees). Between years of complete inventory, DBH and height of (ca.) 100 trees per treatment were measured each autumn, except 1992. These measurements, which were used to estimate the annual development of height, DBH, basal area and volume, were later "corrected" against the results of the complete inventories. Different volume functions were used for estimating the volume growth of individual trees, depending on tree size and on the geographical location of the site.
Trees for biomass studies were harvested at Flakaliden in 1986 and 1992. Twelve trees per treatment, covering the range of tree sizes, were harvested and processed. The sampling procedure was described in detail by Flower-Ellis (1996). The stems from the harvest in 1992 were divided into five sections, each represented by a disk. The volume of each section was estimated by Smalian's formula (Smalian, 1840). Disks taken at breast height were used to determine wood basic density. Each disk was divided into two parts, the inner part representing wood formed before, and the outer wood formed after, the start of treatment. The basic density of the wood samples was determined by a water displacement method described by Olesen (1971).
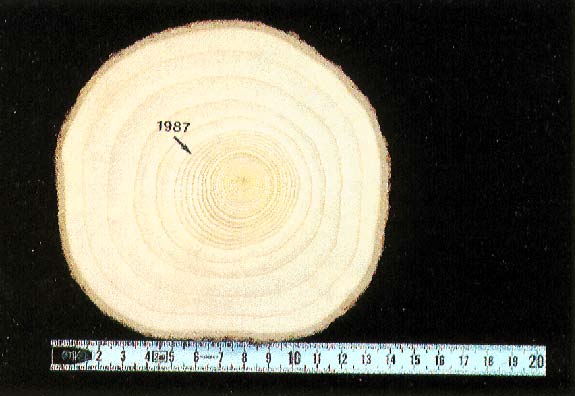
Figure 4. Cross-section of trunk of Picea abies from the fertilized and irrigated (IL) treatment at the Flakaliden study site, Sweden. (Note the dramatic increase in width of annual growth rings after commencement of the treatment, although little increase can be discerned in the first year, 1987. Ruler is in centimeters. Photograph taken 1992; reproduced by kind permission of Dr. S. Linder, Swedish University of Agricultural Sciences, Uppsala.) (flk_04.jpg)
Leaf Area
The estimates of leaf area in the stands are based on biomass harvests, on three occasions at 5-year intervals, together with in situ measurements of leaf area for each plot. Annual values of leaf area were estimated from regressions derived from the biomass harvest and measurements of diameter and leaf area for all the different plots (Bergh et al., 2005).
Nitrogen Concentration in Stemwood (Stockfors and Linder (1998)
To determine internal structure and stem [N], trees were harvested at the end of the 1994 growing season and three discs were taken from the stem, directly above and below as well as in the middle of the area. The discs were stored at -20 C until further processing. to determine nitrogen concentration, sections of the discs were separated into xylem and phloem and dried in a ventilated oven (85 C, 48 h). Total nitrogen was determined with an elemental combustion analyzer. The results for stemwood xylem samples are presented in this data set.
Nitrogen Concentration in Foliage (Linder, 1995)
Following a complete inventory of all plots (> 18,000 trees), and detailed structural analysis of 32 trees in October 1986, four height classes of tree were selected for serial branch sampling in fertilized/irrigated and control plots. The sample trees were distributed over all replicate plots of the treatments so that every plot had approximately the same number. In total 70 trees per treatment were utilized. Ten of those, selected across replicates, were sampled on each occasion, and the same group of trees was used only once a year. A detailed description of the selection of sample trees, branch sampling, and sub sequent growth analysis has been given by Flower-Ellis (1993). To cover the snow-free season (c. May-October) adequately, it was estimated that seven sampling occasions would be needed. These were concentrated to the period of most active growth, with longer intervals at the beginning and end of the season. From the end of April 1987, serial branch samples were collected from whorls 4, 7 and 10 (counted from the top) on every occasion. During the winter of 1991/92 an extra five sampling occasions were included. The sample branches were dissected by age-classes and orders before being frozen (-20 C) to await further processing. Subsamples to be used for nutrient analysis were immediately immersed in liquid nitrogen before being stored at -20 C until analysed. The subsamples were dried in a ventilated oven (85 C, 48 h), then separated into the fractions needles and shoot axes, which were counted and measured. The fractions were pooled by age-classes within treatments. The effect of between-tree variation was reduced by pooling the samples from ten trees. For the diagnostic nutrient analysis, needles from second-order shoots from the 4th whorl, were used. After milling to pass a 0.12 mm sieve, the material was dried under vacuum before being analysed. Three age-classes of needle (C: current; C+l: one-year-old; C+2: two-year old) were analyzed on each occasion. The results for one-year-old needles are presented in this data set. Total nitrogen (N) was analysed with an elemental combustion analyzer.
Climate
Climate was monitored at the site over the course of the experiment using a standard weather station. Hourly values were calculated and stored. Measurements included precipitation amount and maximum/minimum temperature. Monthly and annual means are reported in the climate file for the 1991-1994 period.
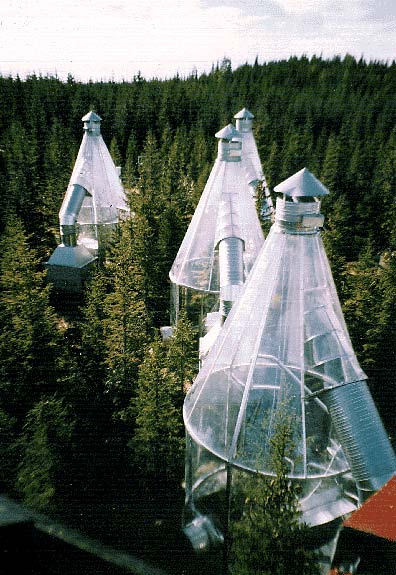
Figure 5. Whole tree chambers containing Picea abies at the Flakaliden study site, Sweden. (Experiment to study the effects of elevated CO2 and increased temperature. Note: data from the tree chambers are not included in this data set. Photograph taken August 1996 by Jan Parsby, Swedish University of Agricultural Sciences, Uppsala.) (flk_05.jpg)
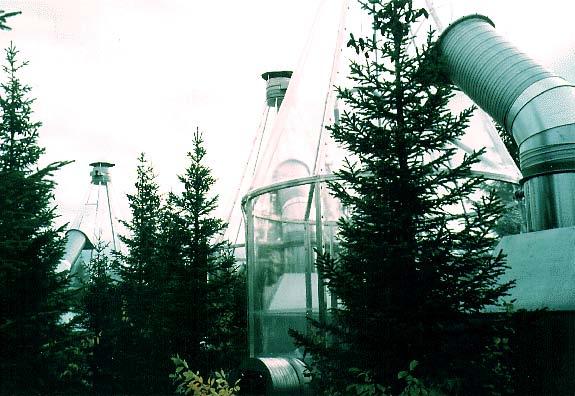
Figure 6. Another view of whole tree chambers at the Flakaliden study site, Sweden. (Experiment to study the effects of elevated CO2 and increased temperature. Note: data from the tree chambers are not included in this data set. Photograph taken 1996 by Dr. S. Linder, Swedish University of Agricultural Sciences, Uppsala.) (flk_06.jpg)
6. Data Access:
This data is available through the Oak Ridge National Laboratory (ORNL) Distributed Active Archive Center (DAAC).
Data Archive Center:
Contact for Data Center Access Information:
E-mail: uso@daac.ornl.gov
Telephone: +1 (865) 241-3952
7. References:
Bergh, J. .1997. Climatic and Nutritional Constraints to Productivity in Norway Spruce. Acta Universitatis Agriculturae Sueciae, Silvestria 37. Ph.D. thesis, Swedish University of Agricultural Sciences, Uppsala. ISSN 1401-6230, ISBN 91-576-5321-6.
Bergh, J., S. Linder, and J. Bergstrom. 2005. Potential production of Norway spruce in Sweden. Forest Ecology and Management 204: 1-10
Bergh, J., S. Linder, T. Lundmark, and B. Elfving. 1999. The effect of water and nutrient availability on the productivity of Norway spruce in northern and southern Sweden. Forest Ecology and Management 119: 51-62.
Bergh, J., R.E. McMurtrie, and S. Linder. 1998. Climatic factors controlling the productivity of Norway spruce: a model-based analysis. Forest Ecology and Management 110: 127-139.
Linder, S. 1995. Foliar analysis for detecting and correcting nutrient imbalances in Norway spruce. Ecological Bulletins (Copenhagen) 44, 178-190.
Olson, R.J., K.R. Johnson, D.L. Zheng, and J.M.O. Scurlock. 2001. Global and Regional Ecosystem Modeling: Databases of Model Drivers and Validation Measurements. ORNL Technical Memorandum TM-2001/196. Oak Ridge National Laboratory, Oak Ridge, Tennessee, USA
Phillips, N., J. Bergh, R. Oren, and S. Linder. 2001. Effects of nutrition and soil water availability on water use in a Norway spruce stand. Tree Physiology 21: 851-860.
Stockfors, J., and S. Linder. 1998. Effect of nitrogen on the seasonal course of growth and maintenance respiration in stems of Norway spruce trees. Tree Physiology 18: 155-166.
Additional Sources of Information:
Flower-Ellis, J.G.K. 1996. Crown structure and phytomass distribution in Scots pine and Norway spruce trees: 1. Computer-based field sampling routines. Swed. Univ. Agric. Sci., Department for Production Ecology, Report 2, 79 pp.
Gower, S.T., O. Krankina, R.J. Olson, M. Apps, S. Linder, and C. Wang. 2001. Net Primary Production and Carbon Allocation Patterns of Boreal Forest Ecosystems. Ecological Applications. 11:1395-1411.
Gower, S.T., O. Krankina, R.J. Olson, M. Apps, S. Linder, and C. Wang. 2012. NPP Boreal Forest: Consistent Worldwide Site Estimates, 1965-1995, R[evision]1. Data set. Available on-line [http://daac.ornl.gov] from the Oak Ridge National Laboratory Distributed Active Archive Center, Oak Ridge, Tennessee, USA doi:10.3334/ORNLDAAC/611
Olesen, P.O. 1971. The water displacement method a fast and accurate method of determining the green volume of wood samples. Forest Tree Improvement, Arboretet, Hùrsholm, Denmark, 23 pp.
Olson, R.J., J.M.O. Scurlock, S.D. Prince, D.L. Zheng, and K.R. Johnson (eds.). 2012a. NPP Multi-Biome: Global Primary Production Data Initiative Products, R2. Data set. Available on-line [http://daac.ornl.gov] from the Oak Ridge National Laboratory Distributed Active Archive Center, Oak Ridge, Tennessee, USA doi:10.3334/ORNLDAAC/617
Olson, R.J., J.M.O. Scurlock, S.D. Prince, D.L. Zheng, and K.R. Johnson (eds.). 2012b. NPP Multi-Biome: NPP and Driver Data for Ecosystem Model-Data Intercomparison, R2. Data set. Available on-line [http://daac.ornl.gov] from the Oak Ridge National Laboratory Distributed Active Archive Center, Oak Ridge, Tennessee, USA doi:10.3334/ORNLDAAC/615
Scurlock, J.M.O., and R.J. Olson. 2002. Terrestrial net primary productivity - A brief history and a new worldwide database. Environ. Rev. 10(2): 91-109. doi:10.1139/a02-002
Scurlock, J.M.O., and R.J. Olson. 2012. NPP Multi-Biome: Grassland, Boreal Forest, and Tropical Forest Sites, 1939-1996, R1. Data set. Available on-line [http://daac.ornl.gov] from Oak Ridge National Laboratory Distributed Active Archive Center, Oak Ridge, Tennessee, USA doi:10.3334/ORNLDAAC/653
Smalian, H.L. 1840. BaumhoÈhemesser und einfaches Verfahren der Baummessung und Holzberechnung fuÈ r ForstmaÈnner, Bauherrn und HolzhaÈndler, Stralsund (Monograph in German).
Tamm, C.O., 1991. Nitrogen in Terrestrial Ecosystems, Questions of Productivity, Vegetational Changes and Ecosystem Stability. Ecological Studies 81, Springer, Berlin, 115 pp.
8. Data Set Revisions:
Revision Summary:
NPP data files, flk1_npp.txt (control plots) and flk2_npp.txt (fertilized/irrigated plots), associated with the yield optimization study at the Flakaliden boreal forest in Sweden, have been revised. The year when stemwood was harvested for nutrient analysis after treatment began at the experimental sites has been corrected to agree with that reported in Stockfors and Linder (1998). Additional data for foliage nitrogen content from Linder (1995) and LAI data from Phillips et al. (2001) have been added to both data files.
All other values in the data files are consistent with published sources.
Data File Changes:
The year when stem wood was harvested for nutrient analysis after treatment began in the data files, flk1_npp.txt and flk2_npp.txt, has been corrected to agree with that reported on Page 157 in Stockfors and Linder (1998).
| Parameter Field* | Uncorrected in flk1_npp.txt and flk2_npp.txt | Corrected in flk1_npp_r1.txt and flk2_npp_r1.txt |
|---|---|---|
| wood-N | 1992 | 1994 |
A time series for nitrogen concentrations in one-year-old needles for the control and fertilized/irrigated plots from Table 3 in Linder (1995) has been added to the data files.
| Parameter Field* | Sampling Date | Control plots (flk1_npp_r1.txt) | Fertilized/irrigated plots (flk2_npp_r1.txt) |
|---|---|---|---|
| nitrogen concentration in one-year-old needles (%) | |||
| needles-N | 1987/05/19 | 1.04 | 1.08 |
| 1987/09/15 | 1.00 | 1.44 | |
| 1988/09/20 | 1.01 | 1.66 | |
| 1989/10/04 | 1.05 | 1.84 | |
| 1990/10/04 | 1.03 | 1.56 | |
| 1991/10/07 | 1.08 | 1.44 | |
| 1992/10/27 | 0.99 | 1.33 | |
| 1993/09/28 | 1.04 | NA | |
| 1993/10/28 | NA | 1.54 | |
Leaf area index for 1996 for the control and fertilized/irrigated plots from Table 1 in Phillips et al. (2001) has been added to the data files.
| Parameter Field* | Uncorrected in flk1_npp.txt and flk2_npp.txt | Control plot (flk1_npp_r1.txt) | Fertilized/irrigated plots (flk2_npp_r1.txt) |
|---|---|---|---|
| LAI_one_sided (1996) | NR | 2.20 m2/m2 | 6.80 m2/m2 |
NA = Not available. NR = Not reported. *See data set Guide document for parameter definitions.
The data values in flk1_npp_r1.txt and flk2_npp_r1.txtare now correct.
Data User Action: If you downloaded the referenced data set from the ORNL DAAC on-line archive before July 15, 2013, you should download it again from the ORNL DAAC.
Revision History:
Original Citation
Linder, S. 1998. NPP Boreal Forest: Flakaliden, Sweden, 1986-1996. Data set. Available on-line [http://daac.ornl.gov] from Oak Ridge National Laboratory Distributed Active Archive Center, Oak Ridge, Tennessee, USA