Get Data
Summary:
This NPP data set provides one data file (.txt format). The data are above-and below-ground biomass, litterfall, leaf area index (LAI), vegetation/soil micro-nutrient content (P, K, Ca, Mg, etc.), and above-ground net primary productivity (ANPP) estimates for transitional moist/dry tropical forests at Rio Lara (wet season site) and Rio Sabana (dry season site) in Darien Province, Panama. Both plots were considered representative of the surrounding forest. The area was thought to have been forested for the previous 400 years, following abandonment of open savanna lands maintained by the Precolumbian Indians. Field measurements were made in 1967 and 1968. No climate data are provided.
Total annual leaf and branch fall averaged for the two sites was 1,137 g/m2/yr, representing a minimum ANPP estimate. Litter decomposition over the 9-month wet season was around 90%. LAI at both sites was high; however, the index for the dry site (10.6 m2/m2) was only half that of the wet season site (22.4 m2/m2). Apart from litter quantity, most of the differences between the respective site measurements reflect variations between the plots.
Revision Notes: The NPP data file has been revised to identify sub-site locations in the Treatment column, correct understory biomass estimates for both sites, and add LAI data. Please see the Data Set Revisions section of this document for detailed inforamation.
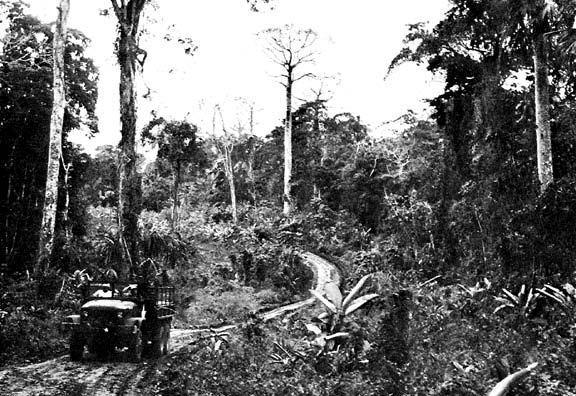
Figure 1. Tropical moist forest near Santa Fe, in the vicinity of the Darien study site, Panama. (The trees without leaves are emergent cuipo. Photograph taken February 1967 by G. Child. Reproduced by kind permission of F.B. Golley and the University of Georgia Press).
Additional Documentation:
The NPP data collection contains field measurements of biomass, estimated NPP, and climate data for terrestrial grassland, tropical forest, boreal forest, and tundra sites worldwide. Data were compiled from the published literature for intensively studied and well-documented individual field sites and from a number of previously compiled multi-site, multi-biome data sets of georeferenced NPP estimates. The principal compilation effort (Olson et al., 2001) was sponsored by the NASA Terrestrial Ecology Program. For more information, please visit the NPP web site at http://daac.ornl.gov/NPP/npp_home.html.
Data Citation:
Cite this data set as follows:
Golley, F.B. 2013. NPP Tropical Forest: Darien, Panama, 1967-1968 R1. Data set. Available on-line [http://daac.ornl.gov] from Oak Ridge National Laboratory Distributed Active Archive Center, Oak Ridge, Tennessee, USA. doi:10.3334/ORNLDAAC/215
This data set was originally published as:
Golley, F.B. 1998. NPP Tropical Forest: Darien, Panama, 1967-1968.
Data set. Available on-line [http://daac.ornl.gov] from Oak Ridge
National Laboratory Distributed Active Archive Center, Oak Ridge,
Tennessee, U.S.A.
Table of Contents:
- 1 Data Set Overview
- 2 Data Description
- 3 Applications and Derivation
- 4 Quality Assessment
- 5 Acquisition Materials and Methods
- 6 Data Access
- 7 References
- 8 Data Set Revisions
1. Data Set Overview:
Project: Net Primary Productivity (NPP)
The NPP measurement presented here is the sum of total annual leaf and branch fall in 1967-68 at Darien Province, Panama. Above- and below-ground biomass and nutrient content of different vegetation components and soils for a transitional moist/dry tropical forest were also determined.
Biomass and micro-nutrient content (P, K, Ca, Mg, etc.) of stems and leaves of overstory and understory, wood of branches and trunk, fruit/flowers, dead wood, and litter were measured in the dry season (February) and the wet season (September). Leaf and wood litterfall was measured bi-monthly during the dry season for one year. Apart from litter quantity, most of the differences between these data reflect variation between the two plots sampled, rather than seasonal changes.
Total annual leaf and branch fall averaged for the two sites was 1,137 g/m2/yr, giving a minimum estimate of ANPP (Golley et al., 1975; Olson et al., 2013a, b; Scurlock and Olson, 2012). Clark et al. (2001a, 2013) report ANPP estimates of 1,050 g/m2/yr for the Rio Lara site and 1,160 g/m2/yr for the Rio Sabana site. Litter decomposition over the 9-month wet season was around 90%.
2. Data Description:
Spatial Coverage
Site: Darien, Panama
Site Boundaries: (All latitude and longitude given in decimal degrees)
| Site (Region) | Westernmost Longitude | Easternmost Longitude | Northernmost Latitude | Southernmost Latitude | Elevation (m) |
|---|---|---|---|---|---|
| Rio Sabana | -78.12 | -78.12 | 8.68 | 8.68 | 250 |
| Rio Lara | -78.13 | -78.13 | 8.63 | 8.63 | < 250 |
Each study area contained of a 0.25-ha clear-cut vegetation harvest plot with ten 1.0-m2 subplots for root extraction (to 0.3 m depth), ten 1.0-m2 litter collection subplots, ten 1.0-m2 fine litterfall traps, and ten 2.0 x 2.0-m branch fall subplots. LAI was measured from harvested leaves. Soil was sampled to 91 cm deep in two soil pits at each site.
Temporal Coverage
Above-and below-ground biomass and standing litter crop measurements were made in February 1967 at the Rio Sabana site (dry season) and in September 1967 at the Rio Lara site (wet season). Measurements of standing litter crop biomass were repeated in February 1968 at the Rio Sabana site. Litterfall was collected from May 2, 1967 through February 27, 1968 at the Rio Sabana site. Climate data are not available.
Temporal Resolution
Above-and below-ground biomass measurements were made once. Standing litter crop biomass measurements were made twice, one year apart. Litterfall biomass measurements were made bi-monthly.
Above-and below-ground biomass and ANPP estimates are based on plant dry matter accumulation, expressed as g/m2 and g/m2/yr (dry matter weight), respectively. LAI is expressed as m2 /m2. Micro-nutrient content of vegetation and soils is expressed as parts per million (ppm).
Data File Information
Table 1. Data files in this data set archive
| FILE NAME | TEMPORAL COVERAGE | FILE CONTENTS |
|---|---|---|
| drn_npp_r1.txt | 1967/02/02-1968/02/27 | LAI, above- and below ground biomass, nutrient content, litter standing crop, litterfall, and ANPP data for wet and dry seasons at Darien, Panama |
NPP Data. NPP estimates for the Rio Sabana and Rio Lara sites are provided in one text file (.txt) (Table 1). The variable values are delimited by semicolons. The first 18 lines are metadata; data records begin on line 19. The value -999.9 is used to denote missing data. Above-and below-ground biomass and ANPP estimates are based on plant dry matter accumulation, expressed as g/m2 and g/m2/yr (dry matter weight), respectively.
Table 2. Column headings in NPP file
| COLUMN HEADING | DEFINITION | UNITS |
|---|---|---|
| Site | Site where data were gathered (code refers to site identification) | Text |
| Treatmt | Sub-site where measurements were made (dry refers to Rio Sabana site measurements during the dry season; wet refers to Rio Lara site measurements during the wet season) | |
| Year | Year in which data were collected | Numeric |
| Month | Month in which data were collected | |
| Day | Day on which data were collected | |
| parameter | Parameters measured (see definitions in Table 3) | Text |
| amount | Data values | Numeric |
| units | Unit of measure | Text |
Table 3. Parameter definitions in NPP file
| PARAMETER | DEFINITION | UNITS | SOURCE |
|---|---|---|---|
| LAI | Leaf area index | m2/m2 | p. 291 |
| leaves | Biomass of harvested overstory leaves | g/m2 | Table 2.31 and Table 12 |
| branches + trunks | Biomass of tree branches and stems | ||
| frtflowr | Biomass of overstory epiphytes, fruit, and flowers | ||
| Unstory | Biomass of harvested understory vegetation (< 2 m height) | ||
| AGbiomass | Total above-ground biomass | ||
| Totroots | Biomass of excavated roots > 0.05 mm (to a depth of 0.3 m) | ||
| Totbiomass | Total biomass (above-ground + below-ground biomass) | ||
| Totlitter | Standing crop of litter (leaves, twigs, stem material, fruits, and flowers) at each site in 1967 | ||
| deadwood | Standing crop of dead branches and stems | g/m2 | |
| soil-P | Phosphorus concentration in soils (0-91 cm depth) | ppm | Table 2.121 |
| soil-K | Potassium concentration in soils (0-91 cm depth) | ppm | |
| Totlitter | Standing crop of litter (leaves, twigs, stem material, fruits, and flowers) at Rio Sabana in 1968 | g/m2 | p. 691 |
| leaves-P | Phosphorus concentration in leaves | ppm | Table 2.10 (Rio Lara) and Table 2.11 (Rio Sabana)1 |
| branches + trunks-P | Phosphorus concentration in tree branches and trunks | ||
| Totroots-P | Phosphorus concentration in roots | ||
| Totlitter-P | Phosphorus concentration in litter on forest floor | ||
| leaves-K | Potassium concentration in leaves | ppm | Table 2.10 (Rio Lara) and Table 2.11 (Rio Sabana)1 |
| branches + trunks-K | Potassium concentration in tree branches and trunks | ||
| Totroots-K | Potassium concentration in roots | ||
| Totlitter-K | Potassium concentration in litter on forest floor | ||
| leaflittfall | Bi-monthly fine litterfall amount (leaves, small twigs, fruits, and flowers) at Rio Sabana | g/m2 | Tables 3.1 and 3.2, and text, p. 692 |
| woodlittfall | Bi-monthly branch litterfall amount (woody material > 2 cm diameter) at Rio Sabana | ||
| leaflittfall | Annual fine litterfall rate (leaves, small twigs, fruits, and flowers) at Rio Sabana | g/m2/year | |
| woodlittfall | Annual branch litterfall rate (woody material > 2 cm diameter) at Rio Sabana | ||
| Totlittfall | Total annual litterfall rate (fine + branch) at Rio Sabana |
Notes: 1Golley et al. (1975). 2Golley et al. (1969).
Sample NPP Data Record
|
Site; Treatmt; Year; Month; Day; parameter; amount; units drn; dry; 1967; 2; -999.9; leaves; 735; g/m2 drn; dry; 1967; 2; -999.9; branches_+_trunks; 25213; g/m2 drn; dry; 1967; 2; -999.9; frtflowr; 1; g/m2 drn; dry; 1967; 2; -999.9; Undstory; 401.5; g/m2 drn; dry; 1967; 2; -999.9; AGbiomass; 26350; g/m2 drn; dry; 1967; 2; -999.9; Totroots; 1263; g/m2 drn; dry; 1967; 2; -999.9; Totbiomass; 27613; g/m2 ... |
3. Data Application and Derivation:
The accumulation of biomass, or NPP, is the net gain of carbon by photosynthesis that remains after plant respiration. This data set accounts for total annual leaf and branch fall, giving a minimum estimate of above-ground NPP.
This study was undertaken primarily to assess the transfer of micro-nutrients between structural compartments in the tropical moist forest at Darien. The combination of litterfall, rainfall, chemical content of rain water and river water draining the forest system, and the standing nutrient data permitted the calculation of transfers and losses and completed the description of mineral cycling in the forest.
4. Quality Assessment:
The pattern of litterfall input for the tropical moist forest at Darien is similar to that observed in Colombian and African tropical moist forests (Table 3.2 in Golley et al., 1975).
Comparison of the forest biomass at Darien with that of several other tropical moist forests indicates that the Darien forest does not exhibit unusual weights of leaves, stems, understory, or litter. However, the estimates of root biomass appear low. The investigators suspect their underestimate was due to missing the tap roots and the root crowns directly beneath the stumps.
Comparison of the micro-nutrient inventory in the vegetation and the soils at the two Darien sites suggests there is a large site or seasonal effect on the chemical content of the forest (Golley et al., 1975).
The LAI value for the wet season plot is unusually high. However, there have been high values of LAI reported for other vegetation elsewhere (12 to 28 m2/m2) (Golley et al., 1975).
Sources of Error
Information not available.
5. Data Acquisition Materials and Methods:
Site Information
The Darien Province of Panama is characterized as a broad, flat valley bisected by the Chucunaque and tributary rivers, with the Caribbean coastal mountains on the east and a low Pacific coastal range on the west. Tropical moist forests covered over 75% of this total land area at the time of this study. The most prominent features of the vegetation type were the emergent deciduous trees, the cuipo (Cavanillesia plantifolia) and the bongo (Ceiba pentandra), both of which lose their leaves during the dry period of January to April. These two species reached a height of 20 to 50-m, emerging above an irregular canopy of evergreen trees and palms. Leaf-fall was greatest at the onset of the dry season.
Evidence seems to show that the forests studied at Darien were about 400 years old at the time of this study. They replaced open savanna lands maintained by Precolumbian Indians. The authors of this study called this forest "tropical moist" forest after the Holdridge system, but recognized that it may be a transition between tropical dry and moist forest.
The climate of Darien is characterized by a well marked dry season. Rain falls during eight to nine months (May to December), for a total annual rainfall amount of approximately 2,000 mm. The temperature remains relatively constant throughout the year, with a mean annual temperature of about 25 degrees C (Golley et al., 1975).
The parent material of the soils in the area of interest was a shale which included interbeds of dolomite and calcareous sandstone. Petrographic analysis of the calcareous shale at Rio Lara showed it was made of 65% clay, 25% calcite quartz, and 15% feldspar, collophane, and organic matter.
The structure, species composition, and ecological of the dynamics tropical moist forest at Darien is characterized by the response of emergent trees to the wet-dry climatic regime. Therefore, it was desirable to sample in both seasons; this was accomplished in February (dry season) at Rio Sabana (8.68 N, 78.12 W) and September (wet season) at Rio Lara (8.63 N, 78.13 W) since the former was inaccessible in the wet season. Although Rio Lara had a higher numerical density and basal area of trees (45.2 m2/ha) than Rio Sabana (26.4 m2/ha), both plots were considered representative of the surrounding forest based on their topography, number of tree strata, and presence of conspicuous species. The study sites were about 8 km apart, some 160-km ESE of Panama City and close to the town of Santa Fe.
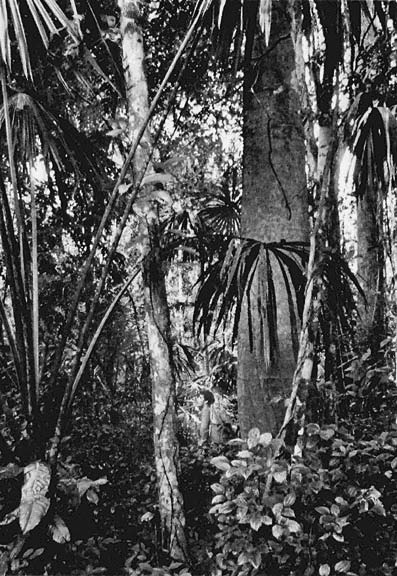
Figure 2. Interior view of the tropical moist forest at the Darien study site, Panama. (Note the large bole of an emergent cuipo [Cavanillesia plantanifolia] and the guagara palm [Sabal allenii]. Photograph by F. B. Golley, University of Georgia, and co-authors. Reproduced by kind permission of F.B. Golley and the University of Georgia Press).
Spatial Resolution
Leaf Area Index
The leaf surface (LAI) was determined by selecting 100 leaves at random from the piles of harvested leaves (see below), weighing them, and outlining each on a piece of graph paper. The paper outlines were cut and weighed and the weights converted to surface area. The average surface area per gram of leaf as multiplied by the total weight of leaves on the plot to estimate the LAI of the forest.
Forest Biomass
Above-ground vegetation was harvested from 0.25-ha plots at each site. All plants under 2 m height (understory) were cut to ground level. Leaves, fruits, and flowers were separated from stems and each weighed separately. Then the diameter at breast height of all the remaining stems was determined. Next, samples of the overstory were taken from the distribution of tree diameters. All trees < 10-cm were harvested and components parts weighed. Ten percent of trees and palms in seven other size categories were harvested. Volumes were calculated based on diameter and length measurements and converted to weight. See Golley et al. (1975) for details. Roots (> 0.05-mm) were sampled from ten 1.0-m2 subplots to a depth of 0.3 m. Soil was sampled to 91-cm depth in two soil pits. Samples were taken from the harvested material, dried at 100 degrees C to constant weight, and weighed.
Chemical Content of the Forest
The quantity of various elements (N, P, K, Ca, etc) in a given quantity of plant material was determined from harvested samples. Eight samples of plant material weighing about 500 g were collected from each component (leaves, stems, etc), dried at 100 degrees C to constant weight, ground in a Wiley Mill, and analyzed for element content by standard laboratory methods. These concentrations were then multiplied by the biomass to give the chemical inventory of a representative area of forest. The chemical concentrations in soils were determined by atomic absorption spectrophotometry.
Forest Litter and Litterfall
Litter on the forest floor (leaves, twigs, stem material, fruits, and flowers) was collected from ten 1.0-m2 subplots before the harvest of each site. A second sample from ten subplots was taken at the same location one year later to determine change in standing litter crop from one year to the next. Fine litterfall (leaves, small twigs, fruits, and flowers) was collected bi-monthly from ten 1.0-m2 litter traps, dried, and ground for chemical analysis. Branch fall material > 2-cm diameter was collected bi-monthly from 2.0 x 2.0-m ground plots. Samples were taken for dry weight and chemical analysis.
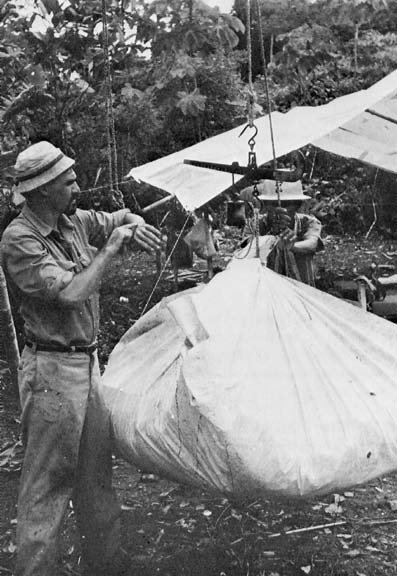
Figure 3. Weighing leaf material in the forest at the Darien study site, Panama. (In the foreground is Jack Ewel, University of Florida, who has provided data on second-growth biomass. Photograph by F. B. Golley, University of Georgia, and co-authors. Reproduced by kind permission of F.B. Golley and the University of Georgia Press).
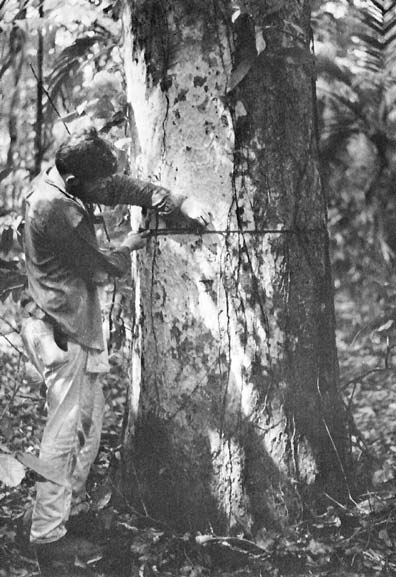
Figure 4. Measurement of tree diameter for construction of the diameter profile for the study plots at the Darien study site, Panama. Photograph by F.B. Golley, University of Georgia, and co-authors. Reproduced by kind permission of F.B. Golley and the University of Georgia Press).
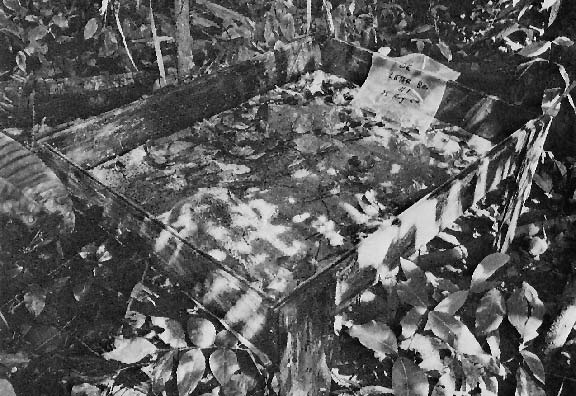
Figure 5. A litter collection box in the forest at the Darien study site, Panama. (The box is approximately one meter square and is held 20 cm above the forest floor by wooden legs. Photograph by F.B. Golley, University of Georgia, and co-authors. Reproduced by kind permission of F.B. Golley and the University of Georgia Press).
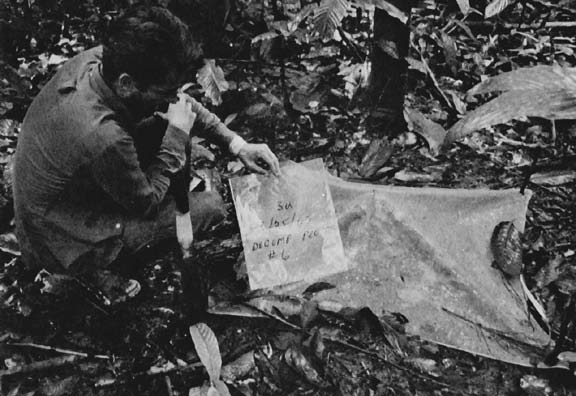
Figure 6. A litter decomposition plot at the Darien tropical moist forest site, Panama. (A fiberglass screen was held above the plot to prevent addition of falling litter. Plots were one meter square in size. Photograph by F.B. Golley, University of Georgia, and co-authors. Reproduced by kind permission of F.B. Golley and the University of Georgia Press).
6. Data Access:
This data set is available through the Oak Ridge National Laboratory (ORNL) Distributed Active Archive Center (DAAC).
Data Archive:
Web Site: http://daac.ornl.gov
Contact for Data Center Access Information:
E-mail: uso@daac.ornl.gov
Telephone: +1 (865) 241-3952
7. References:
Golley, F.B., J.T. McGinnis, R.G. Clements, G.I. Child, and M.J. Duever. 1969. The structure of tropical forests in Panama and Colombia. BioScience 19: 693-696.
Golley, F.B., J.T. McGinnis, R.G. Clements, G.I. Child, and M.J. Duever. 1975. Mineral Cycling in a Tropical Moist Forest Ecosystem. University of Georgia Press, Athens. 248 pp.
Olson, R.J., K.R. Johnson, D.L. Zheng, and J.M.O. Scurlock. 2001. Global and Regional Ecosystem Modeling: Databases of Model Drivers and Validation Measurements. ORNL Technical Memorandum TM-2001/196. Oak Ridge National Laboratory, Oak Ridge, Tennessee, U.S.A.
Additional Sources of Information:
Clark, D.A., S. Brown, D.W. Kicklighter, J Q. Chambers, J R. Thomlinson, J. Ni, and E. A. Holland. 2001a. Net primary production in tropical forests: an evaluation and synthesis of existing field data. Ecological Applications, 11(2): 371-384.
Clark, D.A., S. Brown, D.W. Kicklighter, J.Q. Chambers, J.R. Thomlinson, J. Ni, and E.A. Holland. 2013. NPP Tropical Forest: Consistent Worldwide Site Estimates, 1967-1999. Data set. Available on-line [http://daac.ornl.gov] from the Oak Ridge National Laboratory Distributed Active Archive Center, Oak Ridge, Tennessee, USA. doi:10.3334/ORNLDAAC/616
Ewel, J.J. 1971. Biomass changes in early tropical successon. Turrialba 21: 110-112.
Golley, F.B., J.T. McGinnis, and R.G. Clements. 1973. La biomasa y la estructura mineral de algunos bosques de Darien, Panama. Turrialba 21: 189-196.
Lieth, H. 1975. Modeling the primary productivity of the world, pp 237-263. In: Lieth, H., and R.H. Whittaker (eds.). Primary Productivity of the Biosphere. Springer-Verlag, New York, New York, USA.
Olson, R.J., J.M.O. Scurlock, S.D. Prince, D.L. Zheng, and K.R. Johnson (eds.). 2013a. NPP Multi-Biome: Global Primary Production Data Initiative Products, R2. Data set. Available on-line [http://daac.ornl.gov] from the Oak Ridge National Laboratory Distributed Active Archive Center, Oak Ridge, Tennessee, USA. doi:10.3334/ORNLDAAC/617
Olson, R.J., J.M.O. Scurlock, S.D. Prince, D.L. Zheng, and K.R. Johnson (eds.). 2013b. NPP Multi-Biome: NPP and Driver Data for Ecosystem Model-Data Intercomparison, R2. Data set. Available on-line [http://daac.ornl.gov] from the Oak Ridge National Laboratory Distributed Active Archive Center, Oak Ridge, Tennessee, USA. doi:10.3334/ORNLDAAC/615
Rzedowski, J. 1978. Vegetacion de Mexico. Limusa, Mexico, D.F. 431 pp.
Scurlock, J.M.O., and R.J. Olson. 2002. Terrestrial net primary productivity - A brief history and a new worldwide database. Environ. Rev. 10(2): 91-109. doi:10.1139/a02-002
Scurlock, J.M.O., and R.J. Olson. 2013. NPP Multi-Biome: Grassland, Boreal Forest, and Tropical Forest Sites, 1939-1996, R1. Data set. Available on-line [http://daac.ornl.gov] from Oak Ridge National Laboratory Distributed Active Archive Center, Oak Ridge, Tennessee, USA. doi:10.3334/ORNLDAAC/653
8. Data Set Revisions
Revision Summary:
Sub-site locations in the data file have been identified in the Treatment (Treatmt) column: the term "dry" refers to the Rio Sabana site and the term "wet" refers to the Rio Lara site. LAI values from Page 29 of Golley et al. (1975) have been added. Understory biomass (Unstory) values have been corrected and replaced with those reported in Table 2.3 on Page 38 of Golley et al. (1975).
All other NPP values in the data file are not affected.
Data File Changes:
Sub-site locations have been identified. LAI values for each sub-site have been added from Golley et al. (1975). Understory biomass data values have been corrected by
replacing them with values from Golley et al. (1975). The data values
in drn_npp_r1.txt are now correct.
| Parameter in Data Set * | Uncorrected in drn_npp.txt | Corrected in drn_npp_r1.txt |
|---|---|---|
| Treatmt (Rio Sabana) | none | dry |
| Treatmt (Rio Lara) | none | wet |
| LAI (Rio Sabana) (m2/m2) | ** | 10.6 |
| LAI (Rio Lara) (m2/m2) | ** | 22.4 |
| Undstory (Rio Sabana) (g/m2) | 4015 | 401.5 |
| Undstory (Rio Lara) (g/m2) | 1714 | 171.4 |
Notes:
* = See data set Guide document for parameter definitions.
** = Not reported in drn_npp.txt.
Data User Action: If you downloaded this data set before September 6, 2013, you should download it again.
Revision History:
Original Citation
Golley, F. B. 1998. NPP Tropical Forest: Darien, Panama, 1967-1968. Data set. Available on-line [http://daac.ornl.gov] from Oak Ridge National Laboratory Distributed Active Archive Center, Oak Ridge, Tennessee, U.S.A.