Get Data
Summary:
This data set contains three ASCII files (.txt format). Two files contain above- and below-ground biomass and productivity data for a northern mixed prairie grassland, one file for an ungrazed treatment and the other for a heavily grazed treatment. The study site (46.90 N, -102.82 W, Elevation 784 m) is located in the northern Great Plains, near the city of Dickinson, about 160-km west of Bismarck, North Dakota. The third file contains monthly and annual climate data for the period 1891-1994 obtained from a weather station near Dickinson (46.88 N, -102.80 W, Elevation 750 m).
Dynamics of above-ground living and dead plant biomass were monitored by the harvest technique at roughly 2-week intervals during the growing season of 1970. Total below-ground biomass was sampled at the same intervals by manual coring within the harvested plots to a depth sufficient to include at least 90% of the root mass. Data were collected as part of a coordinated study over 1-3 years at ten grassland sites of the central and western United States, under the US Grassland Biome Project of the International Biological Program (IBP).
Above-ground net primary productivity (ANPP) was estimated conservatively by summing peak biomass of individual species. These values were 351 g/m2/year for ungrazed and 302 g/m2/year for grazed grassland plots. Below-ground net primary productivity (BNPP) was estimated as the sum of positive increments in total root biomass (including root crowns); 932 g/m2/year for ungrazed and 958 g/m2/year for grazed grassland plots.
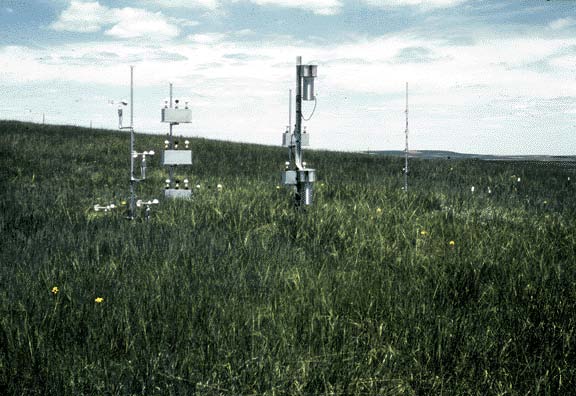
Figure 1. Native grass site at the Dickinson grassland site, North Dakota, USA.
Revision Notes: Only the documentation for this data set has been modified. The files have been checked for accuracy and are identical to those originally published in 1998.
Additional Documentation
The NPP data collection contains field measurements of biomass, estimated NPP, and climate data for terrestrial grassland, tropical forest, temperate forest, boreal forest, and tundra sites worldwide. Data were compiled from the published literature for intensively studied and well-documented individual field sites and from a number of previously compiled multi-site, multi-biome data sets of georeferenced NPP estimates. The principal compilation effort (Olson et al., 2001) was sponsored by the NASA Terrestrial Ecology Program. For more information, please visit the NPP web site at http://daac.ornl.gov/NPP/npp_home.html.
Data Citation:
Cite this data set as follows:
Whitman, W., and W.K. Lauenroth. 2014. NPP Grassland: Dickinson, USA, 1970, R1. Data set. Available on-line [http://daac.ornl.gov] from Oak Ridge National Laboratory Distributed Active Archive Center, Oak Ridge, Tennessee,USA. doi:10.3334/ORNLDAAC/207
This data set was originally published as:
Whitman, W., and W.K. Lauenroth. 1998. NPP Grassland: Dickinson, U.S.A., 1970.
Data set. Available on-line [http://daac.ornl.gov] from Oak Ridge National
Laboratory Distributed Active Archive Center, Oak Ridge, Tennessee, U.S.A.
Table of Contents:
- 1 Data Set Overview
- 2 Data Description
- 3 Applications and Derivation
- 4 Quality Assessment
- 5 Acquisition Materials and Methods
- 6 Data Access
- 7 References
1. Data Set Overview:
Project: Net Primary Productivity (NPP)
Productivity of a northern mixed prairie grassland was monitored at the Dickinson study site in 1970. The Dickinson study site (46.90 N, -102.82 W, Elevation 784 m) is situated in the northern Great Plains, near the city of Dickinson, about 160-km west of Bismarck, North Dakota. The Dickinson sub-station of the U.S. Northern Great Plains Field Station was established in 1907.
Dynamics of above-ground plant biomass were monitored at roughly 2-week intervals during the growing season. Data on above-ground ground live biomass and standing dead matter are available for two replications of a heavily grazed and an "ungrazed" (relatively undisturbed) treatment. Total below-ground biomass was also sampled. Annual above-ground net primary production (ANPP) was estimated conservatively by summing peak biomass of individual species, and annual below-ground net primary production (BNPP) was estimated as the sum of positive increments in total root biomass (including root crowns).
Table 1. Annual above-ground net primary production at Dickinson, 1970 (g/m2/year)
| YEAR | UNGRAZED | GRAZED |
|---|---|---|
| 1970 | 351 | 302 |
Source: Sims and Singh (1978b), Table 2, p. 578. ANPP for the ungrazed grassland is also reported in Esser (2013) and in Scurlock and Olson (2013).
Table 2. Annual below-ground net primary production at Dickinson, 1970 (g/m2/year)
| YEAR | UNGRAZED | GRAZED |
|---|---|---|
| 1970 | 932 | 958 |
Source: Sims and Singh (1978b), Table 4, p. 583. BNPP for the ungrazed grassland is also reported in Esser (2013) and in Scurlock and Olson (2013).
Note: Productivity values are also reported in Olson et al. (2013a; b), but do not agree with the values given above because different calculation methods and conversion factors were used.
Climate data for the period 1891-1994 were obtained from a weather station near Dickinson (46.88 N, -102.80 W, Elevation 750 m).
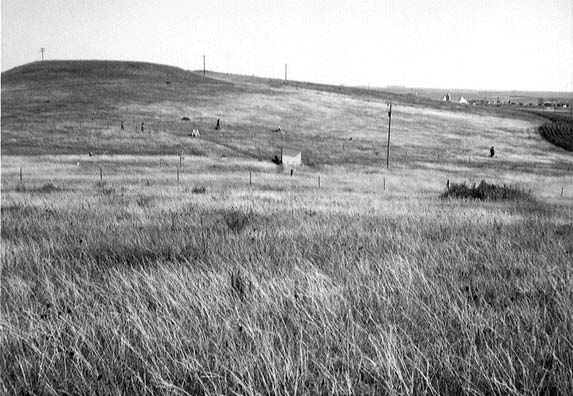
Figure 2. View from the west of the Dickinson grassland site, North Dakota, USA. Areas heavily grazed (towards end of growing season) in the foreground and center background; area within fence (middle of picture) has been protected from grazing since 1961. Grasses in foreground are mostly Stipa comata with some Agropyron smithii; short grass in background is Bouteloua gracilis. (Photograph taken August 1970).
2. Data Description:
Spatial Coverage
Site: Dickinson, North Dakota, USA
Site Boundaries: (All latitude and longitude given in decimal degrees)
| Site (Region) | Westernmost Longitude | Easternmost Longitude | Northernmost Latitude | Southernmost Latitude | Elevation (m) |
|---|---|---|---|---|---|
| Dickinson, North Dakota, USA | -102.82 | -102.82 | 46.90 | 46.90 | 784 |
Spatial Resolution
Harvest plots were 0.5 x 0.5 m.
Temporal Coverage
Biomass measurements were made from 1970/05/26 through 1970/10/17. Climate data are available from 1891/01/01 through 1994/12/31.
Temporal Resolution
Biomass measurements were made at roughly 2-week intervals during the growing season. All NPP estimates are based on plant dry matter accumulation, expressed on a bi-monthly basis as g/m2. Climate data are expressed as monthly and annual precipitation amounts (mm) and monthly and annual average maximum/minimum temperature (degrees C). Monthly and annual climatic means are available for the 1891-1994 period.
Data File Information
Table 3. Data files and descriptions
| FILE NAME | TEMPORAL COVERAGE | FILE CONTENTS |
|---|---|---|
| dck1_npp.txt | 1970/05/26 - 1970/10/17 | Above- and below-ground biomass data for an ungrazed grassland at Dickinson, North Dakota, USA |
| dck2_npp.txt | 1970/05/26 - 1970/10/17 | Above- and below-ground biomass data for a heavily grazed grassland at Dickinson, North Dakota, USA |
| dck_cli.txt | 1891/01/01 - 1994/12/31 | Monthly and annual climate data from the weather station near Dickinson, North Dakota, USA |
NPP Data. Biomass estimates for the Dickinson site are in two files, one for each treatment (Table 3). The data sets are ASCII files (.txt format). The first 18 lines are metadata; data records begin on line 19. The variable values are delimited by semicolons. The values -9, -99, -99.9, and -999.9 are used to denote missing values. All NPP units are reported as g/m2/year (dry matter weight). Below-ground depth is reported in cm.
Table 4. Column headings in NPP files
| COLUMN HEADINGS | DEFINITION | UNITS |
|---|---|---|
| Site | Site where data were gathered (code refers to site identification) | Text |
| Treatmt | Long term management of site (code refers to treatment described in metadata in data file) | |
| Year | Year in which data were collected | Numeric |
| Mn | Month in which data were collected | |
| Dy | Day on which data were collected | |
| Jdate | Date in Julian year | |
| Tyear | Date in decimal year (year plus the Julian date divided by 365) | |
| nrep | Number of replicates | |
| nplots | Number of sampling plots | |
| AGbiomass | Mean above-ground standing crop of living biomass; each value is the mean of several plots from one or two replicates | g/m2 |
| AGbm_SE | Standard error for above-ground living biomass measurement | |
| Olddead | Mean above-ground stnding crop of old dead biomass (i.e., carry-over material from the previous year); each value is the mean of several plots from one or two replicates | |
| Oldd_SE | Standard error for above-ground old dead biomass measurement | |
| Newdead | Mean above-ground standing crop of new dead biomass (i.e., material produced and senesced during the current growing season); each value is the mean of several plots from one or two replicates | |
| Newd_SE | Standard error for above-ground new dead biomass measurement | |
| AGTotclip | Mean total above-ground standing crop biomass (living + dead); each value is the mean of several plots from one or two replicates | |
| Total_SE | Standard error for total above-ground biomass measurement | |
| BGtop30 | Mean below-ground standing crop biomass in top 30 cm sample; each value is the mean of several plots from one replicate | |
| BGtotal | Mean total below-ground stnding crop biomass; each value is the mean of several plots from one replicate | |
| BGdepth | Maximum below-ground sampling depth | cm |
Note: All values are from Sims et al. (1978), Appendix III.
Sample NPP Data Record <dck1_npp.txt>
| Site;Treatmnt;Year;Mo;Dy;Jdate;Tyear;nrep;nplots;AGbiomass;AGbm_SE;Olddead;Oldd_SE;Newdead;Newd_SE; AGTotclip;Totcl_SE;nrep_BG;nplot_BG;BGtop30;BGtotal;BGdepth dck;ungrazed;1970;05;26;146;1970.400; 1; 5; 37.0; 5.1; 331.4; 26.2; 0.0; 0.0; 368.4; 24.1; 1; 5;1234.0;1456.5; 100.0 dck;ungrazed;1970;06;15;166;1970.455; 1; 20; 73.7; 4.9; 383.2; 66.1; 0.0; 0.0; 456.9; 68.3; 1; 10;1210.7;1495.5; 100.0 dck;ungrazed;1970;06;25;176;1970.482; 1; 24; 156.4; 15.1; 345.4; 56.6; 0.0; 0.0; 501.9; 56.1; 1; 10;1665.7;2168.5; 100.0 ... |
Sample NPP Data Record <dck2_npp.txt>
| Site;Treatmnt;Year;Mo;Dy;Jdate;Tyear;nrep;nplots;AGbiomass;AGbm_SE;Olddead;Oldd_SE;Newdead;Newd_SE; AGTotclip;Totcl_SE;nrep_BG;nplot_BG;BGtop30;BGtotal;BGdepth dck;hvygrzd ;1970;05;26;146;1970.400; 1; 5; 96.9; 16.0; 13.5; 2.5; 0.0; 0.0; 110.4; 15.4; 1; 5;2217.3;2783.0; 100.0 dck;hvygrzd ;1970;06;15;166;1970.455; 1; 20; 130.5; 12.1; 18.7; 5.5; 0.0; 0.0; 149.2; 15.5; 1; 10;1818.7;2300.9; 100.0 dck;hvygrzd ;1970;06;25;176;1970.482; 1; 24; 203.1; 8.0; 26.2; 6.4; 0.0; 0.0; 229.4; 7.3; 1; 10;2333.0;2934.4; 100.0 ... |
Climate Data. The data set is an ASCII file (.txt format). The first 18 lines are metadata; data records begin on line 19. The variable values are delimited by semicolons. Monthly and annual precipitation and temperature data are provided for each year 1891 through 1994. Monthly and annual means are provided for the 1891-1994 period.
| COLUMN HEADINGS | DEFINITION |
|---|---|
| Site | Unique 3-character code for each site based on the first three consonants in the site name (e.g., dck for Dickinson) |
| Temp (Temporal) |
Indicates whether the values in that row are either long-term (i.e, mulit-year) or annual data for the specified parameter. For multi-year, the values are: mean=mean values (monthly and annual) calculated for the years of data as noted in the documentation numb=number of years of data included in a reported mean value stdv=standard deviation of a mean value Annual data: 19XX=monthly and annual parameter values for the specified year (e.g., 1972) |
| Parm | Parameter, indicates the meteorological data reported in that row. prec-total precipitation for the month or year tmax=maximum temperature for the month or year reported in degrees C tmin=minimum temperature for the month or year reported in degrees C |
|
Description of specific Temp and Parm data values: Long-term data: site;mean;prec; Multi-year mean of total precipitation for each month [Jan, Feb, Mar, …, Dec] and mean of total annual precipitation across all years [Year] (mm) site;mean;tmax; Multi-year mean of maximum temperature for each month [Jan, Feb, Mar, …, Dec] and mean of annual maximum temperature across all years [Year] (C) site;mean;tmin; Multi-year mean of minimum temperature for each month [Jan, Feb, Mar, …, Dec] and mean of annual minimum temperature across all years [Year] (C) … site; numb and stdv; repeat for prec, tmax, and tmin; Annual data: site;19XX;prec; Total precipitation for each month [Jan, Feb, Mar,.....Dec] and total precipitation for the year 19XX [Year] (mm) site;19XX;tmax; Maximum temperature for each month [Jan, Feb, Mar,.....Dec] and maximum for the year 19XX [Year] (C) site;19XX;tmin; Minimum temperature for each month [Jan, Feb, Mar,.....Dec] and minimum for the year 19XX [Year] (C) … site;19XX;(prec, tmax, and tmin); repeat for reported years. Annual data missing value note: If a monthly parm value is missing, the parm value for [Year] is also set to missing (-999.9). |
Sample Climate Data Record
| Site;Temp;Parm; Jan; Feb; Mar; Apr; May; Jun; Jul; Aug; Sep; Oct; Nov; Dec; Year dck ;mean;prec; 10.98; 10.51; 19.14; 38.49; 60.81; 94.70; 58.44; 45.02; 34.76; 24.65; 13.86; 10.67; 422.03 dck ;mean;tmax; -5.30; -3.11; 2.94; 12.62; 19.18; 23.70; 28.52; 27.82; 26.60; 14.52; 4.43; -2.46; 29.41 dck ;mean;tmin; -17.84; -15.79; -9.52; -2.02; 3.45; 8.20; 11.01; 9.96; 4.17; -1.60; -8.99; -14.71; -19.95 dck ;numb;prec; 104.00; 104.00; 104.00; 104.00; 104.00; 104.00; 104.00; 104.00; 104.00; 104.00; 104.00; 104.00; 104.00 dck ;numb;tmax; 95.00; 100.00; 100.00; 100.00; 102.00; 101.00; 97.00; 98.00; 97.00; 101.00; 96.00; 92.00; 92.00 dck ;numb;tmin; 95.00; 100.00; 102.00; 102.00; 102.00; 101.00; 96.00; 98.00; 97.00; 101.00; 98.00; 92.00; 92.00 dck ;stdv;prec; 9.05; 8.17; 15.16; 28.79; 40.34; 46.05; 34.03; 32.99; 30.86; 26.85; 14.16; 8.95; 101.11 dck ;stdv;tmax; 4.91; 4.37; 3.95; 3.07; 2.64; 2.55; 2.38; 2.23; 2.54; 2.76; 3.47; 3.94; 2.08 dck ;stdv;tmin; 4.60; 4.71; 3.46; 1.81; 1.82; 1.72; 1.59; 1.65; 1.50; 1.85; 2.39; 3.50; 3.79 dck ;1891;prec; 3.08; 12.56; 22.31; 74.36; 53.85; 104.10; 117.69; 18.46; 26.15; 41.54; 16.41; 16.67; 507.18 dck ;1891;tmax;-999.99;-999.99;-999.99;-999.99;-999.99;-999.99;-999.99;-999.99;-999.99;-999.99;-999.99;-999.99;-999.99 dck ;1891;tmin;-999.99;-999.99;-999.99;-999.99;-999.99;-999.99;-999.99;-999.99;-999.99;-999.99;-999.99;-999.99;-999.99 dck ;1892;prec; 10.51; 19.74; 19.74; 117.69; 57.95; 72.05; 127.18; 48.97; 3.33; 7.95; 4.87; 12.31; 502.31 dck ;1892;tmax;-999.99;-999.99;-999.99;-999.99;-999.99;-999.99;-999.99;-999.99;-999.99;-999.99;-999.99;-999.99;-999.99 dck ;1892;tmin;-999.99;-999.99;-999.99;-999.99;-999.99;-999.99;-999.99;-999.99;-999.99;-999.99;-999.99;-999.99;-999.99 … Where, Temp (temporal) - specific year or long-term statistic: mean = mean based on all years numb = number of years stdv = standard deviation based on all years Parm (parameter): prec = precipitation for month or year (mm) tmax = mean maximum temperature for month or year (C) tmin = mean minimum temperature for month or year (C) |
3. Data Application and Derivation:
Grassland monthly biomass dynamics data are provided for comparison with model output and estimation of NPP. Climate data are provided for use in driving ecosystem/NPP models.
Data from Dickinson were collected as part of a coordinated study over 1-3 years at ten grassland sites of the central and western United States, under the US Grassland Biome Project of the International Biological Program (IBP). The aim of the US/IBP Grassland Biome program was to study the whole US grassland system, particularly the seasonal biomass and energy dynamics of grasslands across multiple trophic levels (Sims et al., 1978). The ten sites for which net primary productivity (NPP) data are reported encompassed six major grassland types, ranging from latitude 30 to 48 N and longitude -96 to -123 W, and elevation from 390 m to 2,340 m. Mean annual precipitation for the ten sites ranged from 228 mm to 930 mm. Mean annual temperature ranged from 2.7 degrees C to 15.2 degrees C.
4. Quality Assessment:
Under the US Grassland Biome Project, above- and below-ground biomass and productivity at the participating grassland sites was measured and calculated using comparable methods.
Sources of Error
Annual ANPP determined by the summation of peak live weights of individual species, as in this study, can yield a conservative estimate because material produced, senesced and detached before the peak live weight of a given species occurs is unaccounted for. The presence of different growth forms in the variety of vegetation types grasslands complicates the study of crowns and estimation of crown biomass production. Difficulties and inaccuracies involved in the estimation of root production arise primarily because of insufficient information on the periods of greatest root growth and decomposition, and the unaccounted losses of organic root secretions, sloughing of root hairs, root caps, and cortical layers, translocation of organic material to the soil and to the fungal components of mycorrhizal roots, death and decay of fine roots, and consumption of fine roots by soil organisms. Estimates of root production should therefore be viewed with the constraints imposed by the procedures used.
5. Data Acquisition Materials and Methods:
Site Information
The Dickinson study site (46.90 N, -102.82 W) is situated in the northern Great Plains, near the city of Dickinson, about 160-km west of Bismarck, North Dakota. The Dickinson sub-station of the U.S. Northern Great Plains Field Station was established in 1907.
The Dickinson study site is located in a northern mixed prairie grassland (modified Bailey ecoregion temperate dry steppe, #331) at an elevation of 784 m. This northern Great Plains site has a mixture of cool- and warm-season grasses and forbs. Stipa comata and Agropyron smithii are the most abundant species; species of secondary importance are Bouteloua gracilis and the cool-season sedge Carex eleocharis. The total number of vegetation species recorded at Dickinson in this study was 46. The soil type at Dickinson is loamy sand Mollisol.
Methods
The experimental design included two treatments: ungrazed (i.e., long-term absence of grazing by large domestic herbivores) and heavily grazed grasslands. The ungrazed treatment area had been protected from grazing since 1961, sufficient time (in the opinion of the investigators) for the area to become successionally stable. The grazed treatment refers to grazing during the previous growing seasons, since no domestic animals were allowed on the areas sampled during the current year. Each treatment area had 1 or 2 replications, with 5 to 26 plots, depending on the sampling period and treatment.
Intra-seasonal dynamics of the various above- and below-ground primary producer compartments were studied at Dickinson. The experimental design included two replications of ungrazed (i.e., long-term absence of grazing by large domestic herbivores by enclosure) and recently-grazed treatments. Structural characteristics studied included quantities of cool- and warm-season plants at each plot, and magnitude and seasonality of primary producer compartments. These latter measurements included seasonal above-ground live biomass, above-ground dead matter (recent plus old dead), total above-ground standing crop (living plus dead biomass), below-ground biomass by depth (root and crown inclusive) and total below-ground biomass. Litter decomposition and below-ground root turnover were also separately measured but the data are not included in this data set.
Above-ground biomass was measured by the harvest technique, over successive 2-week intervals during the growing season. Harvest plots were 0.5 x 0.5 m2. The aerial plant material was clipped at the soil surface. Plant biomass above-ground was separated into several compartments, including perennial live, current (annual) live, recent dead, and old dead. Recent and old dead were primarily determined on the basis of color and the experience of the field and laboratory workers; recent dead was the material produced and senesced during the current growing season, while old dead was carry-over material from the previous year. Live and dead compartment material was further separated by species. Litter material was collected from the harvest plots by a vacuum method. All material was oven-dried at c. 60 degrees C. Aerial materials were presented on a dry matter basis while litter weights were converted to an ash-free basis. Perennial and current live were summed to obtain total live material, and likewise recent dead and old dead were summed to give total dead material.
Below-ground biomass was sampled by manual coring within the harvested plots to a depth sufficient to include at least 90% of the root mass. Soil cores containing root samples were separated into 10-cm increments, and the increments washed over a 32-mesh screen. An additional fine screen was used during the washing process. All material was oven-dried at c. 60 degrees C, weighed, and then ashed. Further details for specific sampling procedures for Dickinson appear in Whitman (1971) and Sims et al. (1978).
Intra-seasonal biomass dynamics data are provided in this data set. Annual ANPP or shoot production was determined by the summation of peak live weights of individual species. Net root production was estimated from the summation of the significant positive increases in root biomass by depth. Annual BNPP was estimated as the sum of total root biomass (including crown biomass). Data analysis and results are discussed by Sims and Singh (1978b).
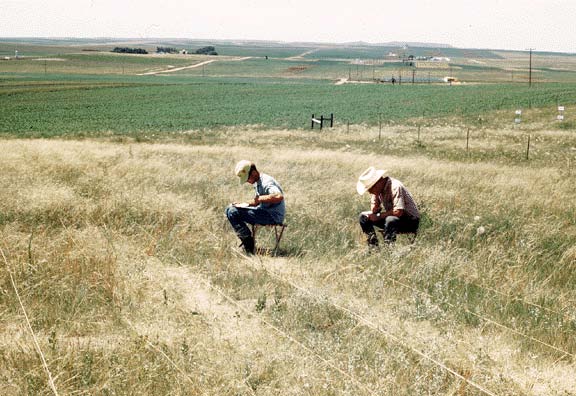
Figure 3. View showing white strings for sample quadrat location at the Dickinson grassland site, North Dakota, USA. (Bill Lauenroth and John Cook, North Dakota State University, are ranking sample plots in the grazed treatment area) Photograph taken July 1970).
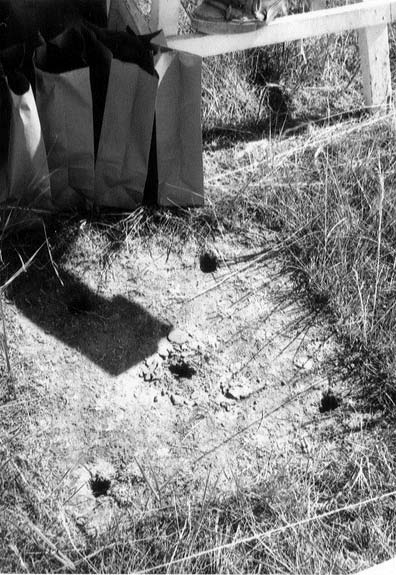
Figure 4. Quadrat (0.5 x 0.5-m) after clipping and removal of litter; grazed treatment, Dickinson grassland site, North Dakota, USA. Five root cores were taken within the quadrat to 1.0-m depth, in increments as follows: 0-5 cm, 5-10 cm, 10-20 cm, 20-30 cm....90-100 cm. Note the paper bags (upper left) in which core samples were placed, and white strings (top and bottom of picture) used as aids in locating quadrats. All holes left by root sampling were later filled. (Photograph taken August 1970).
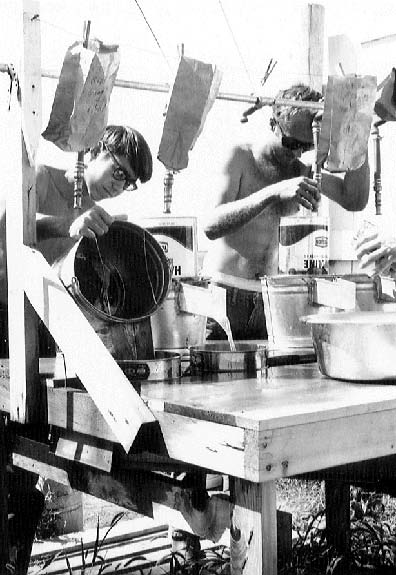
Figure 5. Washing root samples at the Dickinson grassland site, North Dakota, USA. Water from the larger buckets was being poured through #32 sieves, where the roots were collected. The samples were then returned to the paper bags clipped above the table for drying and preservation. Left - Tim Vranna, high school student from Dickinson; right - John Cook, graduate, North Dakota State University (Photograph taken August 1970).
Climate data
Monthly and annual climate data for the period 1891-1994 were calculated from daily observations obtained from a weather station near Dickinson (46.88 N, - 102.80 W, Elevation 750 m). Mean annual precipitation was 422.03 mm. Mean annual maximum temperature was 29.41 degrees C and mean annual minimum temperature was -19.95 degrees C based on the 1891-1994 climatic record. The length of thermal potential growing season (defined as the number of consecutive days with a 15-day running-mean air temperature at or above 4.4 degrees C) during the NPP study was 168 days.
For a given month, the maximum value of the daily Tmax for that month and the minimum value of the Tmin for that month is provided. For the year, the maximum value of the monthly Tmax is the annual Tmax and for the year the minimum value of the monthly Tmin values is the annual Tmin. Daily precipitation amount is summed to yield a monthly precipitation amount and the monthly precipitation is summed to provide an annual precipitation amount.
The multi-year mean monthly Tmax is the average of the Tmax values for that month for each year of the record. For example the mean monthly Tmax for April is the mean of each April’s Tmax for the observation period of record. Mean monthly Tmin and Mean monthly precip amount are calculated similarly.
6. Data Access:
This data is available through the Oak Ridge National Laboratory (ORNL) Distributed Active Archive Center (DAAC).
Data Archive Center:
Contact for Data Center Access Information:
E-mail: uso@daac.ornl.gov
Telephone: +1 (865) 241-3952
7. References:
Olson, R.J., K.R. Johnson, D.L. Zheng, and J.M.O. Scurlock. 2001. Global and Regional Ecosystem Modeling: Databases of Model Drivers and Validation Measurements. ORNL Technical Memorandum TM-2001/196. Oak Ridge National Laboratory, Oak Ridge, Tennessee, U.S.A.
Sims, P.L., J.S. Singh, and W.K. Lauenroth. 1978. The structure and function of ten western North American grasslands. I. Abiotic and vegetational characteristics. Journal of Ecology 66: 251-285.
Whitman, W.C. 1971. Primary Productivity and Abiotic Studies at the Dickinson Site, 1970 Season. US/IBP Grassland Biome Technical Report, No. 116. Colorado State University, Fort Collins, Colorado.
Additional Sources of Information:
Esser, G. 2013. NPP Multi-Biome: Global Osnabruck Data, 1937-1981. Data set. Available on-line [http://daac.ornl.gov] from Oak Ridge National Laboratory Distributed Active Archive Center, Oak Ridge, Tennessee, USA doi:10.3334/ORNLDAAC/214
Olson, R.J., J.M.O. Scurlock, S.D. Prince, D.L. Zheng, and K.R. Johnson (eds.). 2013a. NPP Multi-Biome: Global Primary Production Data Initiative Products, R2. Data set. Available on-line [http://daac.ornl.gov] from the Oak Ridge National Laboratory Distributed Active Archive Center, Oak Ridge, Tennessee, USA. doi:10.3334/ORNLDAAC/617
Olson, R.J., J.M.O. Scurlock, S.D. Prince, D.L. Zheng, and K.R. Johnson (eds.). 2013b. NPP Multi-Biome: NPP and Driver Data for Ecosystem Model-Data Intercomparison, R2. Data set. Available on-line [http://daac.ornl.gov] from the Oak Ridge National Laboratory Distributed Active Archive Center, Oak Ridge, Tennessee, USA. doi:10.3334/ORNLDAAC/615
Scurlock, J.M.O., and R.J. Olson. 2002. Terrestrial net primary productivity - A brief history and a new worldwide database. Environ. Rev. 10(2): 91-109. doi:10.1139/a02-002
Scurlock, J.M.O., and R.J. Olson. 2013. NPP Multi-Biome: Grassland, Boreal Forest, and Tropical Forest Sites, 1939-1996, R1. Data set. Available on-line [http://daac.ornl.gov] from Oak Ridge National Laboratory Distributed Active Archive Center, Oak Ridge, Tennessee, USA. doi:10.3334/ORNLDAAC/653
Scurlock, J.M.O., K. Johnson, and R.J. Olson. 2002. Estimating net primary productivity from grassland biomass dynamics measurements. Global Change Biology 8(8): 736–753. DOI: 10.1046/j.1365-2486.2002.00512.x
Sims, P.L., and J.S. Singh. 1978a. The structure and function of ten western North American grasslands. II. Intra-seasonal dynamics in primary producer compartments. Journal of Ecology 66: 547-572.
Sims, P.L., and J.S. Singh. 1978b. The structure and function of ten western North American grasslands. III. Net primary production, turnover and efficiencies of energy capture and water use. Journal of Ecology 66: 573-597.
Whitman, W.C. 1972. Supplemental Report on Primary Productivity and Abiotic Studies at the Dickinson Site, 1970 Season. US/IBP Grassland Biome Technical Report, No. 190. Colorado State University, Fort Collins, Colorado.