Get Data
Summary:
This data set records the productivity of a semiarid shortgrass prairie steppe located in the Central Plains Experimental Reserve (CPER)/Pawnee National Grassland in north-central Colorado. There are nine data files (.txt). Four files contain measurements of monthly dynamics of harvested above-ground plant biomass, one file each for untreated, irrigated, fertilized, and irrigated + fertilized plots for the period 1970 to 1975. The fifth file contains annual above-ground NPP estimates for the untreated plot for the period 1970-1974. The sixth file contains long-term ANPP estimated from field harvest measurements made between 1970 and 1990 and by correlation with forage production measurements made between 1939 and 1990. Two additional files provide estimates of above- and below-ground NPP based on peak growing season harvests; one record covers 1970-1972 from the Pawnee site and the other covers 1985-1988 from CPER. The ninth file contains climate data for 1912-1990 from a weather station located at CPER.
Depending on the study, location, and methods, ANPP ranged from a mean of 78 g/m2/yr (grasses + forbs + succulents) to 172 g/m2/yr (grasses + forbs + succulents + shrubs) on untreated plots. In treated areas, production (grasses + forbs + succulents + shrubs) peaked at approximately 240 g/m2/yr on fertilized plots, 420 g/m2/yr on irrigated plots, and 1,000 g/m2/yr on irrigated + fertilized plots. BNPP on untreated plots ranged from 185 g/m2/yr for root production to 568 g/m2/yr for root + crown production.
Revision Notes: This data set has been revised to correct the study site elevation, extend the temporal coverage, and add four data files containing estimates of NPP. Please see the Data Set Revisions section of this document for detailed information.
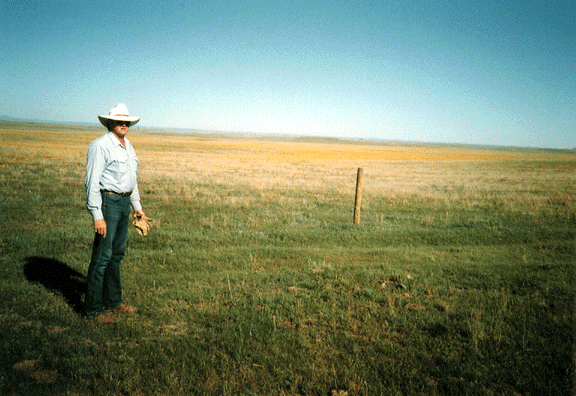
Figure 1. General view of the CPER grassland site, Colorado, USA. (Mark Lindquist, Colorado State University, demonstrates moderate [foreground] and light [background] grazing regimes. Photograph taken July 1996 by Dr. J.M.O. Scurlock, ORNL).
Additional Documentation
The NPP data collection contains field measurements of biomass, estimated NPP, and climate data for terrestrial grassland, tropical forest, temperate forest, boreal forest, and tundra sites worldwide. Data were compiled from the published literature for intensively studied and well-documented individual field sites and from a number of previously compiled multi-site, multi-biome data sets of georeferenced NPP estimates. The principal compilation effort (Olson et al., 2001) was sponsored by the NASA Terrestrial Ecology Program. For more information, please visit the NPP web site at http://daac.ornl.gov/NPP/npp_home.shtml
Data Citation:
Cite this data set as follows:
Uresk, D., P.L. Sims, and J.L. Dodd. 2015. NPP Grassland: Central Plains Experimental Range (SGS), USA, 1939-1990, R1. Data set. Available on-line [http://daac.ornl.gov] from Oak Ridge National Laboratory Distributed Active Archive Center, Oak Ridge, Tennessee, USA. http://dx.doi.org/10.3334/ORNLDAAC/145
This data set was originally published as:
Uresk, D., P.L. Sims, and J.L. Dodd. 1996. NPP Grassland: Central Plains Experimental Range (SGS), U.S.A., 1970-1975. Data set. Available on-line [http://daac.ornl.gov] from Oak Ridge National Laboratory Distributed Active Archive Center, Oak Ridge, Tennessee, U.S.A.
Table of Contents:
- 1 Data Set Overview
- 2 Data Description
- 3 Applications and Derivation
- 4 Quality Assessment
- 5 Acquisition Materials and Methods
- 6 Data Access
- 7 References
- 8 Data Set Revision Information
1. Data Set Overview:
Project: Net Primary Productivity (NPP)
This data set contains records of the productivity of a semi-arid shortgrass prairie steppe located in the piedmont of north-central Colorado (40.82 N -104.77 W Elevation 1,652 m). Productivity was monitored at the Central Plains Experimental Reserve (CPER) and the Pawnee National Grassland at various times from 1939 to 1990.
There are nine files (.txt) in this data set. Four files contain biweekly to monthly measurements of harvested above-ground plant biomass, one file for each treatment (untreated, irrigated, fertilized, and irrigated + fertilized) for the period 1970 to 1975 (Dodd and Lauenroth, 1979). The fifth file contains annual above-ground NPP estimates for the untreated plot for the period 1970-1974 (Dodd and Lauenroth, 1979). The sixth file contains long-term ANPP estimated from field biomass measurements made between 1970 and 1990 and by correlation with forage production measurements made between 1939 and 1990 (Lauenroth and Sala, 1992). Two additional files provide estimates of above- and below-ground NPP based on peak growing season harvests; one record covers 1970-1972 at Pawnee (Sims and Singh, 1978) and the other record covers 1985-1988 at CPER (Milchunas and Lauenroth, 1992). The ninth file contains climate data for 1912-1990 recorded at CPER.
Depending on the study, location, and methods, ANPP ranged from a mean of 78 g/m2/yr (grasses + forbs + succulents) to 172 g/m2/yr (grasses + forbs + succulents + shrubs) on untreated plots. In treated areas, production (grasses + forbs + succulents + shrubs) peaked at approximately 240 g/m2/yr on fertilized plots, 420 g/m2/yr on irrigated plots, and 1,000 g/m2/yr on irrigated + fertilized plots. BNPP on untreated plots ranged from 185 g/m2/yr for root production to 568 g/m2/yr for root + crown production. ANPP, BNPP, and TNPP estimates are also reported in Esser (2013), Olson et al. (2013a, b), and Scurlock and Olson (2013). These values are comparable to the values reported by Sims and Singh (1978) (Table 1).
Earlier work was originally carried out by the U.S. Agricultural Research Service and under the U.S. Grassland Biome Project of the International Biological Programme (IBP). Research has continued under the U.S. Long-Term Ecological Research (LTER) program at the Shortgrass Steppe (SGS) site. Data on soil dynamics at CPER were used in the development of the CENTURY plant/soil organic matter model.
Table 1. ANPP, BNPP, and TNPP values for untreated CPER/Pawnee plots reported by various published data sources.
| File Name or Description | Data Source(s) | Sub-Site | Temporal Coverage | ANPP | BNPP | TNPP |
|---|---|---|---|---|---|---|
| alphanumeric | yyyy-yyyy | gC/m2/year | ||||
| cpr5_npp.txt | Dodd and Lauenroth (1979) | cpr5 (with shrubs) | 1970-1974 | 57.5 | NA | NA |
| cpr5 (without shrubs) | 35.1 | NA | NA | |||
| cpr6_npp.txt | Lauenroth and Sala (1992) | cpr6 (field measurements; without shrubs) | 1970-1990 | 42.3 | NA | NA |
| cpr6 (calculation based on forage production measurements; without shrubs) | 1939-1990 | 43.7 | NA | NA | ||
| cpr7_npp.txt | Sims and Singh (1978) | cpr7 (with shrubs) | 1970-1972 | 77.4 | 255.6 | 333 |
| cpr8_npp.txt | Milchunas and Lauenroth (1992) | cpr8 (harvest method with shrubs) | 1985-1998 | 47.3 | 106.2 | NA |
| cpr8 (harvest method without shrubs) | 40.95 | |||||
| cpr8 (14C turnover method) | 49.1 | 104.4 | ||||
| NPP_Multibiome_EnvReview_Table_A1_R1.csv | Scurlock and Olson (2013) based on Sims and Singh (1978) | cpr | 1970-1972 | 77 | 256 | 333 |
| ods_npp.csv | Esser et al. (2013) | 2075 | ||||
| GPPDI_ClassA_NPP_162_R2.csv | Olson et al. (2013a) | Class A 87 (MI 86) | ||||
| EMDI_ClassA_NPP_81_R1.xls | Olson et al. (2013b) | Class A 87 | ||||
Notes: NA = Not available. MI = Measurement identification number. The differences in NPP values reported in this table are mainly due to differences in plot locations, harvest methods, and calculation methods. Please consult original references for details.
For this table, NPP data from the original data sources were converted from grams of dry weight per meter square per year to grams of carbon per meter square per year using a conversion factor of 0.45.
ANPP and BNPP estimates are mean values based on field measurements and/or calculations based on forage production measurements. TNPP = ANPP + BNPP. Please consult original references for details.
NPP estimates in cpr7_npp.txt and in Scurlock and Olson (2013), Esser et al. (2013), and Olson et al. (2013a; b) come from studies at the Pawnee site; the other data come from CPER.
NPP estimates were not calculated in data files cpr1_npp_r1.txt, cpr2_npp_r1.txt, cpr3_npp_r1.txt, or cpr4_npp_r1.txt.
Please see the Data Set Revisions section of this document for detailed information on the revised data sets (R1, R2, etc.)
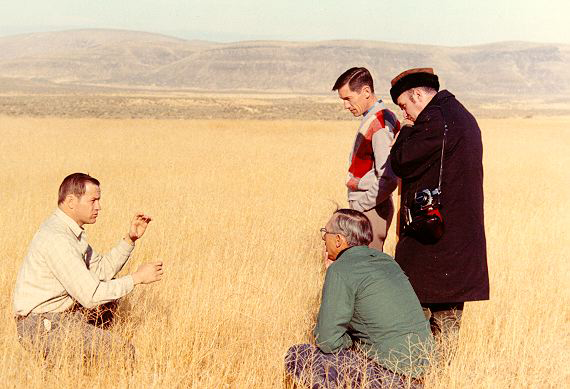
Figure 2. Dr. George Van Dyne (Director 1970-73, Natural Resource Ecology Laboratory, Colorado State University, and Director of the US/IBP Grassland Biome Programme) with Dr. Norman French (Field Validation Studies Director, Grassland Biome Programme) and two visitors at the CPER/Pawnee grassland site, Colorado, USA. (Photograph taken early 1970s: reproduced by kind permission of NREL).
2. Data Description:
Spatial Coverage
Site: Central Plains Experimental Range (CPER)/Pawnee National Grassland, USA
Site Boundaries: (All latitude and longitude given in decimal degrees)
| Site (Region) | Westernmost Longitude | Easternmost Longitude | Northernmost Latitude | Southernmost Latitude | Elevation (m) |
|---|---|---|---|---|---|
| Central Plains Experimental Range (CPER)/Pawnee National Grassland, USA | -104.77 | -104.77 | 40.82 | 40.82 | 1,652 |
Spatial Resolution
The CPER grassland site is about 6,280 ha. The western division of the Pawnee National Grassland is about 42,492 ha. The spatial resolution of the study plots included in this data set is shown in Table 2.
Table 2. Spatial resolution of study plots.
| STUDY | FILE NAMES | LOCATION | REPLICATES | PLOT SIZE | TEMPORAL RESOLUTION | TEMPORAL COVERAGE |
|---|---|---|---|---|---|---|
| Dodd and Lauenroth (1979) | cpr1_npp, cpr2_npp, cpr3_npp, cpr4_npp | CPER | Two one-hectare replicates of each treatment (control, irrigated, fertilized, and irrigated + fertilized); ungrazed the year prior to and during the six year study | 10 to 12 circular 0.5-m2 plots for each treatment | Harvests made several times each year during growing season (biweekly, monthly, or every other month; see data files for details) | 1970-1975 |
| Dodd and Lauenroth (1979) | cpr5_npp | CPER | Two one-hectare replicates of control treatment (above); ungrazed the year prior to and during the six year study | 10 to 12 circular 0.5-m2 plots for control replicates | Annual estimates of ANPP and BNPP based on harvests made during growing season (see above) | 1970-1974 |
| Lauenroth and Sala (1992) | cpr6_npp | CPER | Average of eleven locations per year (range: 3 to 35 locations) | 0.19-m2 quadrats | Harvests made at the end of the growing season | 1939-1990 |
| Sims and Singh (1978) | cpr7_npp | Pawnee | Two replicates; ungrazed since 1939 | 0.25 to 0.5-m2 square or rectangular plots (1970); 0.5-m2 circular quadrats (1971-1972) | Harvests made every two weeks during growing season | 1970-1972 /td> |
| Milchunas and Lauenroth (1992) | cpr8_npp | CPER | Control plots: 15 above-ground harvest plots and 80 cores of crown and root biomass each sampling period. 14C labeled treatment plots: eight long-term replicates (9-m2 each) and eight short-term replicates (4-m2 each); ungrazed since 1969 | Control plots: 0.25-m2 above-ground plots and cores with 66.5-mm inside diameter for crown and root (0-20 cm) biomass. 14C treatment: two adjacent cores from the center of each of five 0.11-m2 squares per plot and five 0.14-m2 squares per plot = 2 cores x 5 squares x 8 plots = 80 cores per date per treatment (long- and short-term experiments, respectively). | Harvests made of peak above-ground standing crops of current-year biomass; crown and root cores taken on the same date. Samples using 14C method taken 5, 35, 85, 267, 381, and 485 days after labeling (short-term plots) and 267, 485, 632, 846, and 1,013 days after labeling (long-term plots)./td> | 1985-1988 |
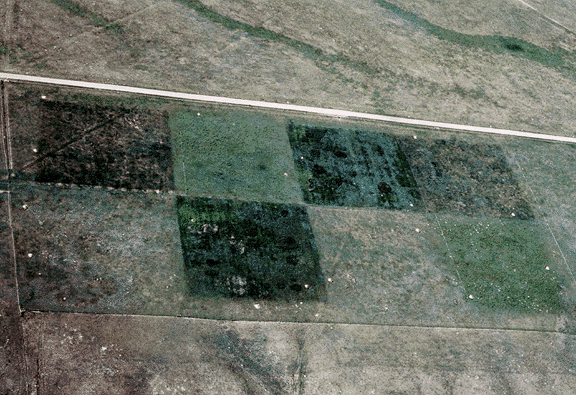
Figure 3. Aerial view of the Dodd and Lauenroth (1979) Ecological Stress Analysis (ESA) experimental area at the CPER/Pawnee grassland site, Colorado, USA. Differences between the 4 treatments, each with two replicates, are quite obvious. Photograph taken July 1975.
Temporal Coverage
All measurements were made between 1939 and 1990. Temporal coverage of each data file varies. See Table 3.
Temporal Resolution
Biomass measurements were made at different sampling intervals for each study, ranging from biweekly to monthly to once at the end of the growing season to seasonal "days after treatment." See Table 4. Biomass measurements are expressed as g/m2 per sampling date. All NPP measurements are expressed on a annual basis (g/m2/yr).
Data File Information
Table 3. Data file descriptions.
| FILE NAME | TEMPORAL COVERAGE | FILE CONTENTS |
|---|---|---|
| cpr1_npp_r1.txt, cpr2_npp_r1.txt, cpr3_npp_r1.txt, cpr4_npp_r1.txt | 1970/04/26-1975/08/18 | Biweekly and monthly above-ground biomass measurements of live and standing dead grass, forbs, succulents, and shrubs from CPER plots with four treatments: control, irrigated, fertilized, and irrigated + fertilized |
| cpr5_npp.txt | 1970/04/26-1975/08/18 | ANPP estimates for control plot in CPER based on peak biomass (see above) |
| cpr6_npp.txt | 1939/01/01-1990/12/31 | Annual estimates of above-ground forage biomass and ANPP for live and attached dead grasses, forbs, and sedges in CPER |
| cpr7_npp.txt | 1970/01/01-1972/12/31 | ANPP estimates based on sum of harvested peak live weights of individual species during the growing season and BNPP estimates based on sum of harvested crown biomass and positive increments of root biomass by depth (0-20 cm) during growing season at Pawnee |
| cpr8_npp.txt | 1985/01/01-1988/12/31 | ANPP and BNPP estimates from two methods: harvest clips and cores and 14C turnover in CPER |
| cpr_cli.txt | 1912/01/01-1990/12/31 | Monthly and annual precipitation amount and maximum/minimum temperatures plus long-term means from weather station located at CPER |
NPP Data. NPP estimates are provided in eight text files (.txt format) (Table 3). The variable values are tab delimited. The first 18 lines are metadata; data records begin on line 19. The value -999 is used to denote missing values. All biomass units are expressed in g/m2 (dry matter weight) and NPP units are expressed in g/m2/yr (dry matter weight).
Table 4. Column headings in NPP files cpr1_npp_r1.txt, cpr2_npp_r1.txt, cpr3_npp_r1.txt, and cpr4_npp_r1.txt.
| COLUMN HEADING | DEFINITION | UNITS |
|---|---|---|
| Site | Site where data were gathered (code refers to site identification) | alphnumeric |
| Treatmt | Long term management of site (code refers to treatment in the Ecological Stress Analysis (ESA) experimental area: esa_c = control (none); esa_i = irrigated; esa_f = fertilized; esa_if = irrigated + fertilized). All plots were ungrazed one year prior to and during the study. | text |
| Year | Year in which data were collected | yyyy |
| Mn | Month in which data were collected | MM |
| Dy | Day on which data were collected | dd |
| Tyear | Date in decimal year (year plus the Julian date divided by 365) | numeric |
| AGbioherb | Above-ground live biomass of herbaceous layer | g/m2 |
| forbs | Above-ground live biomass of forbs | |
| grass | Above-ground live biomass of grasses | |
| Deadherb | Dead herbaceous matter | |
| Deadforb | Dead forb matter | |
| Deadgras | Dead grass matter | |
| AGherbclip | Total clipped matter for herbaceous layer | |
| ShrSuc | Above-ground live biomass of shrubs and succulents | |
| Deadshrsuc | Dead shrubs and succulents | |
| AGbiomass | Above-ground biomass | |
| Stdead | Standing dead | |
| AGTotclip | Total above-ground clipped matter |
Sample NPP Data Record: cpr1_npp_r1.txt
| Site Treatmt Year Mn Dy Jdate Tyear AGbioherb forbs grass Deadherb Deadforb Deadgras AGherbclip ShrSuc Deadshrsuc AGbiomass Stdead AGTotclip [units g/m2] cpr esa_c 1970 4 26 116 1970.318 32.96 0.2 32.76 9.62 0 9.62 42.58 49.6 0 82.56 9.62 92.18 cpr esa_c 1970 5 12 132 1970.362 53.87 1.22 52.65 0 0 0 53.87 38.46 0 92.33 0 92.33 ... |
Table 5. Column headings in NPP file: cpr5_npp.txt.
| COLUMN HEADING | DEFINITION | UNITS |
|---|---|---|
| Site | Site where data were gathered (code refers to site identification). This site is also known as esa_c = control (no fertilization or water treatment) and ungrazed one year prior to and during the study. | alphnumeric |
| Year | Year in which data were collected | yyyy |
| ANPP_w_shrubs | Above-ground net primary production = sum of peak standing crop of current-year grasses + forbs + succulents + shrubs | g/m2/yr |
| ANPP_wo_shrubs | Above-ground net primary production = sum of peak standing crop of current-year grasses + forbs + succulents (without shrubs) | |
| Precip | Total annual precipitation | mm |
Sample NPP Data Record: cpr5_npp.txt
|
Site Year ANPP_w_shrubs ANPP_wo_shrubs Precip alphanumeric yyyy g/m2/yr g/m2/yr mm cpr5 1970 182 115 172 cpr5 1971 114 82 254 ... |
Table 6. Column headings in NPP file: cpr6_npp.txt.
| COLUMN HEADING | DEFINITION | UNITS |
|---|---|---|
| Site | Site where data were gathered (code refers to site identification). | alphnumeric |
| Year | Year in which data were collected | yyyy |
| AGbiomass | Live and attached-dead biomass of grasses, sedges, and forbs reported as air-dry forage production | g/m2 |
| AGbiomass_SD | Standard deviation of AGbiomass | |
| field_samples | Number of plots sampled each year | numeric |
| ANPP_FE | Oven-dry ANPP based on field estimates of forage production | g/m2/yr |
| ANPP_OD | Air-dry forage production converted to oven-dry ANPP using the equation ANPP_OD = 46 + 0.76 (forage production) | |
| Precip | Total annual precipitation | mm |
| Temp | Annual mean air temperature | degrees C |
Sample NPP Data Record: cpr6_npp.txt
|
Site Year AGbiomass Agbiomass_SD field_samples ANPP_FE ANPP_OD Precip Temp alphanumeric yyyy g/m2 g/m2 numeric g/m2/yr g/m2/yr mm degrees_C cpr6 1939 50 12.1 11 -999 84 117 9.3 cpr6 1940 -999 -999 0 -999 -999 339 8.85 cpr6 1941 74 11.3 10 -999 102 325 8.43 cpr6 1942 123 33.3 7 -999 139 371 8.07 cpr6 1943 123 32.6 13 -999 140 790 8.8 . ... |
Table 7. Column headings in NPP file: cpr7_npp.txt.
| COLUMN HEADING | DEFINITION | UNITS |
|---|---|---|
| Site | Site where data were gathered (code refers to site identification). | alphnumeric |
| Year | Year in which data were collected | yyyy |
| ANPP | Sum of oven-dried harvested peak live weights of individual species | g/m2/yr |
| BNPP | Sum of oven-dried harvested crown biomass and positive increments of root biomass by depth (0-20 cm) during growing season | |
| TNPP | ANPP + BNPP |
Sample NPP Data Record: cpr7_npp.txt
| Site Year ANPP BNPP TNPP alphanumeric yyyy g/m2/yr g/m2/yr g/m2/yr cpr7 1970 160 411 571 cpr7 1971 218 686 904 ... |
Table 8. Column headings in NPP file: cpr8_npp.txt.
| COLUMN HEADING | DEFINITION | UNITS |
|---|---|---|
| Site | Site where data were gathered (code refers to site identification). | alphnumeric |
| Year | Year in which data were collected | yyyy |
| ANPP_w_shrubs_harvest | Sum of harvested peak standing crop current-year biomass with shrubs | g/m2/yr |
| ANPP_wo_shrubs_harvest | Sum of harvested peak standing crop current-year biomass without shrubs | |
| BNPP_harvest | Sum of harvested positive increments of root biomass (0-20 cm) | |
| ANPP_14C_method1 | Sum of green tissue + dead + litter production based on 14C turnover. See note. | |
| Crown_NPP_14C_method1 | Crown production based on 14C turnover. See note. | |
| Root_NPP_14C_method1 | Root production by depth (0-20 cm) based on 14C turnover. See note. | |
| Precip_Apr_Sept | Precipitation amount during growing season | mm |
Note: 1NPP estimates from 14C turnover method described in Milchunas and Lauenroth (1992). 1985 data = Mean biomass from short-term experiment plots divided by number of years for complete turnover. 1987 and 1988 data = Mean biomass from long-term experiment plots divided by number of years for complete turnover. 1986 data = Mean biomass from short-term + long-term plots.
Sample NPP Data Record: cpr8_npp.txt
| Site Year ANPP_w_shrubs_harvest ANPP_wo_shrubs_harvest BNPP_harvest ANPP_14C_method Crown_NPP_14C_method Root_NPP_14C_method Precip_Apr_Sep alphanumeric yyyy g/m2/yr g/m2/yr g/m2/yr g/m2/yr g/m2/yr g/m2/yr mm cpr8 1985 128 112 162 159 74 188 237 cpr8 1986 119 94 182 103 56 183 195 ... |
Climate Data. The climate data are provided in one file (.txt format) (Table 4). The variable values are delimited by semicolons. The first 18 lines are metadata; data records begin on line 19. There are no missing values.
| Site;Temp;Parm; Jan; Feb; Mar; Apr; May; Jun; Jul; Aug; Sep; Oct; Nov; Dec; Year cpr;mean;prec; 6.6; 8.4; 15.4; 28.1; 50.4; 49.8; 48.6; 40.2; 28.5; 16.7; 9.1; 7.7; 309.5 cpr;mean;tmax; 5.0; 6.8; 9.9; 15.4; 20.5; 26.5; 30.6; 29.6; 25.0; 18.6; 10.7; 5.9; 31.0 cpr;mean;tmin;-10.9; -9.0; -5.9; -0.9; 4.4; 9.3; 12.6; 11.8; 6.9; 0.9; -5.3; -9.4; -12.3 cpr;numb;prec; 79.0; 79.0; 79.0; 79.0; 79.0; 79.0; 79.0; 79.0; 79.0; 79.0; 79.0; 79.0; 79.0 cpr;numb;tmax; 79.0; 79.0; 79.0; 79.0; 79.0; 79.0; 79.0; 79.0; 79.0; 79.0; 79.0; 79.0; 79.0 cpr;numb;tmin; 79.0; 79.0; 79.0; 79.0; 79.0; 79.0; 79.0; 79.0; 79.0; 79.0; 79.0; 79.0; 79.0 cpr;stdv;prec; 6.4; 9.1; 14.0; 19.8; 30.9; 33.6; 28.8; 28.8; 22.5; 16.8; 7.6; 10.1; 87.7 cpr;stdv;tmax; 3.3; 3.4; 3.1; 2.7; 2.1; 2.8; 2.0; 1.8; 2.6; 2.7; 2.7; 3.0; 1.8 cpr;stdv;tmin; 3.2; 3.0; 2.5; 2.1; 1.8; 1.8; 1.6; 1.7; 1.9; 1.9; 2.2; 2.6; 2.8 cpr;1912;prec; 12.1; 32.7; 37.2; 43.3; 35.3; 57.6; 30.2; 40.0; 45.4; 39.0; 4.1; 9.8; 386.7 cpr;1912;tmax; 2.9; 4.9; 1.9; 12.1; 20.1; 24.2; 27.9; 27.9; 19.2; 16.5; 11.4; 4.8; 27.9 cpr;1912;tmin;-11.2;-10.0;-10.7; -1.6; 3.1; 7.0; 11.4; 10.7; 3.6; -0.7; -4.7;-11.1; -11.2 cpr;1913;prec; 6.1; 43.9; 17.4; 15.3; 59.7; 26.8; 56.6; 15.9; 50.3; 7.8; 0.4; 64.4; 364.6 cpr;1913;tmax; 3.1; -0.9; 8.6; 16.7; 20.8; 26.5; 29.4; 31.4; 22.1; 14.9; 13.6; -0.9; 31.4 cpr;1913;tmin;-13.8;-16.3; -7.6; -1.7; 4.1; 7.9; 10.2; 11.0; 4.3; -3.2; -5.9;-13.5; -16.3 … Where, Temp (temporal) - specific year or long-term statistic: mean = mean based on all years numb = number of years stdv = standard deviation based on all years Parm (parameter): prec = precipitation for month or year (mm) tmax = mean maximum temperature for month or year (C) tmin = mean minimum temperature for month or year (C) |
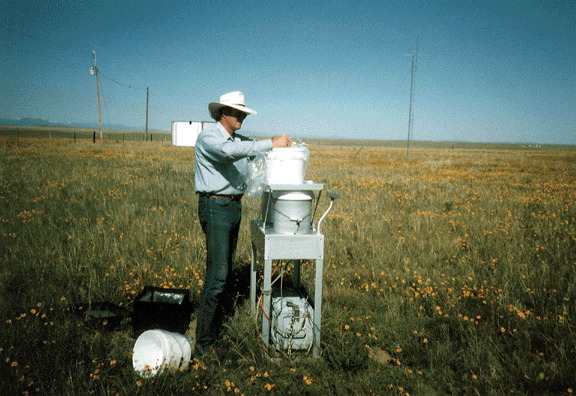
Figure 4. Weather station in grazing exclosure within the CPER grassland site, Colorado, USA. (Mark Lindquist, Colorado State University, is checking a wet/dry deposition gauge. Photograph taken July 1996 by Dr. J.M.O. Scurlock, ORNL).
3. Data Application and Derivation:
The accumulation of biomass, or NPP, is the net gain of carbon by photosynthesis that remains after plant respiration. In this data set, NPP for the shortgrass prairie at CPER/Pawnee was estimated in several ways.
Dodd and Lauenroth (1979) assessed the effects of four different treatments (control (none), irrigated, fertilized, and irrigated + fertilized) on above-ground biomass production. They estimated ANPP as being the sum of seasonal peaks of total standing crops of current-year live + dead above-ground vegetation for six functional plant groups (warm-season grasses, cool-season grasses, warm-season forbs, cool-season forbs, shrubs, and succulents). Lauenroth and Sala (1992) evaluated the relationship between annual forage production and annual and seasonal precipitation and temperature using a long-term data set (52 yr) and constructed a relationship between forage production and ANPP. The Sims and Singh (1978) study was part of the International Biological Programme's (IBP) coordinated comparative research on the structure and function of ten central and western U.S. grasslands. Their estimates of NPP are based on the sum of above-ground peak live + dead weights of individual species harvested during the growing season (=ANPP) and the sum of crown biomass + positive increments of root biomass by depth (0-20 cm) harvested during the growing season (=BNPP). Milchunas and Lauenroth (1992) assessed short-term patterns of carbon allocation and the long-term process of herbivory, death, and decomposition, and compared estimates of above-ground, crown, and root NPP using 14C dilution, 14C turnover, and traditional harvest methods.
Grassland biomass dynamics data are provided for comparison with models and estimation of NPP. Climate data are provided for use in driving ecosystem/NPP models.
4. Quality Assessment:
Net primary production of grasslands is subject to a number of different methods of estimation from biomass data, some of which may be inappropriate for particular biome types. Methodology of estimation/calculation needs to be taken into account, as well as methodology of measurement, when making comparisons between different regions. Errors in biomass measurement may also occur between different study sites. For short time series of data it may be assumed that measurement methodology remains consistent; however, over very long time series changes in staff, tools, etc. may lead to "calibration" errors.
See published literature for each of the studies cited herein for discussions of data quality.
5. Data Acquisition Materials and Methods:
Site Information
Central Plains Experimental Range (CPER), which is administered by the USDA Agricultural Research Service, is located in the north-central Colorado piedmont of North America in the precipitation shadow of the Rocky Mountains, about 40-km south of Cheyenne, Wyoming and 56-km northeast of Fort Collins, Colorado. CPER is located at the western edge of the Pawnee National Grassland which is administered by the USDA Forest Service. Intensive studies requiring careful experimental design are conducted on CPER; more extensive studies requiring larger area but less control are conducted on the Pawnee National Grassland. Collectively, the two administrative units are often referred to as the Pawnee Site.
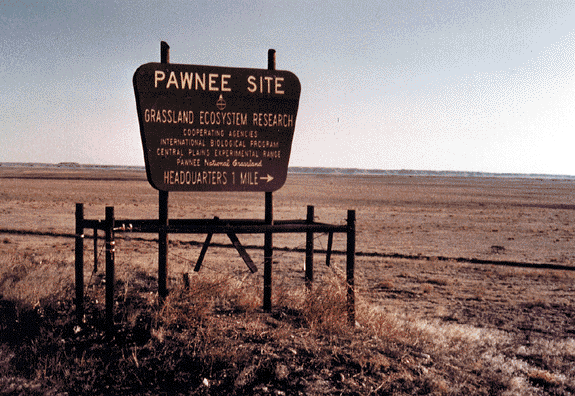
Figure 5. Main entrance from U.S. Highway 85 to the CPER/Pawnee grassland site, Colorado, USA, pictured in the early 1970s. (Sign reads: "Cooperating agencies: International Biological Program, Central Plains Experimental Range, Pawnee National Grassland." Photograph taken by Don Peden, Colorado State University).
The study site is a mid continental semiarid shortgrass prairie with an average annual precipitation of 310 mm (79-year mean). More than 70% of the precipitation occurs as rain from late April through early August, with the largest quantities occurring in May and June. Year-to-year fluctuations in quantity and seasonal distribution are great. Average monthly air temperatures range from -4 degrees C in January to 21 degrees C in July (52-year means).
The soils of this area are derived from granitic outwash from the Rocky Mountains and are weakly developed zonal soils of loam to sandy-loam texture and relatively low fertility. The vegetation is representative of the northern portion of the shortgrass steppe (Lauenroth and Milchunas, 1991). The vegetation, regardless of past grazing history, is dominated by shortgrasses, succulants, and half-shrubs (e.g., Bouteloua gracilis, Opuntia polyacantha, and Artemisia frigida, respectively). About 90 % of the total above-ground biomass is about equally divided between these three major groups of plants. Cool-season grasses and sedges and cool- and warm-season forbs collectively account for less than 10% of the total standing crop (Dodd and Lauenroth, 1979). Studies of this grassland have shown that primary production is limited mainly by spring and summer precipitation and to a lesser extent by the availability of soil mineral nitrogen during shorter periods of the season when soil water is at or near optimal levels for plant growth (Hyder et al., 1975). The shortgrass prairie is typically grazed annually by domestic animals, and would have been grazed by wild buffalo prior to the mid 19th century. Some of the region has been converted to arable crops, and some has subsequently been restored to grassland under the U.S. Conservation Reserve Program (Dodd and Lauenroth, 1979; Lauenroth and Sala, 1992).
Table 9. Site characteristics
| Description | Values |
|---|---|
| mean annual precipitation | 310 mm |
| mean monthly minimum temperature | -10.9 (C) (Jan) |
| mean monthly maximum temperature | 30.6 (C) (July) |
| vegetation type | shortgrass prairie |
| dominant species | Bouteloua gracilis (C4) |
| historical long-term management regime | annual grazing |
| max above-ground live biomass (typical month) | 75 g/m2 (July) |
| soil type | sandy loam |
| soil pH | 6.2 |
| soil texture (sand/ silt/ clay) | 0.70 / 0.15 / 0.15 |
| soil carbon content | 0.8-1.0% OM (0-20 cm) |
| soil nitrogen content | 0.07-0.08% (0-20 cm) |
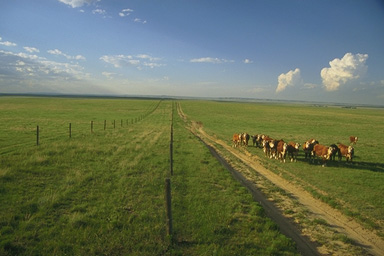
Figure 6. Grazing strip experiment at the CPER grassland site, Colorado, USA. (Photograph taken July 1996 by Andy Bean, Colorado State University: reproduced by kind permission of Chris Wasser, SGS LTER site data manager).
In this data set, biomass production and NPP for the shortgrass prairie at the CPER/Pawnee grassland site were estimated by several different studies using somewhat similar methods. These studies are briefly described below. This data set also includes climate data monitored from 1912 through 1990 at a weather station located at CPER. Measurements included precipitation, minimum temperature, and maximum temperature. Monthly and annual means are reported in the climate file.
Dodd and Lauenroth (1979). Data files: cpr1_npp_r1.txt, cpr2_npp_r1.txt, cpr3_npp_r1.txt, cpr4_npp_r1.txt, and cpr5_npp.txt. The CPER experimental design was a factorial combination of two replications for each treatment: control (no treatment), irrigation, nitrogen fertilization, and water + nitrogen treatment. Each of the eight contiguous cells (see Figure 5) was a one-hectare plot and had a long history of light summer grazing by cattle. For this study, livestock were excluded the year prior to and during the six year study. Estimates of standing above-ground plant biomass were made by harvesting 10 to 12 circular plots of 0.5-m2 each per treatment area at 2-3 week intervals or monthly during the growing season. Total standing crop was determined by species and ANPP was derived from seasonal peaks of total standing crop of current year's production (live + dead).
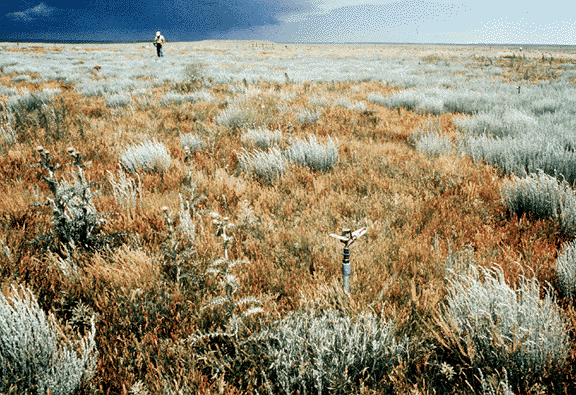
Figure 7. Close-up view of an irrigated plot within the Dodd and Lauenroth (1979) Ecological Stress Analysis (ESA) experimental area at the CPER/Pawnee grassland site, Colorado, USA. (Enhanced growth of the native species Artemisia frigida, Vulpia octoflora and Circium undulatum is evident. A sprinkler is shown in the foreground. Photograph taken 1971 by Larry Nell, Colorado State University).
Lauenroth and Sala (1992). Data file: cpr6_npp.txt. Forage production was estimated annually in CPER from 1939 to 1990 (except 1940 and 1980). The same pastures were not sampled every year; however, most locations were similar in species composition. Samples were collected by harvesting live and attached-dead biomass of grasses, sedges, and forbs from 0.19 m2 quadrats at the end of the growing season. Succulents and shrubs were not harvested. An exception occurred in the years 1969-1972 when masses were visually estimated but not harvested. The average number of locations sampled per year was 11 with a range of three in 1967 to 35 in 1977; no sampling was done in 1940 or 1980. The biomass data presented in the data file represent annual average forage production expressed on an air-dry basis. These data were converted to oven-dry ANPP by the equation ANPP = 46 + 0.76 (Forage Production). Field estimates of oven-dry ANPP are also provided, but for shorter time periods (1970-1975 and 1983-1990).
Sims and Singh (1978). Data file: cpr7_npp.txt. Above- and below-ground biomass was sampled in two ungrazed microwatersheds with similar soil and vegetative characteristics in the Pawnee National Grassland as part of the US/IBP Grassland Biome Programme. The study area had been protected from grazing by large herbivores by exclosure for at least 31 years prior to commencement of the study. Biomass was estimated by harvest methods once each in the pre-growing and post-growing seasons and biweekly during the season of rapid vegetative growth and flowering. Eight plots were harvested in each study area on each sampling date. Non-destructive biomass estimations were also made on a larger number of plots in the same study area on the same sampling date. In 1970, square 0.25-m2 harvest plots were used; in 1971-1972, 0.5-m2 circular harvest quadrats were used. Aerial plant material was clipped at the soil surface, sorted and weighed by species in the field, oven dried in the laboratory, and composited to determine total standing crop. Below-ground biomass was sampled to a depth sufficient to include at least 90% of the root mass. Crown and root samples were collected on eight 0.25-m2 plots located randomly within the same area as above-ground biomass was harvested. Cores 7.5-cm in diameter were taken at a depth of 10 cm at two week intervals during the growing season and 5.0-cm diameter cores were taken twice to a depth of 80 cm. Soil cores containing root samples were separated into 10-cm increments, washed over a 32-mesh screen, dried at 60 degrees C, weighed, and then ashed. ANPP (or shoot production) for each year was determined by the summation of peak live weights of individual species. Crown production was estimated by summing the statistically significant positive increases in crown biomass within a growing season. Root production was estimated by the summation of the significant positive increases in root biomass by depth. BNPP was estimated as annual crown + root production.
Milchunas and Lauenroth (1992). Data file: cpr8_npp.txt. Eight long-term and eight short-term plots (9 m2 and 4 m2, respectively) were located in a level upland site in CPER that had been ungrazed since 1969. Both short- and long-term plots had a 30-cm wide border. The remainder of each plot was divided into 64 squares for long-term plots or 36 squares for short-term plots. Plots were tented and labeled with 14C. Five randomly chosen squares in each of the eight plots were sampled on days after treatment representing early spring, peak live biomass, and late fall production. Above-ground biomass, including litter, and 2 adjacent cores were removed from the center of each of 5 squares per plot (2 cores x 5 squares x 8 plots = 80 cores/date) for each of the short- and long-term groups of plots. The cores were 66.5-mm inside diameter, with one driven to 20 cm and one to 40 cm depth. Sample categories on short-term plots were above-ground green tissue, dead plus litter, crowns, roots, and soil, and for long-term plots were above-ground plus litter, crowns, roots, and soil. ANPP and BNPP (crown + root production) were estimated by both harvest and plant part turnover of 14C mass (14C turnover). See source for details on treatment, sampling, and data calculation methods.
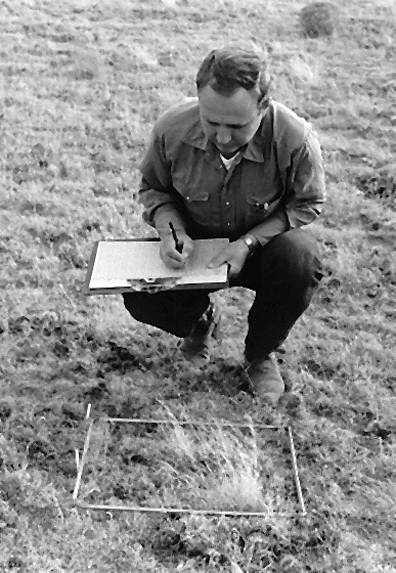
Figure 8. Measurement of above-ground biomass at the CPER/Pawnee grassland site, Colorado, USA. (Dan Uresk, Colorado State University, is scoring the ground cover of key species within the quadrat. Photograph taken 1970-1972 by Dale Bartos, Colorado State University).
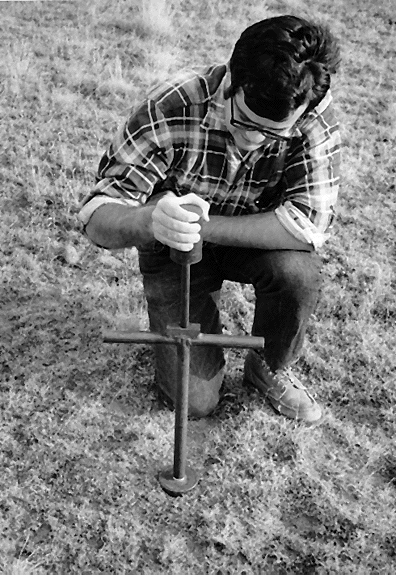
Figure 9. Measurement of below-ground biomass at the CPER/Pawnee grassland site, Colorado, USA. (Dale Bartos, Colorado State University, is using a root core sampler fitted with a slide-hammer. Photograph taken 1970-1972 by Dan Uresk, Colorado State University).
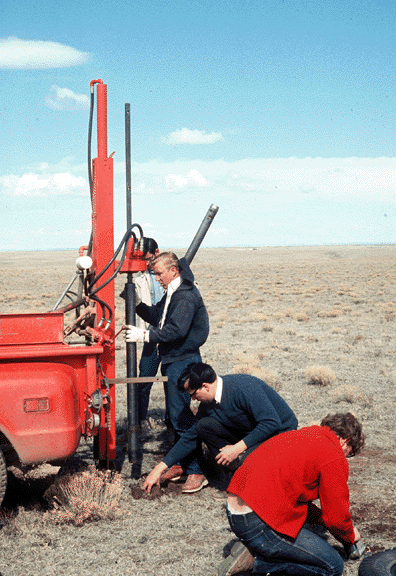
Figure 10. Soil coring apparatus mounted on the back of a pick-up truck at the CPER/Pawnee grassland site, Colorado, USA. (John Leetham, Research Technician, Colorado State University, is operating the soil corer; other persons not identified. Photograph taken April/May 1971 by Larry Nell, Colorado State University).
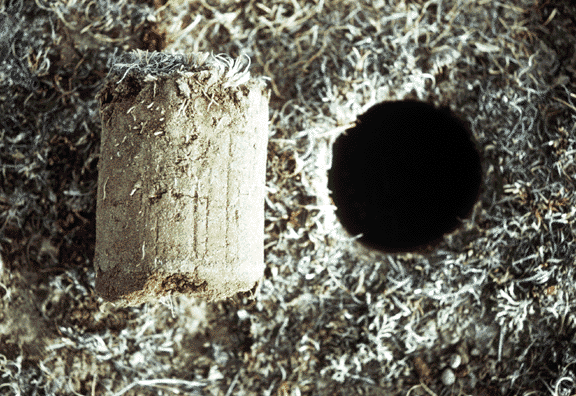
Figure 11. Close-up view of a soil core root sample at the CPER/Pawnee grassland site, Colorado, USA. (Photograph taken 1970 by Dale Bartos, Colorado State University).
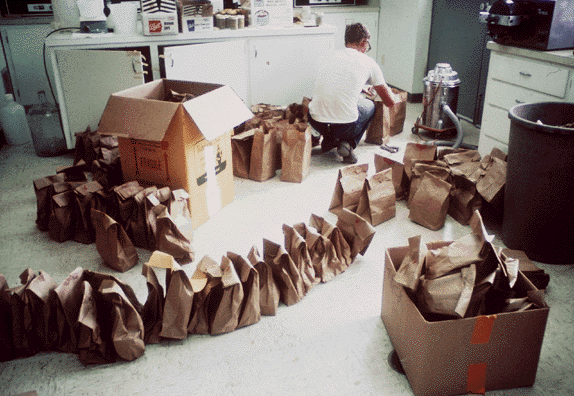
Figure 12. Processing of replicate biomass samples, ready for drying and weighing, in the field laboratory at the CPER/Pawnee grassland site, Colorado, USA. (Photograph taken July 1971 by Larry Nell, Colorado State University).
6. Data Access:
This data set is available through the Oak Ridge National Laboratory (ORNL) Distributed Active Archive Center (DAAC).
Data Archive:
Web Site: http://daac.ornl.gov
Contact for Data Center Access Information:
E-mail: uso@daac.ornl.gov
Telephone: +1 (865) 241-3952
7. References:
Dodd, J.L., and W.K. Lauenroth. 1979. Analysis of the response of a shortgrass ecosystem to stress, pp. 43-58. IN: French, N.R. (ed.). 1979. Perspectives in Grassland Ecology: Results and Applications of the US/IBP Grassland Biome Study. Springer-Verlag, New York. 204 pp.
Esser, G. 2013. NPP Multi-Biome: Global Osnabruck Data, 1937-1981, R1. Data set. Available on-line [http://daac.ornl.gov] from Oak Ridge National Laboratory Distributed Active Archive Center, Oak Ridge, Tennessee, USA. doi:10.3334/ORNLDAAC/214
Hyder, D. N. 1975. Ecological responses of native plants and guidelines for management of shortgrass range (No. 1503). Agricultural Research Service, U.S. Dept. of Agriculture.
Lauenroth, W.K., and O.E. Sala. 1992. Long-term forage production of North American shortgrass steppe. Ecological Applications 2(4): 397-403. doi:10.2307/1941874.
Milchunas, D.G., and W.K. Lauenroth. 1992. Carbon dynamics and estimates of primary production by harvest, 14C Dilution, and 14C Turnover. Ecology 73(2): 593-607. doi:10.2307/1940765.
Olson, R.J., K.R. Johnson, D.L. Zheng, and J.M.O. Scurlock. 2001. Global and Regional Ecosystem Modeling: Databases of Model Drivers and Validation Measurements. ORNL Technical Memorandum TM-2001/196. Oak Ridge National Laboratory, Oak Ridge, Tennessee, U.S.A.
Olson, R.J., J.M.O. Scurlock, S.D. Prince, D.L. Zheng, and K.R. Johnson (eds.). 2013a. NPP Multi-Biome: Global Primary Production Data Initiative Products, R2. Data set. Available on-line [http://daac.ornl.gov] from the Oak Ridge National Laboratory Distributed Active Archive Center, Oak Ridge, Tennessee, USA. doi:10.3334/ORNLDAAC/617.
Olson, R.J., J.M.O. Scurlock, S.D. Prince, D.L. Zheng, and K.R. Johnson (eds.). 2013b. NPP Multi-Biome: NPP and Driver Data for Ecosystem Model-Data Intercomparison, R2. Data set. Available on-line [http://daac.ornl.gov] from the Oak Ridge National Laboratory Distributed Active Archive Center, Oak Ridge, Tennessee, USA. doi:10.3334/ORNLDAAC/615.
Scurlock, J.M.O., and R.J. Olson. 2013. NPP Multi-Biome: Grassland, Boreal Forest, and Tropical Forest Sites, 1939-1996, R1. Data set. Available on-line [http://daac.ornl.gov] from Oak Ridge National Laboratory Distributed Active Archive Center, Oak Ridge, Tennessee, USA. doi:10.3334/ORNLDAAC/653.
Sims, P.L., and J.S. Singh. 1978. The structure and function of ten western North American grasslands. III. Net primary production, turnover and efficiencies of energy capture and water use. Journal of Ecology 66: 573-597. doi:10.2307/2259152
Additional Sources of Information:
Bartos, D., and J. Hughes. 1969. Preliminary methodology and results ofroot biomass sampling on the Pawnee Site. US/IBP Grassland Biome Technical Report No. 2. Colorado State University, Fort Collins, Colorado.
Jameson, D.A. 1969. General description of the Pawnee site. US/IBP Grassland Biome Technical Report No. 1. Colorado State University, Fort Collins, Colorado.
Lauenroth, W.K., and P.L. Sims. 1973. Effects of water and nitrogen stresses on a shortgrass prairie ecosystem. US/IBP Grassland Biome Technical Report No. 232. Colorado State University, Fort Collins, Colorado.
Lauenroth, W.K., J.L. Dodd, and P.L. Sims. 1978. The effects of water-and nitrogen-induced stresses on plant community structure in a semiarid grassland. Oecologia 36(2): 211-222. doi:10.1007/BF00349810
Sims, P.L., J.S. Singh, and W.K. Lauenroth. 1978. The structure and function of ten western North American grasslands. I. Abiotic and vegetational characteristics. Journal of Ecology 66: 251-285. doi:10.2307/2259192
Sims, P.L., D.W. Uresk, D.L. Bartos, and W.K. Lauenroth. 1971. Herbage dynamics on the Pawnee Site: aboveground and belowground dynamics on the four grazing intensity treatments; and preliminary sampling on the ecosystem stress site. US/IBP Grassland Biome Technical Report No. 99. Colorado State University, Fort Collins, Colorado.
Swift, D.M., and N.R. French. 1973. Basic field data collection procedures for the grassland biome. US/IBP Grassland Biome Technical Report No. 145. Colorado State University, Fort Collins, Colorado.
Uresk, D.W., and P.L. Sims. 1969. Preliminary methodology and results for aboveground herbage biomass sampling on the Pawnee Site. US/IBP Grassland Biome Technical Report No. 33. Colorado State University, Fort Collins, Colorado.
8. Data Set Revisions:
Revision Summary:
Data files (cpr1_npp.txt, cpr2_npp.txt, cpr3_npp.txt, and cpr4_npp.txt) have been revised to correct the elevation where above-ground biomass samples were collected. Four new data files have been added. The temporal coverage of this data set has been extended from 1970-1975 to 1939-1990.
Data File Changes:
The elevation where above-ground biomass samples were collected has been corrected to agree with Table 1 in Sims et al. (1978). The data values in cpr1_npp_r1.txt, cpr2_npp_r1.txt, cpr3_npp_r1.txt, and cpr4_npp_r1.txt are now correct.
| ELEVATION (m) | |
|---|---|
| Uncorrected in cpr1_npp.txt, cpr2_npp.txt, cpr3_npp.txt, cpr4_npp.txt | Corrected in cpr1_npp_r1.txt, cpr2_npp_r1.txt, cpr3_npp_r1.txt, cpr4_npp_r1.txt |
| 1,625 | 1,652 |
Data File Additions:
Four new data files have been added to this data set:
| FILE NAME | TEMPORAL COVERAGE | FILE CONTENTS | SOURCE |
|---|---|---|---|
| cpr5_npp.txt | 1970/04/26-1975/08/18 | Annual estimates of above-ground net primary production for control plot in CPER | Dodd and Lauenroth (1979) |
| cpr6_npp.txt | 1939-1990 | Annual estimates of above-ground forage biomass and ANPP for live and attached dead grasses, forbs, and sedges in CPER | Lauenroth and Sala (1992) |
| cpr7_npp.txt | 1970-1972 | ANPP estimates based on sum of harvested peak live weights of individual species during the growing season and BNPP estimates based on sum of harvested crown biomass and positive increments of root biomass by depth (0-20 cm) during growing season at Pawnee | Sims and Singh (1978) |
| cpr8_npp.txt | 1985-1988 | ANPP and BNPP estimates from two methods: harvest clips and cores and 14C turnover in CPER | Milchunas and Lauenroth (1992) | .
Data User Action: If you downloaded the referenced data set from the ORNL DAAC on-line archive before 04-17-2015, you should download it again from the ORNL DAAC.
Revision History:
Original Citation:
Uresk, D., P. L. Sims, and J. L. Dodd. 1996. NPP Grassland: Central Plains Experimental Range (SGS), U.S.A., 1970-1975. Data set. Available on-line [http://daac.ornl.gov] from Oak Ridge National Laboratory Distributed Active Archive Center, Oak Ridge, Tennessee, U.S.A. doi:10.3334/ORNLDAAC/204