Get Data
Summary:
This data set contains four ASCII text files for a 260-hectare humid Trachypogon savanna at the Estacion Biologica de Los Llanos, Calabozo, Venezuela (8.93 N, -67.42 W, Elevation 98 m). Two data files contain monthly estimates of above-ground biomass for the period January 1969 to October 1969, one file for each treatment (burned and unburned plots). These files also provide one estimate of below-ground biomass. Another NPP data file contains monthly estimates of above- and below-ground biomass, LAI, and nitrogen content of living and dead leaves and stems and below-ground biomass for an unburned area of the Calabozo savanna for March 1986 to April 1987. The fourth data file contains precipitation and maximum/minimum temperature data from a nearby weather station at Estacion Biologica de Los Llanos (8.88 N, -67.32 W, Elevation 86 m) for the period 1968-1986.
Harvest methods were used to estimate above- and below-ground biomass. Total NPP (above- plus below-ground productivity) was estimated at 682 g/m2/yr for unburned and 755 g/m2/yr for burned grassland plots in 1969. Later TNPP estimates (1986/87) for the unburned grassland ranged from 823 to 1,310 g/m2/yr.
Revision Notes: Only the documentation for this data set has been modified. The data files have been checked for accuracy and are identical to those originally published in 1998.
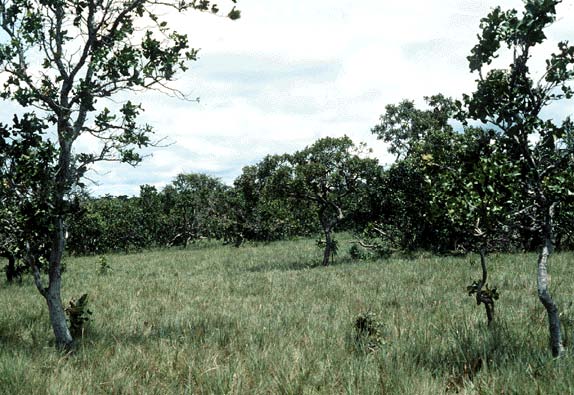
Figure 1. General view of the Trachypogon savanna at the Calabozo grassland site, Venezuela. (Trees include Curatella americana, Bowdichia virgilioides and Byrsonima crassifolia. Photograph taken 1983-85 by Dr. R.A. Montes, Universidad Simon Bolivar, Venezuela).
Additional Documentation:
The NPP data collection contains field measurements of biomass, estimated NPP, and climate data for terrestrial grassland, tropical forest, temperate forest, boreal forest, and tundra sites worldwide. Data were compiled from the published literature for intensively studied and well-documented individual field sites and from a number of previously compiled multi-site, multi-biome data sets of georeferenced NPP estimates. The principal compilation effort (Olson et al., 2001) was sponsored by NASA’s Terrestrial Ecology Program. For more information, please visit the NPP web site at http://daac.ornl.gov/NPP/npp_home.html.
Data Citation:
Cite this data set as follows:
San Jose, J., and R.A. Montes. 2014. NPP Grassland: Calabozo, Venezuela, 1969-1987, R1. Data set. Available on-line [http://daac.ornl.gov] from Oak Ridge National Laboratory Distributed Active Archive Center, Oak Ridge, Tennessee, USA doi:10.3334/ORNLDAAC/206
This data set was originally published as:
San Jose, J., and R.A. Montes. 2013. NPP Grassland: Calabozo, Venezuela, 1969-1987, R1. Data set. Available on-line [http://daac.ornl.gov] from Oak Ridge National Laboratory Distributed Active Archive Center, Oak Ridge, Tennessee, U.S.A
Table of Contents:
- 1 Data Set Overview
- 2 Data Description
- 3 Applications and Derivation
- 4 Quality Assessment
- 5 Acquisition Materials and Methods
- 6 Data Access
- 7 References
1. Data Set Overview:
Project: Net Primary Productivity (NPP)
Productivity of a humid savanna in the Southern Hemisphere was determined at the Estacion Biologica de Los Llanos, Calabozo, Venezuela, beginning in 1969. Much of the research work at this site was carried out by staff from or in association with the Ecology Centre of the Venezuelan Institute for Scientific Research (Centro de Ecologia, Instituto Venezolano de Investigaciones Cientificas - IVIC).
The Calabozo study site (8.93 N, -67.42 W, Elevation 98 m) is located in a Trachypogon savanna about 10-km south-southeast of Calabozo, Guarico State, Venezuella. Calabozo is typical of the Central Eastern Orinoco llanos of Venezuela, which occupy 300,000-500,000 km2 of the grassy plains of northern South America. The llanos have been used for cattle grazing for at least the past 100 years, although forage production is modest and forage quality is poor (low in nutrients). The 260-hectare Calabozo study site has been protected from grazing and burning since 1960.
Monthly data on above-ground live biomass and total dead matter, and a single estimate of total below-ground matter, are available for 1969. Burned and unburned plots were measured, as well as the effect of irrigation during the dry season (San Jose and Medina, 1976). An additional year's data are reported for 1986-1987, including monthly leaf area index, monthly nitrogen dynamics, and functional growth analysis (San Jose et al., 1991). Note that data have been read from published graphs, therefore the least significant digit may be in error.
Above- and below-ground NPP was estimated at 375 g/m2/yr and 307 g/m2/yr, respectively, for a total NPP of 682 g/m2/yr in 1969 for the unburned grassland (Scurlock and Olson, 2012; San Jose and Medina, 1976). Total NPP (above- plus below-ground) was estimated at 755 g/m2/yr for burned plots. Later (1986/87), total NPP estimates for the unburned grassland range from 823 to 1,310 g/m2/yr. Productivity values are also reported in Esser (2013) and Olson et al. (2013a; b), but do not agree with the values given here because different calculation methods were used.
Climate data for Calabozo for 1968-1986 are available from the weather station at Estacion Biologica de Los Llanos (8.88 N, -67.32 W, Elevation 86 m).
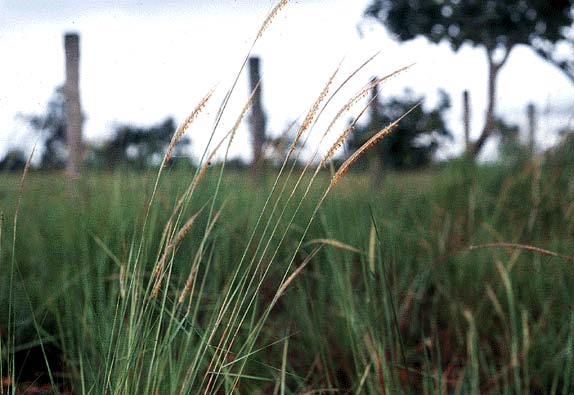
Figure 2. Close-up view of the savanna grass Trachypogon vestitus at the Calabozo grassland site, Venezuela. (Photograph taken 1983-85 by Dr. R.A. Montes, Universidad Simon Bolivar, Venezuela).
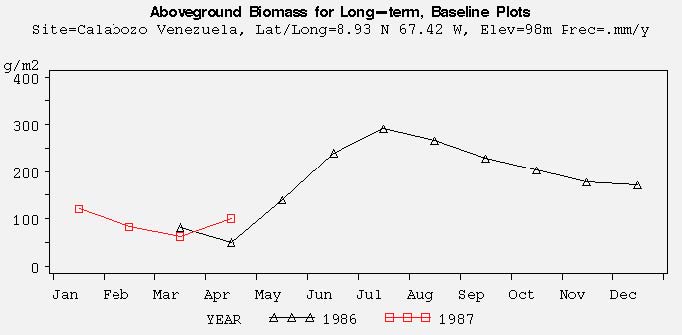
Figure 3. Above-ground biomass dynamics for the Calabozo savanna site, Venezuela.
2. Data Description:
Site: Calabozo, Venezuela
Site Boundaries: (All latitude and longitude given in decimal degrees)
| Site (Region) | Westernmost Longitude | Easternmost Longitude | Northernmost Latitude | Southernmost Latitude | Elevation (m) |
|---|---|---|---|---|---|
| Calabozo, Venezuela | -67.42 | -67.42 | 8.93 | 8.93 | 98 |
Spatial Resolution
Not available.
Temporal Coverage
Biomass measurements were made during two study periods: 1969/01/15 through 1969/10/15; and 1986/03/15 through 1987/04/15. Climate data were available from 1968/01/01 through 1986/12/31.
Temporal Resolution
Above-ground biomass measurements were made monthly in 1969 and in 1986-1987. A single measurement of below-ground biomass was made in 1969. Monthly estimates of below-ground biomass were made in 1986-1987. Climate data are expressed as monthly and annual precipitation amounts (mm) and monthly and annual mean maximum/minimum temperature (degrees C) are available for the 1968-1986 period.
Table 1. Data file descriptions
| FILE NAME | TEMPORAL COVERAGE | FILE CONTENTS |
|---|---|---|
| clb1_npp.txt | 1969/01/15 - 1969/10/15 | Above- and below-ground biomass data for unburned grasslands at Calabozo, Venezuela |
| clb2_npp.txt | 1969/01/15 - 1969/10/15 | Above- and below-ground biomass data for burned grasslands at Calabozo, Venezuela |
| clb3_npp.txt | 1986/03/15 - 1987/04/15 | Above- and below-ground biomass data for unburned grasslands at Calabozo, Venezuela |
| clb_cli.txt | 1968/01/01 - 1986/12/31 | Mean monthly and annual climate data from weather station near Calabozo, Venezuela |
NPP data: Biomass estimates for the Calabozo site are provided in three files (Table 1), one file for each treatment in 1969 (unburned and burned) and another file for unburned treatment in 1986-1987. The data sets are ASCII files (.txt format). The first 18 lines are metadata; data records begin on line 19. The variable values are delimited by semicolons. The value -999.9 is used to denote missing values. All NPP units are in g/m2/year (dry matter weight).
Table 2. Column headings in NPP files for 1969 (clb1_npp.txt and clb2_npp.txt)
| COLUMN HEADING | DEFINITION | UNITS |
|---|---|---|
| Site | Site where data were gathered (code refers to site identification) | Text |
| Treatmt | Long term management of site (code refers to treatment described in metadata in data file) | Text |
| Year | Year in which data were collected | Numeric |
| Mn | Month in which data were collected | |
| Dy | Day on which data were collected | |
| Tyear | Date in decimal year (year plus the Julian date divided by 365) | |
| AGbiomass | Above-ground living biomass | g/m2 |
| AGtotdead | Above-ground dead biomass | |
| AGtotmatter | Above-ground total biomass (live plus dead material) | |
| BGtotmatter | Below-ground total biomass |
Sample NPP Data Record: Unburned Grassland (clb1_npp.txt)
| Site;Treatmt;Year;Mn;Dy;Tyear; AGbiomass;AGtotdead;AGtotmatter;BGtotmatter clb;none;1969;01;15;1969.083; 100.0;1025.0;1125.0;-999.9 clb;none;1969;02;15;1969.167; 50.0;1175.0;1225.0;-999.9 ... |
Sample NPP Data Record: Burned Grassland (clb2_npp.txt)
| Site;Treatmt;Year;Mn;Dy;Tyear; AGbiomass;AGtotdead;AGtotmatter;BGtotmatter clb;burned;1969;01;15;1969.083; 0.0; 0.0; 0.0;-999.9 clb;burned;1969;02;15;1969.167; 27.0; 0.0; 27.0;-999.9 ... |
Table 3. Column headings in NPP file for 1986-1987 (clb3_npp.txt)
| COLUMN HEADING | DEFINITION | UNITS |
|---|---|---|
| Site | Site where data were gathered (code refers to site identification) | Text |
| Treatmt | Long term management of site (code refers to treatment described in metadata in data file) | Text |
| Year | Year in which data were collected | Numeric |
| Mn | Month in which data were collected | |
| Dy | Day on which data were collected | |
| Tyear | Date in decimal year (year plus the Julian date divided by 365) | |
| AGbiomass | Above-ground living biomass | g/m2 |
| AGtotclip | Above-ground total biomass (live plus dead) | |
| AGtotclip_SE | Standard error for above-ground total biomass measurement | |
| BGtotmatter | Below-ground total matter | |
| LAI | Leaf area index | dimensionless |
| N-liveleaf | Nitrogen content of living leaves | g/m2 |
| N-livestem | Nitrogen content of living stems | |
| N-deadleaf | Nitrogen content of dead leaves | |
| N-deadstem | Nitrogen content of dead stems | |
| N-BGtot | Nitrogen content of below-ground biomass |
Sample NPP Data Record: Unburned Grassland (clb3_npp.txt)
| Site;Treatmt;Year;Mn;Dy;Tyear;AGbiomass;AGtotclip;AGtotclip_SE;BGtotmatter;LAI; N-liveleaf;N-livestem;N-deadleaf;N-deadstem;N-BGtot clb;none;1986;03;15;1986.203;82.0;677.0;100.0;228.0;0.124 0.806;0.349;0.349;0.248;1.074 clb;none;1986;04;15;1986.288 50.0;608.0;79.0;222.0;0.084;0.866;0.376;0.409;0.282;0.738 ... |
Note: All data are from San Jose and Medina (1976).
Climate Data. Climate data are provided in one ASCII file (.txt format). The first 18 lines are metadata; data records begin on line 19. The variable values are delimited by semicolons. The value -999.9 is used to denote missing values.
| COLUMN HEADINGS | DEFINITION |
|---|---|
| Site | Unique 3-character code for each site based on the first three consonants in the site name (e.g., clb for Calabozo) |
| Temp (Temporal) |
Indicates whether the values in that row are either long-term (i.e, mulit-year) or annual data for the specified parameter. For multi-year, the values are: mean=mean values (monthly and annual) calculated for the years of data as noted in the documentation numb=number of years of data included in a reported mean value stdv=standard deviation of a mean value Annual data: 19XX=monthly and annual parameter values for the specified year (e.g., 1972) |
| Parm | Parameter, indicates the meteorological data reported in that row. prec-total precipitation for the month or year tmax=maximum temperature for the month or year reported in degrees C tmin=minimum temperature for the month or year reported in degrees C |
|
Description of specific Temp and Parm data values: Long-term data: site;mean;prec; Multi-year mean of total precipitation for each month [Jan, Feb, Mar, …, Dec] and mean of total annual precipitation across all years [Year] (mm) site;mean;tmax; Multi-year mean of maximum temperature for each month [Jan, Feb, Mar, …, Dec] and mean of annual maximum temperature across all years [Year] (C) site;mean;tmin; Multi-year mean of minimum temperature for each month [Jan, Feb, Mar, …, Dec] and mean of annual minimum temperature across all years [Year] (C) … site; numb and stdv; repeat for prec, tmax, and tmin; Annual data: site;19XX;prec; Total precipitation for each month [Jan, Feb, Mar,.....Dec] and total precipitation for the year 19XX [Year] (mm) site;19XX;tmax; Maximum temperature for each month [Jan, Feb, Mar,.....Dec] and maximum for the year 19XX [Year] (C) site;19XX;tmin; Minimum temperature for each month [Jan, Feb, Mar,.....Dec] and minimum for the year 19XX [Year] (C) … site;19XX;(prec, tmax, and tmin); repeat for reported years. Annual data missing value note: If a monthly parm value is missing, the parm value for [Year] is also set to missing (-999.9). |
Sample Climate Data Record
| Site;Temp;Parm; Jan; Feb; Mar; Apr; May; Jun; Jul; Aug; Sep; Oct; Nov; Dec; Year; clb;mean;prec; 3.1;5.9;2.4; 8.0;170.3;203.9;201.0; 247.1;143.4;133.2;52.1;11.3;1251.6; clb;mean;tmax;34.8;35.6;36.2;35.2;33.3;31.4;30.8;31.0;31.8;32.6 33.6;34.2;36.0; clb;mean;tmin;22.5; 23.3;24.4; 24.8; 24.3; 23.5; 22.8; 22.9; 23.2; 23.1; 22.9;22.4; 22.0; clb;numb;prec;18;18;18;18;18;18;18;18;18;18;18;18;18; clb;stdv;prec;6.6; 5.3;7.3;58.6;86.9;75.2;88.4;66.6;66.9;67.7;40.0;15.3;249.6; clb;stdv;tmax;1.2;1.3;1.1;1.0; 0.9;1.3; 1.1;1.1; .1;1.2;1.4;1.3;1.1; clb;1968;tmax;-999.9;-999.9;-999.9;-999.9;-999.9;-999.9;-999.9;-999.9;-999.9;32.7;33.5;34.2;34.2; clb;1968;tmin;-999.9;-999.9;-999.9;-999.9;-999.9;-999.9;-999.9;-999.9;-999.9;22.4;22.0;21.6;21.6; clb;1969;tmax;34.4; 34.7;36.3;34.1;32.3;30.6; 29.5; 29.8;31.3;30.9;32.2;33.1;36.3; clb;1969;tmin;23.0; 23.7;24.6;24.9;24.5; 23.5; 22.8; 22.6;23.2;22.9;23.0;22.5;22.5; … Where, Temp (temporal) - specific year or long-term statistic: mean = mean based on all years numb = number of years stdv = standard deviation based on all years Parm (parameter): prec = precipitation for month or year (mm) tmax = mean maximum temperature for month or year (C) tmin = mean minimum temperature for month or year (C) |
3. Data Application and Derivation:
The accumulation of biomass, or NPP, is the net gain of carbon by photosynthesis that remains after plant respiration. While there are many fates for this carbon, this data set accounts for above- and below-ground biomass production.
The grassland monthly biomass dynamics data for the Calabozo grassland site are provided for comparison with models and estimation of NPP. Climate data are provided for use in driving ecosystem/NPP models.
4. Quality Assessment:
None available.
Sources of Error
The data have been read from published graphs, therefore the least significant digit may be in error.
5. Data Acquisition Materials and Methods:
Site Information
The 260-hectare Calabozo grassland study site is located at the Estacion Biologica de Los Llanos, Calabozo (elevation 98 m), about 10 km south-southeast of Calabozo, Guarico State, Venezuela. The grassland is typical of the Central Eastern Orinoco llanos of Venezuela that occupy 300,000-500,000 km2 of the grassy plains of northern South America. Calabozo is classified as a closed bush island savanna (modified Bailey ecoregion humid savanna, #414/415). The dominant vegetation species is Trachypogon vestitus (C4) with scattered trees including Curatella americana, Bowdichia virgilioides, and Byrsonima crassifolia. The soil type at Calabozo is Ultisol/oxisol (sand/silt/clay 0.51/0.22/0.27; pH 3.9/4.2). The soil carbon content is 0.6-1.2% OM.
The Venezuelan llanos have been used for cattle grazing for at least the past 100 years, although forage production is modest and forage quality is poor because of low nutrients in the soil. The Calabozo grassland study site has been protected from grazing and burning since 1960, although occasional natural fires ignite during the dry season.
Methods
The Calabozo study site had two treatments during the 1969 study period: unburned (clb1_npp.txt) and burned (clb2_npp.txt). The study site was unburned during the 1986-1987 study period (clb3_npp.txt).
Monthly data on above-ground live biomass and total dead matter, and a single estimate of total below-ground matter, are available for 1969. Burned and unburned plots were measured, as well as the effect of irrigation during the dry season (San Jose and Medina, 1976). An additional year's data were reported for 1986-1987, including monthly leaf area index, monthly nitrogen dynamics, and functional growth analysis (San Jose et al., 1991). Note that data have been read from published graphs, therefore the least significant digit may be in error.
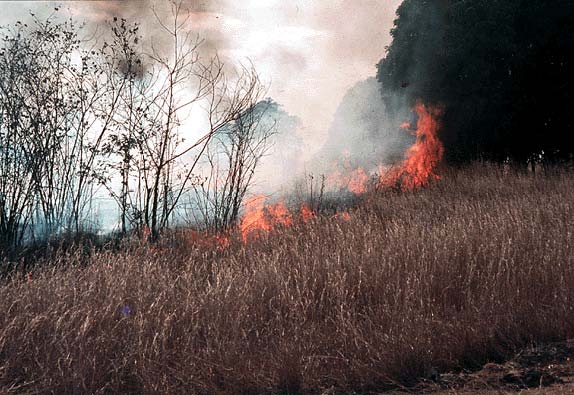
Figure 4. Occasional fire during the dry season at the Calabozo grassland site, Venezuela. (Photograph taken 1983- 85 by Dr. R.A. Montes, Universidad Simon Bolivar, Venezuela).
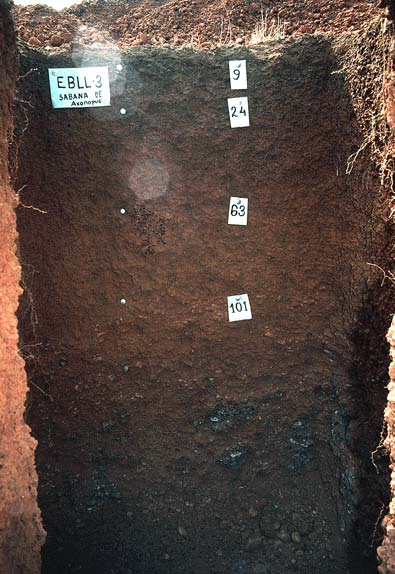
Figure 5. Soil profile of the Trachypogon savanna at the Calabozo grassland site, Venezuela. (Photograph taken 1983-85 by Dr. R.A. Montes, Universidad Simon Bolivar, Venezuela).
Climate
Climate data for Calabozo are available from the weather station at Estacion Biologica de Los Llanos (8.88 N, -67.32 W, Elevation 86 m) for the period 1968 through 1986. The climate of this humid savanna is characterized by mean annual precipitation of 1,257 mm with mean annual minimum-maximum temperatures of 22.0-36.0 C, based on the long-term climatic record (1968-1986) in this data set.
The climate data accompanying this NPP data set was compiled from daily observations of Tmax, Tmin, and precip amount.
For a given month, the maximum value of the daily Tmax for that month and the minimum value of the Tmin for that month is provided. For the year, the maximum value of the monthly Tmax is the annual Tmax and for the year the minimum value of the monthly Tmin values is the annual Tmin. Daily precipitation amount is summed to yield a monthly precipitation amount and the monthly precipitation is summed to provide an annual precipitation amount.
The multi-year mean monthly Tmax is the average of the Tmax values for that month for each year of the record. For example the mean monthly Tmax for April is the mean of each April’s Tmax for the observation period of record. Mean monthly Tmin and Mean monthly precip amount are calculated similarly.
6. Data Access:
This data is available through the Oak Ridge National Laboratory (ORNL) Distributed Active Archive Center (DAAC).
Data Archive Center:
Contact for Data Center Access Information:
E-mail: uso@daac.ornl.gov
Telephone: +1 (865) 241-3952
7. References:
Olson, R.J., K.R. Johnson, D.L. Zheng, and J.M.O. Scurlock. 2001. Global and Regional Ecosystem Modeling: Databases of Model Drivers and Validation Measurements. ORNL Technical Memorandum TM-2001/196. Oak Ridge National Laboratory, Oak Ridge, Tennessee, U.S.A.
San Jose, J.J., and Y.E. Medina. 1976. Organic matter production in the Trachypogon savanna at Calabozo, Venezuela. Tropical Ecology 17: 113-124.
San Jose, J.J., R. Montes, and N. Nikonova-Crespo. 1991. Carbon dioxide and ammonia exchange in the Trachypogon savannas of the Orinoco Llanos. Annals of Botany 68, 321-328.
Additional Sources of Information:
Esser, G. 2013. NPP Multi-Biome: Global Osnabruck Data, 1937-1981. Data set. Available on-line [http://daac.ornl.gov] from Oak Ridge National Laboratory Distributed Active Archive Center, Oak Ridge, Tennessee, USA. doi:10.3334/ORNLDAAC/214
Olson, R.J., J.M.O. Scurlock, S.D. Prince, D.L. Zheng, and K.R. Johnson (eds.). 2013a. NPP Multi-Biome: Global Primary Production Data Initiative Products, R2. Data set. Available on-line [http://daac.ornl.gov] from the Oak Ridge National Laboratory Distributed Active Archive Center, Oak Ridge, Tennessee, USA. doi:10.3334/ORNLDAAC/617
Olson, R.J., J.M.O. Scurlock, S.D. Prince, D.L. Zheng, and K.R. Johnson (eds.). 2013b. NPP Multi-Biome: NPP and Driver Data for Ecosystem Model-Data Intercomparison, R2. Data set. Available on-line [http://daac.ornl.gov] from the Oak Ridge National Laboratory Distributed Active Archive Center, Oak Ridge, Tennessee, USA. doi:10.3334/ORNLDAAC/615
San Jose, J.J., and R. Montes. 1992. Rainfall partitioning by a semideciduous forest grove in the savannas of the Orinoco Llanos, Venezuela. J. Hydrology 132, 249-261. Sarmiento, G. 1984. The Ecology of Neotropical Savannas. Harvard University Press, Cambridge, Mass. 235 pp.
Scurlock, J.M.O., and R.J. Olson. 2002. Terrestrial net primary productivity – A brief history and a new worldwide database. Environ. Rev. 10(2): 91-109. doi:10.1139/a02-002
Scurlock, J.M.O., and R.J. Olson. 2013. NPP Multi-Biome: Grassland, Boreal Forest, and Tropical Forest Sites, 1939-1996, R1. Data set. Available on-line [http://daac.ornl.gov] from Oak Ridge National Laboratory Distributed Active Archive Center, Oak Ridge, Tennessee, USA. doi:10.3334/ORNLDAAC/653
Scurlock, J.M.O., K. Johnson, and R.J. Olson. 2002. Estimating net primary productivity from grassland biomass dynamics measurements. Global Change Biology 8(8): 736-753. DOI: 10.1046/j.1365-2486.2002.00512.x