Get Data
Summary:
This data set contains five data files (.txt format). Three data files provide net primary productivity (NPP) estimates for a tropical dry deciduous forest within the 3,300-ha Chamela Biological Station, Mexico. There is one file for each of the three permanent watershed plots located along an elevational gradient from 60 to 160-m above sea level. NPP was estimated from field measurements obtained during wet and dry seasons between 1982 and 1995. A fourth NPP data file provides average nutrient fluxes into and out of five watersheds. The fifth file provides precipitation and minimum/maximum temperature data from measurements obtained onsite.
Detailed data are available for above-ground NPP (ANPP) (fine litterfall, wood increment, and leaf herbivory plus an estimation of understory production), and below-ground NPP (BNPP) (fine root production and root increment). Biomass data and nutrient inputs/outputs (P, K, Ca, Mg) averaged from five watersheds are also included in the data set.
Estimated ANPP ranged from 611 to 808 g/m2/year between the three sub-sites (average 682 g/m2/year), and total NPP ranged from 1,119 to 1,353 g/m2/year (average 1,206 g/m2/year). These estimates are thought to represent the lower bounds of NPP because root and stem herbivory have not been taken into account, although leaf herbivory is included.
Revision Notes: Only the documentation for this data set has been modified. The data files have been checked for accuracy and are identical to those originally published in 2001.
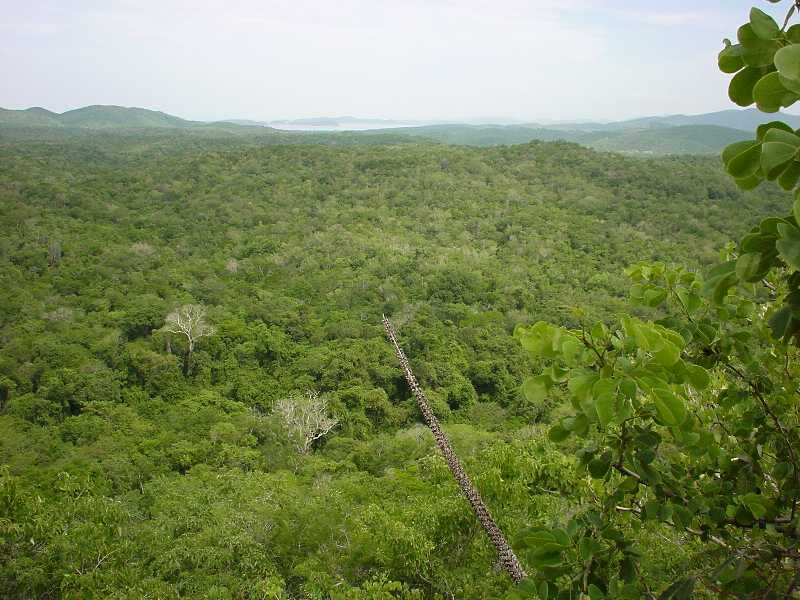
Figure1. View looking roughly North-West from the upper part of Watershed I, during the rainy season at the Chamela tropical forest study site, Mexico. (The Pacific coast at Bahia de Chamela can just be seen on the horizon in the center of the picture. Photograph taken July 2000 by Dr. A. Martinez-Yrizar, Instituto de Ecologia, Universidad Nacional Autonoma de Mexico).
Additional Documentation:
The NPP data collection contains field measurements of biomass, estimated NPP, and climate data for terrestrial grassland, tropical forest, boreal forest, and tundra sites worldwide. Data were compiled from the published literature for intensively studied and well-documented individual field sites and from a number of previously compiled multi-site, multi-biome data sets of georeferenced NPP estimates. The principal compilation effort (Olson et al., 2001) was sponsored by the NASA Terrestrial Ecology Program. For more information, please visit the NPP web site at http://daac.ornl.gov/NPP/npp_home.html.
Data Citation:
Cite this data set as follows:
Maass, M., and A. Martinez-Yrizar. 2013. NPP Tropical Forest: Chamela, Mexico, 1982-1995, R1. Data set. Available on-line [http://daac.ornl.gov] from Oak Ridge National Laboratory Distributed Active Archive Center, Oak Ridge, Tennessee, USA doi:10.3334/ORNLDAAC/578
This data set was originally published as:
Maass, M., and A. Martinez-Yrizar. 2001. NPP Tropical Forest: Chamela, Mexico, 1982-1995. Data set. Available on-line [http://daac.ornl.gov] from Oak Ridge National Laboratory Distributed Active Archive Center, Oak Ridge, Tennessee, U.S.A.
Table of Contents:
- 1 Data Set Overview
- 2 Data Description
- 3 Applications and Derivation
- 4 Quality Assessment
- 5 Acquisition Materials and Methods
- 6 Data Access
- 7 References
1. Data Set Overview:
Project: Net Primary Productivity (NPP)
The NPP measurement presented here is based on the integration of ecosystem data obtained between 1982 and 1995. It includes estimates of ANPP (sum of fine litterfall, wood increment, and leaf herbivory plus an estimation of understory production) plus BNPP (sum of fine root production and root increment).
The Biosphere Reserve Chamela-Cuixmala, Jalisco, is situated near the Pacific coast of Mexico (19.50 N 105.02 W), 2-km inland and about 40-km south of the town of Tomatlan. This area is characterized by annual rainfall of around 780-mm, distributed mainly from mid-June to October, and a mean temperature of about 25 degrees C, with less than a 5 degree C difference between the warmest and coolest months. The vegetation is highly diverse, including about 700 plant species (of which over 180 are trees), and there is a well-developed understory of shrubs. One of the most remarkable features is the seasonality of leaf fall, with most species remaining leafless for several months during the dry season. Tropical deciduous forest is widespread in Mexico, covering large tracts along the Pacific slopes from the state of Sonora in the north to Chiapas in the south; it is also found in the northern part of the Yucatan peninsula. The study sites are located within the 3,300-ha Chamela Biological Station (within the Reserve) which is thought to have been undisturbed for several hundred years. There are no records or evidence of either natural or anthropogenic fire.
Structural and functional parameters of the forest have been measured on five contiguous watersheds (Ws-I to Ws-V), each 12-28 ha in size. Most of the measurements of NPP were carried out on three 2,400-m2 study plots in Watershed I located along an elevational gradient (60-160-m): lower site (a permanent plot of at the bottom of the 15.9-ha watershed); middle site (located in the mid-portion of the watershed); and upper site (a permanent plot located in its upper portion).
Estimated ANPP for Chamela ranged from 611 to 808 g/m2/year among the three sub-sites (average 682 g/m2/year), and total NPP ranged from 1,119 to 1,353 g/m2/year (average 1,206 g/m2/year) (Martinez-Yrizar et al., 1992; 1996; Scurlock and Olson, 2013). These estimates are thought to represent the lower bounds of NPP because root and stem herbivory have not been taken into account, although leaf herbivory is included.
ANPP, BNPP, and TNPP values reported in Olson et al. (2013a, b) and Clark et al. (2013a, b) differ from values presented herein due to different calculation methods. (Table 1).
Table 1. ANPP, BNPP, and TNPP values reported by various published data sources
| File Name or Description | Data Source(s) | Sub-Site | ANPP | BNPP | TNPP |
|---|---|---|---|---|---|
| gC/m2/year | |||||
| chm1_npp.txt | Martinez-Yrizar et al. (1996)1 | chm lower plot | 404 | 273 | 677 |
| chm2_npp.txt | chm middle plot | 314 | 260 | 573 | |
| chm3_npp.txt | chm upper plot | 306 | 254 | 560 | |
NPP_Multibiome_EnvReview | Scurlock and Olson (2012) based on Martinez-Yrizar et al. (1996)1 | ses (average of the three sub-sites) | 341 | 262 | 603 |
| GPPDI_ClassA_NPP_162_R2.csv | Olson et al. (2013a); Clark et al. (2013a)2 based on Martinez-Yrizar et al. (1996) | Class A 68 (MI 65) (lower plot) | 402 | 280 | 682 |
| Class A 68 (MI 66) (middle plot) | 333 | 232 | 564 | ||
| Class A 68 (MI 67) (upper plot) | 322 | 524 | 547 | ||
| EMDI_ClassA_NPP_81_R2.csv | Olson et al. (2012b);Clark et al. (2001a)2 based on Martinez-Yrizar et al. (1996) | Class A 68 (average of the three sub-sites) | 352 | 246 | 598 |
| Table 1 in Clark et al. (2001a) | Clark et al. (2001a)2 based on Martinez-Yrizar et al. (1996) | Chamela, lower plot | 400 | 80-480 (av 280) | 480-880 (av 680) |
| Chamela, middle plot | 330 | 70-400 (av 235) | 400-730 (av 565) | ||
| Chamela, upper plot | 320 | 60-390 (av 225) | 390-710 (av 550) | ||
| tropfornpp.csv | Clark et al. (2001b)3 based on Martinez-Yrizar et al. (1992; 1996) | Chamela, lower plot | 391 | NA | NA |
| Chamela, middle plot | 300 | NA | NA | ||
| Chamela, upper plot | 293 | NA | NA | ||
Notes: NA = Not available. MI = Measurement ID number.
The differences in NPP values reported in this table are mainly due to differences in calculation methods, as explained in these notes. Please consult original references for details.
1For this table, NPP data from the original data source were converted from grams of dry weight per meter square per year to grams of carbon per meter square per year using a conversion factor of 0.5.
The ANPP estimate is based on field measurement of fine litterfall accumulation + wood biomass increment + herbivory loss.
The BNPP estimate is based on fine root production + root biomass increment.
TNPP = ANPP + BNPP.
2Clark et al. (2001a) used a different approach to calculate net primary production values. ANPP was calculated by summing reported above-ground biomass increment + reported fine litterfall + estimated losses to consumers + estimated VOC emissions. BNPP was calculated by summing 0.2 x estimated ANPP for a low BNPP estimate + 1.2 x estimated ANPP for a high BNPP estimate. TNPP was calculated as the range between the low and high values of ANPP + BNPP. Average BNPP and TNPP estimates were also calculated. See Clark et al. (2001a) for a discussion of calculation methods, including how unmeasured components of ANPP were estimated and the basis for setting bounds on BNPP.
3ANPP was calculated as the sum of litterfall + above-ground biomass increment + herbivory, using a carbon conversion factor of 0.5.
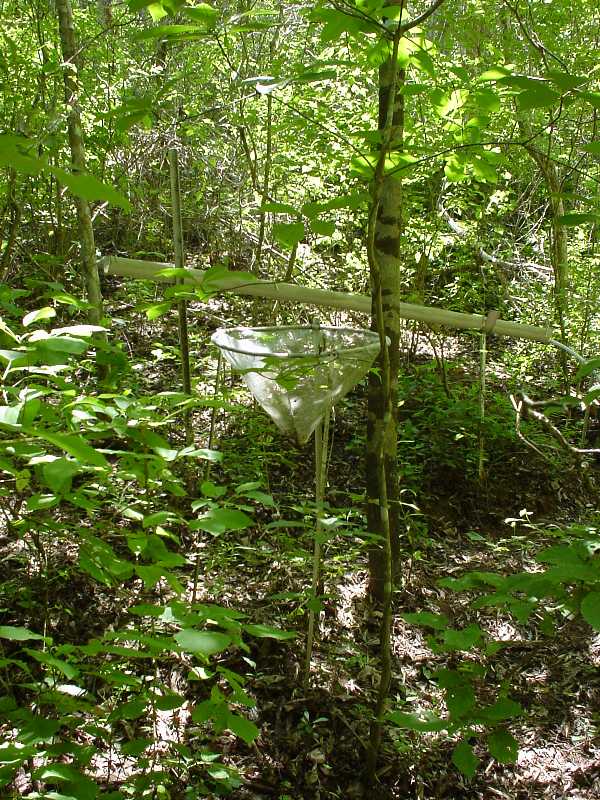
Figure 2. Litterfall trap (foreground) and throughfall collector (background) under the canopy during the rainy season at the Chamela tropical forest study site, Mexico. (Photograph taken July 2000 by Dr. A. Martinez-Yrizar, Instituto de Ecologia, Universidad Nacional Autonoma de Mexico).
2. Data Description:
Spatial Coverage
Site: Chamela, Mexico
Site Boundaries:(All latitude and longitude given in decimal degrees)
| Site (Region) | Westernmost Longitude | Easternmost Longitude | Northernmost Latitude | Southernmost Latitude | Elevation (m) |
|---|---|---|---|---|---|
| Chamela, Mexico | -105.02 | -105.02 | 19.50 | 19.50 | 60-160 |
Site Information
The NPP study area is located in the 13,142-ha Chamela-Cuixmala Biosphere Reserve which was established in 1993. The land is mountainous with rolling hills and alluvial plains and contains low to medium dry tropical deciduous forest, wetlands, and mangroves. The name of this protected area is derived from the small town of Chamela, which was an important port many decades ago, and the Cuixmala River, which is the largest of all the rivers in the region and acts as a natural boundary for the reserve. The Autonomous University of Mexico and the Cuixmala Ecological Foundation, A.C own the majority of the land in the reserve.
The NPP studies were conducted at the 3,300-ha Chamela Biological Station (located within the Chamela-Cuixmala Biosphere Reserve) which includes a 1,600-ha undisturbed forest reserve. Within the field station, five contiguous small watersheds (12-28 ha each) have been gauged for long-term ecosystem research. On one of the watersheds (Watershed I), three permanent plots were established for detailed analyses of ecosystem processes, including these NPP studies. The general characteristics of each plot are shown in Table 2.
Table 2. Site characteristics of permanent sampling plots in Watershed I within Chamela-Cuixmala Biosphere Reserve
| Parameter | Units | Sampling plots | Source | ||
|---|---|---|---|---|---|
| Lower | Middle | Upper | |||
| Elevation | m above sea level | 60-80 | 120-140 | 140-160 | Galicia (1992) |
| Slope range | degrees | 16-30 | 8-16 | 8-16 | Galicia (1992) |
| Soil depth | cm | 25-30 | 15-25 | 40-45 | Galicia (1992) |
| Soil organic matter | % | 3.0-3.5 | 2.5-3.0 | 2.0-2.5 | Galicia (1992) |
| Tree density | individuals/ha | 2,113 | 3,225 | 2,492 | Perez-Jimenez et al. (unpublished data) |
| Number of trees and shrubs | species/plot | 88 | 78 | 57 | Perez-Jimenez et al. (unpublished data) |
| Basal area | m2/ha | 19.77 | 17.18 | 11.22 | Perez-Jimenez et al. (unpublished data) |
| Average dbh increment | cm/yr | 0.29 | 0.19 | 0.20 | Perez-Jimenez et al. (unpublished data) |
| Average tree height | m | 6.2 | 4.9 | 5.1 | Perez-Jimenez et al. (unpublished data) |
| Litterfall | g/m2/year | 421 | 319 | 329 | Martinez-Yrizar et al. (unpublished data) as reported in Martinez-Yrizar et al. (1996) |
| Specific leaf area (SLA) | cm2/g | 203 | 188 | 154 | Maass et al. (1995) |
| LAI (litter-LAI) | m2/m2 | 5.4 | 3.8 | 3.3 | Maass et al. (1995) |
Notes: Paired values indicate range. Litterfall = mean annual amounts for 10-year period (June 1982-May 1992). LAI = maximum for the year.
The predominant vegetation at Chamela is the Tropical Deciduous Forest type of Rzedowski (1978) (modified Bailey ecoregion Forest-meadow-paramo, #M421). This is a dense forest, 4-15-m tall, with a well-developed understory of shrubs. The phenology of the forest is strongly seasonal. With few exceptions, the species bear no leaves for several months during the dry season each year (November to mid-June).
The most important species in the lower study plot are Thouinidium decandrum, Guapira macrocarpa, Astronium graveolens, Trichiliain trifolia, and Casearia corymbosa. In the middle plot, the dominant species are G. macrocarpa, Lonchocarpus eriocarinalis, Plumeria rubra, Piptadenia constricta, and Bursera instabilis, and in the upper plot, they are G. macrocarpa, P. rubra, L. constrictus, B. instabilis, and Colubrina heteroneura.
Soils consists of a 50-100-cm deep sandy loam with a gravely structure (clay 12%, loam 8%, sand 80%) and low organic matter content (1-5%). The pH values measures 6.0 to 7.0. A poorly developed A horizon (5-cm depth) containing the decomposing litter changes gradually into mineral soil. Towards the end of the drought period, the forest floor is covered by a 2-5 cm litter. A hardpan at a depth of 50-80-cm severely limits vertical root growth.
Climate data are available from a meteorological tower located in the Chamela-Cuixmala Biosphere Reserve. Mean annual precipitation over the 1983-1999 period was 780 mm. The dry season extends from the end of November to mid-June; August and September are the wettest months. Mean maximum air temperature was 32 degrees C for the 1995-1998 period; mean minimum air temperature was 18 degrees C.
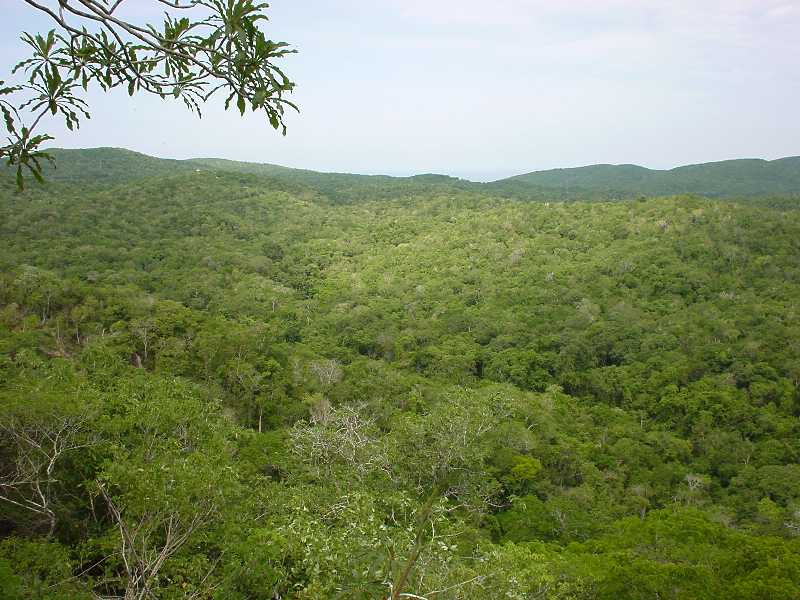
Figure 3. Another view looking roughly North-West from the upper part of Watershed I, during the rainy season at the Chamela tropical forest study site, Mexico. (The hanging branches in the foreground are Plumeria sp., a common tree in the Chamela watersheds. Photograph taken July 2000 by Dr. A. Martinez-Yrizar, Instituto de Ecologia, Universidad Nacional Autonoma de Mexico).
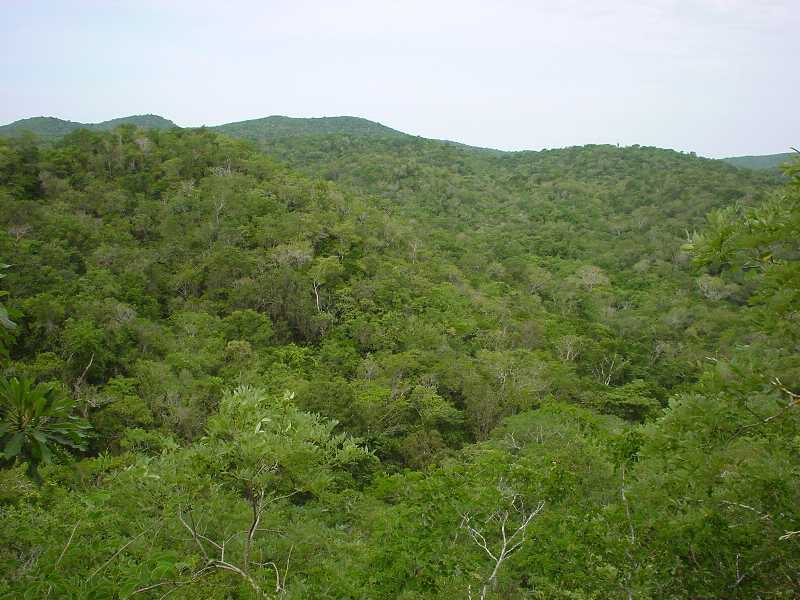
Figure 4. Another view looking roughly North-West from the upper part of Watershed I, during the rainy season at the Chamela tropical forest study site, Mexico. (Note here, and in Figures 1 and 3, the presence of white branches and entire light-colored trees within the canopy. These may be trees still leafless or just starting to put out new leaves following the start of the rainy season. Only 3 weeks earlier the whole forest was leafless; maximum leaf area index would not be reached until September. Photograph taken July 2000 by Dr. A. Martinez-Yrizar, Instituto de Ecologia, Universidad Nacional Autonoma de Mexico).
Spatial Resolution
The harvest plot size of Martinez et al. (1992) for trees > 3.0 cm dbh was 1,000-m2 (50-m x 20-m subdivided into 40 plots, each 5-m x 5-m). For understory (< 3.0 cm dbh), subplots were 3-m x 2-m. The permanent watershed plots are each about 2,400-m2. Above-ground biomass sites of Castellanous et al. (1991) were 100-m2 (10-m x 10-m); below-ground coarse root biomass was excavated from 0.5-m x 2.0-m trenches (60-80 cm deep). Fine roots were extracted from soil cores (40-cm depth; 552-cm3 volume) in 100-m2 sites (Kummerow et al., 1990). Litter traps were 50-cm in diameter (area 0.1963-m2). Nutrient samples were collected at 1,000-m2 watershed plots.
Temporal Coverage
Destructive sampling took place in 1991 outside of but ecologically similar to the middle plot in Watershed I. Nondestructive above-ground biomass studies occurred between 1982 and 1992. Seasonal LAI was determined from May 1990 to May 1992. Litter was collected from June 1982 to May 1992. Herbivory was studied for three consecutive years (1983-1985). Fine and coarse root harvest was made between April 24 and May 6, 1989. Seasonal root growth and soil moisture were also measured in 1989. Nutrient flux was calculated from measurements made over a 6-yr period (1990-1995). Precipitation data are available from January 1983 through October 1999, and maximum/minimum air temperature data are available from January 1995 through December 1998.
Temporal Resolution
Biomass studies were made during both the wet and dry seasons. Destructive sampling and understory harvests was done at the end of the growing season (i.e., December). Other biomass measurements were made from June through November. Stem diameter increases were measured annually during a 2-year period (1988-1990). LAI measurements were made seasonally during May and September of 1990 and monthly from January 1991 to May 1992. Litterfall was collected monthly. Herbivory was studied during the wet season; discrete studies were made in late September each year (1983-1985), and monthly studies were carried out from July to September (1985). Root collections were made at three- to four-week intervals during wet and dry seasons. Soil moisture measurements were made at irregular time intervals. Nutrient samples were collected after every rainfall event.
Above- and below-ground biomass and NPP estimates are based on plant dry matter accumulation, expressed as g/m2 and g/m2/yr (dry matter weight), respectively. Climate data are expressed as monthly and annual precipitation amounts (mm) and monthly and annual average maximum/minimum temperature (C). Monthly and annual climatic means are provided for the 1983-1999 period, where data are available.
Data File Information
Table 3. Data files in this data set archive
| FILE NAME | TEMPORAL COVERAGE | FILE CONTENTS |
|---|---|---|
| chm1_npp.txt | 1982/06/01-1992/05/31 | Tropical forest data for the lower study plot, Watershed I, Chamela, Mexico |
| chm2_npp.txt | 1982/06/01-1992/05/31 | Tropical forest data for the middle study plot, Watershed I, Chamela, Mexico |
| chm3_npp.txt | 1982/06/01-1992/05/31 | Tropical forest data for the upper study plot, Watershed I, Chamela, Mexico |
| chm4_npp.txt | 1990/01/01-1995/12/31 | Annual nutrient input via bulk deposition and annual nutrient output via stream water flow, averaged for middle plot locations from all 5 small experimental watersheds (Ws-I to Ws-V), Chamela, Mexico |
| chm_cli.txt | 1983/01/01-1999/10/31 | Monthly and annual precipitation data from the weather station located at Chamela |
| 1995/01/01-1998/12/31 | Monthly and annual maximum/minimum temperature data from the weather station located at Chamela |
NPP Data. NPP estimates for the Chamela site are provided in three files, one for each sub-site (Table 3). A fourth data file is provided for average nutrient flux into and out of the watersheds. The data sets are text files (.txt format). The variable values are delimited by semicolons. The first 18 lines are metadata; data records begin on line 19. There are no missing values. ANPP, BNPP, and NPP estimates are based on plant dry matter accumulation, expressed as g/m2 and g/m2/yr (dry matter weight), respectively.
Table 4. Column headings in NPP files
| COLUMN HEADING | DEFINITION | UNITS |
|---|---|---|
| Site | Site where data were gathered (code refers to site identification) | Text |
| Treatmt | Code refers to plot location in Watershed I (lower, middle, or upper) | |
| Year | Year in which data were collected | Numeric |
| Month | Month in which data were collected | |
| Day | Day on which data were collected | |
| Parameter | Parameters measured (see definitions in Table 5) | Text |
| amount | Data values | Numeric |
| units | Unit of measure | Text |
| References/Comments | Reference to primary and secondary data sources and/or explanatory comments |
Table 5. Definition of parameters in NPP files chm1_npp.txt, chm2_npp.txt, and chm3_npp.txt
| PARAMETER | DEFINITION | UNITS |
|---|---|---|
| fine_litterfall | Total litterfall, including (1) leaves; (2) woody material (twigs, rachises, separate bark and branch fragments < 2.5-cm diameter); (3) reproductive remains (flowers, fruits, seeds, bracts, etc.); and (4) other material (finely fragmented matter and insect debris) | g/m2/yr |
| wood_increment | Annual above-ground wood biomass increments, determined by measuring stem diameter increases during 1988-1990 of all individuals with dbh > 3.18 cm and converted to mass using the allometric equations developed by Martinez-Yrizar et al. (1992) | |
| leaf_herbivory | Loss of leaf mass to herbivores | |
| ANPP | Above-ground net primary production (sum of fine_litterfall + wood_increment + leaf_herbivory plus an estimation of understory production from Martinez-Yrizar et al. (1992) | |
| fine_root_production | Below-ground production of rootlets (< 1-mm diameter) in periodically sampled soil cores of Kummerow et al. (1990) (only in <chm2_npp.txt>) | |
| root_increment | Below-ground increments of coarse roots calculated by multiplying above-ground wood_increment x 0.42 (the forest root/shoot ratio of Castellanos et al., 1991) | |
| BNPP | Below-ground net primary production calculated as sum of fine_root_production for middle plot in <chm2_npp.txt> + root_increment | |
| TNPP | Total net primary production calculated as sum of ANPP + BNPP | |
| LAI_max | Seasonal maximum leaf area index calculated by the light canopy transmittance technique described in Maass et al. (1995) | m2/m2 |
| LAI_min | Seasonal minimum leaf area index calculated by the light canopy transmittance technique described in Maass et al. (1995) | |
| basal_area | Basal area per hectare calculated as the sum of all individuals > 3.18-cm dbh in the permanent plots (Perez-Jiminez, unpublished data) | m2/ha |
| average_height | Average tree height, considering all individuals > 3.18-cm dbh in the permanent plots (Perez-Jiminez, unpublished data) | m |
| density | Tree density, considering all individuals > 3.18-cm dbh in the permanent plots (Perez-Jiminez, unpublished data) | trees/ha |
| AGbiomass | Total above-ground biomass from destructive harvest of trees, shrubs, lianas, and cacti > 3.0-cm dbh (including estimated biomass of six missing trees) + understory at a site similar to the middle plot but outside of the watershed (Martinez-Yrizar et al., 1992) plus mean annual litterfall from an adjacent forest site (only in <chm2_npp.txt>) | g/m2 |
| AGbiomass | Total above-ground biomass from basal area of all plants > 3.2-cm dbh and regression equation of Martinez-Yrizar et al. (1992) + understory harvested biomass at a site similar to the middle plot but outside of the watershed (Castellanos et al., 1991) and similar to harvest plot of Martinez-Yrizar et al. (1992) but 2- km distant (only in <chm2_npp.txt>) | |
| BGbiomass | Total below-ground biomass from fine-root soil cores of Kummerow et al. (1990) + coarse root excavations of Castellanos et al. (1991) from two different sites (one for each study), both outside of but similar to middle plot, Watershed I (only in <chm2_npp.txt>) |
Note: Not all files contain the same parameter fields.
Sample NPP Data Record for chm1_npp.txt
| Site; Treatmt; Year; Month; Day; parameter; amount; units; Reference/ Comments
chm ; lower; 1982-1992; 6-5; -999.9; fine_litterfall; 421; g/m2/y; Average of 10 years from monthly sampling of 24 litter traps, 50 cm in diameter (Martinez-Yrizar et al. 1996) chm ; lower; 1988-1990; 6-5; -999.9; wood_increment; 290; g/m2/y; Calculated by measuring stem diameter increases during 1988-1990, all individuals with dbh > 3.18 cm (Martinez-Yrizar et al. 1996) chm ; lower; 1985; 6-11; -999.9; leaf_herbivory; 72; g/m2/y; Loss of leaf mass determined from repeated measurements of a representative sample of trees (Filip et al. 1995) chm ; lower; 1982-1992; 6-5; -999.9; ANPP; 808; g/m2/y; Sum of fine_litterfall + wood_increment + leaf_herbivory and an estimation of understory production (Martinez-Yrizar et al. 1996) ... |
Table 6. Definition of parameters in NPP file chm4_npp.txt
| PARAMETER | DEFINITION | UNITS |
|---|---|---|
| Ca input | Average annual calcium input to 5 watersheds via bulk deposition | kg/ha |
| K input | Average annual potassium input to 5 watersheds via bulk deposition | |
| Mg input | Average annual magnesium input to 5 watersheds via bulk deposition | |
| P input | Average annual phosphorus input to 5 watersheds via bulk deposition | |
| Ca output | Average annual calcium output from 5 watersheds via stream water flow | |
| K output | Average annual potassium output from 5 watersheds via stream water flow | |
| Mg output | Average annual magnesium output from 5 watersheds via stream water flow | |
| P output | Average annual phosphorus output from 5 watersheds via stream water flow |
Sample NPP Data Record for chm4_npp.txt
| Site; Treatmt; Year; Month; Day; parameter; amount; units; Reference/ Comments chm ; average; 1990; -999.9; -999.9; Ca input; 1.61; kg/ha; ALL NUTRIENT DATA: chm ; average; 1991; -999.9; -999.9; Ca input; 2.54; kg/ha; Average annual nutrient input via bulk deposition chm ; average; 1992; -999.9; -999.9; Ca input; 3.49; kg/ha; Average annual nutrient output via stream water flow chm ; average; 1993; -999.9; -999.9; Ca input; 7.42; kg/ha; Data from Campo et al. (2000; 2001). chm ; average; 1994; -999.9; -999.9; Ca input; 1.82; kg/ha; chm ; average; 1995; -999.9; -999.9; Ca input; 1.30; kg/ha; ... |
Climate Data. The climate data set is a text file (.txt format). The variable values are delimited by semicolons. The first 18 lines are metadata; data records begin on line 19. The value -999.9 is used to denote missing values.
Sample Climate Data Record
| Site;Temp;Parm; Jan; Feb; Mar; Apr; May; Jun; Jul; Aug; Sep; Oct; Nov; Dec; Year; chm ;mean;prec; 44.1; 2.6; 0.9; 0.6; 10.7; 100.8; 132.4; 151.0; 219.8; 82.1; 20.7; 14.0; 779.8 chm ;mean;tmax; 31.4; 31.6; 31.4; 30.3; 31.7; 33.5; 33.0; 32.6; 31.6; 30.7; 31.6; 29.8; 31.6 chm ;mean;tmin; 15.8; 16.4; 14.3; 14.3; 17.3; 20.5; 21.9; 21.5; 20.2; 20.7; 18.2; 17.7; 18.2 chm ;numb;prec; 17; 17; 17; 17; 17; 17; 17; 17; 17; 17; 17; 17; 17 chm ;numb;tmax; 4; 4; 4; 4; 4; 4; 4; 4; 4; 4; 4; 4; 4 chm ;numb;tmin; 4; 4; 4; 4; 4; 4; 4; 4; 4; 4; 4; 4; 4 chm ;stdv;prec; 155.0; 4.5; 3.1; 2.5; 42.9; 80.1; 59.4; 100.9; 176.0; 84.8; 31.5; 30.2; 256.4 chm ;stdv;tmax; 1.2; 1.7; 1.6; 1.1; 1.4; 1.5; 0.9; 1.8; 0.8; 0.5; 1.6; 1.0; 1.3 chm ;stdv;tmin; 2.5; 2.1; 2.4; 1.6; 4.8; 2.1; 0.4; 1.1; 4.0; 2.3; 3.6; 0.8; 2.3 chm ;1983;prec; 16.0; 0.0; 0.0; 0.0; 177.0; 30.0; 102.0; 98.8; 257.9; 122.3; 22.0; 0.0; 826.0 chm ;1983;tmax; -999.9; -999.9; -999.9; -999.9; -999.9; -999.9; -999.9; -999.9; -999.9; -999.9; -999.9; -999.9; -999.9 chm ;1983;tmin; -999.9; -999.9; -999.9; -999.9; -999.9; -999.9; -999.9; -999.9; -999.9; -999.9; -999.9; -999.9; -999.9 … Where, Temp (temporal) - specific year or long-term statistic: mean = mean based on all years numb = number of years stdv = standard deviation based on all years Parm (parameter): prec = precipitation for month or year (mm) tmax = mean maximum temperature for month or year (C), measured within and above the canopy (2 m above ground and 2 m above the canopy) tmin = mean minimum temperature for month or year (C), measured within and above the canopy (2 m above ground and 2 m above the canopy) |
3. Data Application and Derivation:
The accumulation of biomass, or NPP, is the net gain of carbon by photosynthesis that remains after plant respiration. This data set accounts for several components of NPP: above- and below-ground phytomass; fine root production; estimation of coarse root increment; litterfall; seasonal changes in leaf area index; and levels of herbivory. Nutrient input to and output from the watershed are also presented; intra-watershed fluxes are provided in the literature.
Tropical deciduous dry forests represent about 40% of all of the forests in tropical and subtropical areas of the world, yet they are one of the least known tropical ecosystems. The present study is part of a long-term ecosystem research project started in 1975 to analyze various aspects of the structure and function of a undisturbed deciduous dry forest in an attempt to assess its productive capacity and ecosystem dynamics. This data set represents the integration of 10 years of data from several separate but complementary studies and the first direct estimate of total NPP for a Neotropical deciduous forest.
The tropical forest data for the Chamela site are provided for comparison with models and estimation of NPP. Climate data are provided for use in driving ecosystem/NPP models.
4. Quality Assessment:
The results of the various studies conducted at Chamela have been compared in the literature with data from similar studies elsewhere as a measure of data quality.
ANPP estimates for Chamela (Martinez-Yrizar et al., 1996) are within the range of values for tropical dry forests reviewed by Murphy and Lugo (1986) and are also similar to values for the forest at Guanica (Lugo and Murphy, 1986). Above-ground phytomass estimates derived from destructive sampling, however, were among the highest for five other tropical deciduous forest sites from contemporary studies elsewhere (Martinez-Yrizar et al., 1992). The level of herbivory at Chamela is in agreement with Cyr and Pace (1993). BNPP values are slightly higher than values reported for tropical dry forests by Murphy and Lugo (1986). Because losses of roots and stems to herbivores have not been taken into account, total NPP estimates probably represent lower bound values for the Chamela forest.
Sources of Error
Information not available.
5. Data Acquisition Materials and Methods:
Table 7. NPP studies at Chamela Biological Station were used to construct this data set
| STUDY | PLOT LOCATIONS | PARAMETERS |
|---|---|---|
| Kummerow et al. (1990) | Plots located between Watersheds III & IV | Fine root production; root increment |
| Castellanos et al. (1991) | Similar to middle plot, but outside Watershed I | Above-ground biomass & coarse root biomass (destructive harvest); root/stem ratio |
| Martinez-Yrizar et al. (unpublished data) | Lower, middle, and upper plots, Watershed I | Litterfall production |
| Martinez-Yrizar et al. (1992) | Similar to middle plot of Watershed I, but outside watershed | Tree inventory, dbh, destructive harvest, height & fresh mass; dry mass of subsamples; understory biomass; below-ground phytomass from literature |
| Maass et al. (1995) | Meteorological towers on middle plots of Watersheds I & II, and on access trail to the watersheds | LAI; specific leaf-area; light transmittance; light extinction coefficient (k) |
| Filip et al. (1995) | Lower, middle, and upper plots, Watershed I | Leaf herbivory |
| Martinez-Yrizar et al. (1996) | Lower, middle, and upper plots of Watershed I; plots adjacent to the Hill Site of Martinez-Yrizar and Sarukhan (1990) | Tree inventory, dbh, height & location; stem diameter increments; understory biomass |
| Campo et al. (2000; 2001) | Middle plots, Watersheds I-V | Nutrient input (Ca, P, K, and Mg) via bulk deposition and nutrient output via stream water flow; also nutrient fluxes in litterfall, throughfall, and standing litter (data in cited literature) |
Leaf Area Index (LAI)
Seasonal LAI was determined by Maass et al. (1995) from May 1990 to May 1992 using a light transmittance technique based on the relationship between leaf area and light transmittance, as described by the Beer-Lambert model (Monsi and Saeki, 1953). Specific leaf-area values were determined for ten randomly-selected leaves obtained in November 1990 from each litterfall trap of Martinez et al. (unpublished data) representing peak litterfall during the year. The leaves were carefully rehydrated, unfolded, pressed, and their leaf area measured using a Licor leaf area meter. The leaves were dried at 80 degrees C to constant mass. Canopy transmittance of the photosynthetically active radiation (Qi PAR) was measured 1-m above the forest floor, at the same locations as the litter traps, using a sunfleck ceptometer. Total incoming PAR (Qo) was measured either above the canopy or in an opening at the beginning and at the end of the sampling period. Within-canopy PAR transmittance was measured from meteorological towers every meter, from the forest floor to the top of the canopy. Measurements were made seasonally during May and September of 1990, and monthly from January 1991 to May 1992. To obtain k, vertical LAI and Qi/Qoprofiles were obtained on each of the towers. See Maass et al. (1995) for details.
Litterfall
Litterfall was collected monthly over a 10-year period (1982-1992) using 24 conical fiberglass mesh traps, each 0.5-m in diameter (area 0.1963-m2) and 50-cm deep. Traps were randomly located on the three permanent plots in Watershed I (Martinez-Yrizar et al., unpublished data). For details, see Martinez-Yrizar and Sarukhan (1990; 1993).
Above-ground biomass
Castellanous et al. (1991) measured above-ground tree and shrub biomass in two 100-m2 (10- m x 10-m ) sites that were ecologically similar to the Watershed I middle plot but outside the watershed and about 2-km distant to the study plot of Martinez-Yrizar et al. (1992). Basal area of all plants > 3.2-cm dbh was measured in the dry season of 1989. To estimate biomass, the Martinez-Yrizar et al. (1992) regression equation relating dry weight to basal area was used. All shrubs, lianas, and trees < 3.2-cm dbh were harvested from nine randomly selected square meters at each of the two sites. Dead branches and stems were discarded. Lianas with stems that extended above 2-m height into the tree crowns were harvested to 2-m height only. Weights of these samples were recorded after drying for 7 days at 78 degrees C.
Martinez-Yrizar et al., (1992) estimated above-ground biomass in a 1000-m2 (50-m x 20-m subdivided into 40 plots, each 5-m x 5-m) deciduous hillside plot based on destructive sampling in the dry season of 1991. This study area was outside of but ecologically similar to the middle plot in Watershed I. In each sample plot, individual plants 3.0 cm or greater in diameter, 1.3-m above-ground, were identified and their diameter measured (dbh). The plants were harvested, and their height and total fresh mass measured in the field. Subsamples of boles, sterns and branches of each individual plant were taken to the laboratory and dried to constant mass at 105 degrees C. The herbaceous vegetation was sampled in 24 subplots (3-m x 2-m) randomly selected before the arboreal vegetation was cut down. All herbs, saplings, and stems < 3.0-cm dbh were identified, harvested at ground level, and weighed in the field. Subsamples were dried to constant mass at 80 degrees C.
Martinez-Yrizar et al. (1996) calculated NPP values for the three permanent plots in Watershed I (Table 1). Each plot is 2,400-m2 (80-m x 30-m) with the long axis perpendicular to the stream channel so that half of each plot is facing north and half is facing south. On each plot, all individual plants with a dbh >3.18-cm were identified, marked, geo-located, and measured (height and dbh). Litterfall was determined monthly from 24 litter traps (50-cm diameter) on each plot over a 10-year period (June 1982-May 1992) (Martinez-Yrizar et al., unpublished data). Wood increments were calculated by measuring stem diameter increases during a 2-year period (1988-1990) for all individual plants (dbh >3.18 cm) on each plot. Diameter increments were converted to annual above-ground wood increments using the allometric equations developed by Martinez-Yrizar et al. (1992). Loss of leaf mass to herbivores was determined from repeated measurements of damage on individually labeled leaves throughout the 1985 wet season from a representative sample of tree species in each plot (Filip et al., 1995). Understory production was calculated by harvesting all herbs, saplings, and stems (<3.18-cm dbh) from 24 plots (3-m x 2-m each) selected from a site of 1,000-m2 adjacent to the Hill Site of Martinez-Yrizar & Sarukhan (1990) at the end of the growing season (i.e., December); corrections for mortality of plant parts during the growth period were not included (Martinez-Yrizar et al., 1992).
Below-ground biomass
Fine root production and seasonal growth (rootlets < 1-mm diameter) were measured during 1989 by analyzing the significant increases and decreases of live and dead fine root biomass in periodically sampled soil cores (Kummerow et al., 1990). Soil samples were extracted from the forest floor on two 100-m2 (10-m x 10-m) sites located on both north- and south-facing slopes of a watershed located in between Watersheds 3 and 4 using a 4.2-cm diameter steel tube to 40-cm depth (soil volume = 552 cm3). Four subsamples of 138 cm3 each at 10-cm depth intervals were extracted from each core. Three (during the drought period) or four (during the rainy season) 40-cm cores were collected per site at three- to four-week intervals. The cores were extracted from randomly chosen spots on the forest floor within each of the four sites. A minimum distance of 50-cm from a tree trunk was observed. Kummerow et al. (1990) also studied the spatial distribution patterns of fine roots; only samples from 0-10 and 10-20-cm depths were analyzed. Samples were sieved, sorted, and subdivided into live and dead rootlets. All root samples were oven dried for three days at 78 degrees C and the dry weights recorded. Gravimetric soil moisture measurements were made at irregular time intervals at the same four depths as for root extraction.
Coarse root biomass was measured by Castellanos et al. (1991) by excavating five trenches (0.5 x 2.0-m each; 60-80-cm deep) at a site similar to the middle plot but outside of Watershed I. All roots > 5-mm diameter were harvested by this procedure. No effort was made to separate live and dead roots, although it was estimated that about 10% of the larger roots were dead. Fresh and dry weights (78 degrees C, 6 days) were recorded.
Annual increments of coarse roots was estimated for the permanent plots in Watershed I by Martinez-Yrizar et al. (1996) by multiplying above-ground wood increment x the root/shoot ratio of 0.42 obtained by Castellanos et al. (1991). This calculation assumes that the turnover rates of shoots and roots are similar and that the community is at equilibrium (based on the assumption that area was mostly uninhabited for several hundred years and there is no recent record or any evidence of natural or anthropogenic fires, hurricane damage, or timbering on the studied watersheds).
Herbivory
Loss of leaf mass to herbivores was determined from repeated measurements of damage on individually labeled leaves throughout the 1985 wet season from a representative sample of 12 tree species (five individuals per species) chosen on the basis of their density, frequency, and size in the deciduous forest (Filip et al., 1995). Standing levels of herbivory damage, in terms of percent leaf area eaten, were also measured using discrete measurements over a 3-year period (1983-1985). See cited literature for methods and data values for discrete measurements.
For the long-term measurements, 20 randomly-chosen canopy leaves per tree were tagged with thin-wire colored rings placed around the leaf petioles in July 1985, soon after leaf flushing. The contours of the leaves were drawn, cut, and measured in a leaf area meter. A second tracing of the leaves (including the contours of damage and inner holes) was obtained in August. From these measurements, rates of herbivory were calculated as percent leaf area eaten per day for the early wet season. Lastly, in September (before leaf fall), all leaves were collected for a final measurement of rates of herbivory corresponding to the late wet season. Leaf nitrogen, water content, toughness, and pubescence were also determined (see Filip et al., 1995, for details).
Nutrient flux
Campo et al. (2000; 2001) calculated calcium, phosphorous, potassium, and magnesium budgets for the five Chamela watersheds by measuring bulk inputs via the atmosphere; outputs of dissolved and particulate-bound elements via stream flow, and intra-watershed cycling (throughfall and litterfall fluxes, standing crop litter concentrations, and soil available element pools). The study applied the watershed-ecosystem method of Likens and Bormann (1995) at five middle position plots in Watersheds I-V. Each plot was 2,400-m2 (80 x 30-m) with the long axis perpendicular to the stream channel. Components of the study included in this data set are:
- Input from the atmosphere: Ca, P, K, and Mg entering the ecosystem by bulk atmospheric deposition were collected during a 6-yr period (1990-1995) in six bulk precipitation collectors maintained in cleared areas within a radius of 2 km from the study plots. Wet and dry depositions were sampled together after every rainfall event. Rainfall amount was determined with two rain gauges and one recording rain gauge. Rainfall samples are filtered to remove suspended material. Chemical analyses followed APHA (1992) standards. Nutrients entering the ecosystem were estimated by multiplying the rainfall amount by the element concentrations. See cited literature for details on collector construction and sample analyses.
- Loss of dissolved and particulate: bound elements from the watershed-Coschocton wheels were used to sample losses of dissolved Ca, P, K, and Mg in stream water runoff in the five small watersheds. Drain water was collected after each rain event. The volumes of drainage water (runoff) were gauged with one water level recorder located at the mouth of each watershed. Loss of particulate-bound Ca, P, K, and Mg, was estimated by collecting sediments and particulate organic material trapped at the mouth of the gauged watersheds. Material was collected in three 10-cm, 5-cm and 2-cm mesh nets from water passing through a gauged weir and in a sediment trap behind the net at each weir during a 2-yr period (1993-1994). All organic material or sediment samples were oven-dried (80 degrees C) and weighed after every runoff event. Particulate organic matter was ground in a Wiley Mill. Chemical analyses followed APHA (1992) standards. The mass of dissolved Ca, P, K, and Mg leaving the watershed was calculated as the product of the nutrient concentration in runoff by the volume of water drained from the watershed area. The mass of particulate-bound Ca, P, K, and Mg exported from the watershed was estimated as the product of the particulate nutrient concentration in runoff by the amount of organic matter or sediment exported from the watershed area.
Campo et al. (2000; 2001) also measured nutrient flux in throughfall, litterfall, and standing crop litter pool. Phosphorus in soils was also measured. See cited literature for methods and data.
Climate
Air temperature and precipitation were monitored on an instrumented tower located in the Chamela-Cuixmala Biosphere Reserve. Minimum and maximum air temperature were measured within and above the canopy (2-m above ground and 2-m above the canopy).
6. Data Access:
This data set is available through the Oak Ridge National Laboratory (ORNL) Distributed Active Archive Center (DAAC).
Data Archive Center:
E-mail: uso@daac.ornl.gov
Telephone: +1 (865) 241-3952
7. References:
Campo, J., J. M. Maass, V. J. Jarammillo, and A. Martinez-Yrizar. 2000. Calcium, potassium and magnesium cycling in a Mexican tropical dry forest ecosystem. Biogeochemistry 49: 21-36.
Campo, J., J. M. Maass, V. J. Jarammillo, A. Martinez-Yrizar, and J. Sarukhan. 2001. Phosphorus cycling in a Mexican tropical dry forest ecosystem. Biogeochemistry 53(2): 16-179.
Castellanos, J., M. Maass, and J. Kummerow. 1991. Root biomass of a dry deciduous tropical forest in Mexico. Plant and Soil 131, 225-228.
Filip, V., R. Dirzo, J. M. Maass and J. Sarukhan. 1995. Within- and among-year variation in the levels of herbivory on the foliage of trees from a Mexican tropical deciduous forest. Biotropica 27, 78-86.
Kummerow, J., J. Castellanos, J. M. Maass, and A. Larigauderie. 1990. Production and seasonality of fine-root growth in a Mexican deciduous dry forest. Vegetatio 90: 73-80.
Maass, J. M., J. M. Voseb, W. T. Swank, and A. Martinez-Yrizar. 1995. Seasonal changes of leaf area index (LAI) in a tropical deciduous forest in west Mexico. Forest Ecology and Management 74: 171-180.
Martinez-Yrizar, A., J. M. Maass, L. A. Perez-Jimenez, and J. Sarukhan. 1996. Net primary productivity of a tropical deciduous forest ecosystem in western Mexico. Journal of Tropical Ecology 12: 169-175.
Martinez-Yrizar, A., and J. Sarukhan. 1990. Litterfall patterns in a tropical deciduous forest in Mexico over a five-year period. Journal of Tropical Ecology 6: 433-444.
Martinez-Yrizar, A., J. Sarukhan, A. Perez-Jimenez, E. Rincon, J. M. Maass, A. Solis-Magallanes, and L. Cervantes. 1992. Above-ground phytomass of a tropical deciduous forest on the coast of Jalisco, Mexico. Journal of Tropical Ecology 8: 87-96.
Olson, R. J., K.R. Johnson, D.L. Zheng, and J.M.O. Scurlock. 2001. Global and Regional Ecosystem Modeling: Databases of Model Drivers and Validation Measurements. ORNL Technical Memorandum TM-2001/196. Oak Ridge National Laboratory, Oak Ridge, Tennessee, U.S.A.
Additional Sources of Information:
APHA. 1992. American Public Health Association, American Water Works Association, Water Pollution Control Federation. Metodos normalizados. Diaz Santos, Madrid.
Clark, D. A., S. Brown, D. W. Kicklighter, J. Q. Chambers, J. R. Thomlinson, J. Ni, and E. A. Holland. 2001a. Net primary production in tropical forests: an evaluation and synthesis of existing field data. Ecological Applications, 11(2): 371-384.
Clark, D.A., S. Brown, D.W. Kicklighter, J.Q. Chambers, J.R. Thomlinson, J. Ni, and E.A. Holland. 2013b. NPP Tropical Forest: Consistent Worldwide Site Estimates, 1967-1999. Data set. Available on-line [http://daac.ornl.gov] from the Oak Ridge National Laboratory Distributed Active Archive Center, Oak Ridge, Tennessee, USA doi:10.3334/ORNLDAAC/616
Cyr, H., and M. L. Pace. 1993. Magnitude and patterns of herbivory in aquatic and terrestrial ecosystems. Nature 361: 148-150.
Diaz, S. 1997. Dinamica de nitr6geno y f6sforo en la hojarasca de una selva baja caducifolia en Chamela, Jalisco, Mexico. Bachelor Thesis, Universidad Nacional Aut6noma de Mexico, Mexico.
Galicia, S. L. 1992. Influencia de la variabilidad de la forma de la pendiente en las propiedades fisicas del suelo y su capacidad de retention de agua, en una cuenca tropical estacional. Bachelor Thesis, Facultad de Filosofia y Letras, Universidad Nacional Autonoma de Mexico, 116 pp.
Likens, G. E., and F. H. Bormann. 1995. Biogeochemistry of a Forested Ecosystem. Springer-Verlag, New York.
Martinez-Yrizar, A., and J. Sarukhan. 1993. Cambios estacionales del mantillo en el suelo de un bosque tropical caducifolio y subcaducifolio en Chamela, Mdxico. Acta Bot. Mex. 21: 1-6.
Monsi, M., and T. Saeki. 1953. Uber den Lichtfaktor in den Pflanzengesellschaften und seine Bedeutung fur die Stoffproduktion. Jpn. J. Bot., 14: 22-52.
Murphy, P. G., and A. E. Lugo. 1986. Ecology of tropical dry forests. Ann. Rev. Ecol. Syst. 17: 67-88.
Olson, R.J., J.M.O. Scurlock, S.D. Prince, D.L. Zheng, and K.R. Johnson (eds.). 2013a. NPP Multi-Biome: Global Primary Production Data Initiative Products, R2. Data set. Available on-line [http://daac.ornl.gov] from the Oak Ridge National Laboratory Distributed Active Archive Center, Oak Ridge, Tennessee, USA doi:10.3334/ORNLDAAC/617
Olson, R.J., J.M.O. Scurlock, S.D. Prince, D.L. Zheng, and K.R. Johnson (eds.). 2013b. NPP Multi-Biome: NPP and Driver Data for Ecosystem Model-Data Intercomparison, R2. Data set. Available on-line [http://daac.ornl.gov] from the Oak Ridge National Laboratory Distributed Active Archive Center, Oak Ridge, Tennessee, USA doi:10.3334/ORNLDAAC/615
Rzedowski, J. 1978. Vegetacion de Mexico. Limusa, Mexico, D.F. 431 pp.
Scurlock, J.M.O., and R.J. Olson. 2002. Terrestrial net primary productivity - A brief history and a new worldwide database. Environ. Rev. 10(2): 91-109. doi:10.1139/a02-002
Scurlock, J.M.O., and R.J. Olson. 2013. NPP Multi-Biome: Grassland, Boreal Forest, and Tropical Forest Sites, 1939-1996, R1. Data set. Available on-line [http://daac.ornl.gov] from Oak Ridge National Laboratory Distributed Active Archive Center, Oak Ridge, Tennessee, USA doi:10.3334/ORNLDAAC/653