Get Data
Summary:
This data set contains three files (.txt format). One file provides net primary productivity (NPP) data for the moist lowland tropical forest on Barro Colorado Island, Panama. NPP estimates are based on field measurements of litterfall accumulation, tree growth and mortality, and herbivory. Above-ground biomass and the leaf area index (LAI) are also reported. The other two data files provide climate data recorded onsite.
Annual litterfall accumulation (leaf + twig + other litterfall) averaged 1,064 g/m2/year, excluding losses to herbivory, on the central plateau of the island and in the Lutz catchment (1969-1979) and 1,246 g/m2/year at Poacher's Peninsula (1986-1990). Herbivory due to insects (about 50 g/m2/year) was estimated from leaf litterfall (1974-1977) by measuring holes and gaps in fallen leaves. An additional 30 g/m2/year may be lost to vertebrate herbivores which leave no identifiable traces in litter traps. Coarse wood litterfall due to tree damage may represent an additional 46 g/m2/year. Above-ground biomass averaged 27,425 g/m2 based on inventory data collected every 5 years from 1985 to 2000 and allometric regression equations. Tree growth of 554 g/m2/year was based on above-ground biomass changes during the three census intervals. Tree mortality of 2-3% was estimated by recording dead or missing trees (1982-1990). LAI of 7.3 was based on the average area of leaves that fell per area of ground per year. Overall, above-ground NPP for Barro Colorado Island was estimated at 1,800 g/m2/year.
Revision Notes: This data set has been revised to replace previously reported litterfall data for 1990, add litterfall data for 1986-1989, revise above-ground biomass data for 1985-1995, add above-ground biomass data for 2000, and add an above- ground carbon budget. Please see the data set revisions section of this document for details.
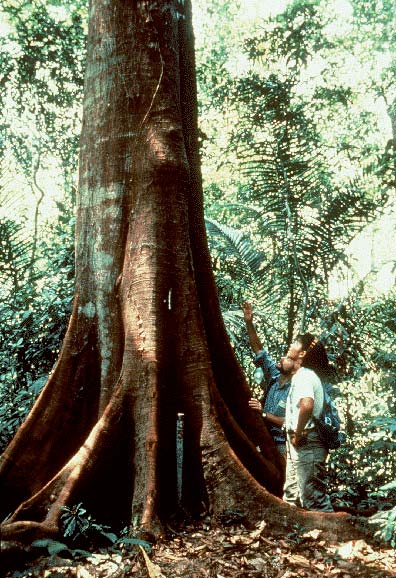
Figure 1. Discussion of how to measure buttressed trees at the Barro Colorado tropical forest site, Panama. (Dr. Robin Foster [with arm raised] is showing Bolivian student Marielos Pena that the measurement should be made on the cylindrical part of the trunk above the buttresses. The tree species is Tachigali versicolor (Fabaceae), so-called the "suicidal tree", since it dies after its first flowering. Photograph taken around 1992 by Marcos Guerra, STRI).
Additional Documentation:
The NPP data collection contains field measurements of biomass, estimated NPP, and climate data for terrestrial grassland, tropical forest, boreal forest, and tundra sites worldwide. Data were compiled from the published literature for intensively studied and well-documented individual field sites and from a number of previously compiled multi-site, multi-biome data sets of georeferenced NPP estimates. The principal compilation effort (Olson et al., 2001) was sponsored by the NASA Terrestrial Ecology Program. For more information, please visit the NPP web site at http://daac.ornl.gov/NPP/npp_home.html.
Data Citation:
Cite this data set as follows:
Condit, R., D.M. Windsor, and S.P. Hubbell. 2013. NPP Tropical Forest: Barro Colorado, Panama, 1969-2000, R1. Data set. Available on-line [http://daac.ornl.gov] from Oak Ridge National Laboratory Distributed Active Archive Center, Oak Ridge, Tennessee, USA doi:10.3334/ORNLDAAC/157
This data set was originally published as:
Condit, R., D.M. Windsor, and S.P. Hubbell. 1996. NPP Tropical Forest:
Barro Colorado, Panama, 1969-2000. Data set. Available on-line
[http://daac.ornl.gov] from Oak Ridge National Laboratory Distributed
Active Archive Center, Oak Ridge, Tennessee, U.S.A.
Table of Contents:
- 1 Data Set Overview
- 2 Data Description
- 3 Applications and Derivation
- 4 Quality Assessment
- 5 Acquisition Materials and Methods
- 6 Data Access
- 7 References
- 8 Data Set Revisions
1. Data Set Overview:
Project: Net Primary Productivity (NPP)
The data represent several components of above-ground net primary productivity (ANPP): litterfall accumulation, herbivory, tree growth, coarse wood fall, and tree mortality. Climate data are also reported.
Annual litterfall accumulation (leaf + twig + other litterfall) averaged 1,064 g/m2/year, excluding losses to herbivory, on the central plateau of the island and in the Lutz catchment (1969-1979) and 1,246 g/m2/year at Poacher's Peninsula (1986-1990). Herbivory due to insects (about 50 g/m2/year) was estimated from leaf litterfall (1974-1977) by measuring holes and gaps in fallen leaves. An additional 30 g/m2/year may be lost to vertebrate herbivores which leave no identifiable traces in litter traps. Coarse wood litterfall due to tree damage may represent an additional 46 g/m2/year. Above-ground biomass averaged 27,425 g/m2 based on inventory data collected every 5 years from 1985 to 2000 and allometric regression equations. Tree growth was estimated to be 554 g/m2/year based on above-ground biomass changes during the three census intervals. Tree mortality of 2-3% was estimated by recording dead or missing trees (1982-1990). LAI of 7.3 was based on the average area of leaves that fell per area of ground per year. Overall, above-ground NPP is estimated at 1,800 g/m2/year (Chave et al., 2003; Scurlock and Olson, 2013).
2. Data Description:
Spatial Coverage
Site: Barro Colorado, Panama
Site Boundaries:(All latitude and longitude given in decimal degrees)
| Site (Region) | Westernmost Longitude | Easternmost Longitude | Northernmost Latitude | Southernmost Latitude | Elevation (m) |
|---|---|---|---|---|---|
| Barro Colorado, Panama | 79.85 | 79.85 | 9.15 | 9.15 | 137 |
Spatial Resolution
Litterfall was collected in litter traps with a surface area of 0.083 m2 (Foster, 1982; Leigh and Windsor, 1982); the number of traps varied from 100 to 312 per study. Healey and Swift (1977) presumably used larger collectors (Leigh and Windsor, 1982). Wieder and Wright (1995) used leaf traps with a surface area of 0.25 m2 in 2.25-ha plots. Leaf area index and herbivory estimates are derived from litterfall data of Leigh and Windsor (1982). Above-ground biomass data was derived from censuses in the 50-ha permanent forest plot (1,000 m x 500 m).
Temporal Coverage
- Litterfall was collected in separate studies:
- August 1969 through August 1971 (Foster, 1982)
- 1971 (Healey and Swift, 1977)
- September 1971 though December 1979 (Leigh and Windsor, 1982)
- December 1986 through December 1990 (Wieder and Wright, 1995).
- Leaf area index data are available for the 1974-77 period.
- Herbivory was measured between 1974 and 1977 (Leigh and Windsor, 1982).
- Mortality data for trees > 10 cm are from two periods: 1982-85 and 1985-90.
- Above-ground biomass was measured during the dry seasons of 1985, 1990, 1995, and 2000.
- Precipitation data are available from January 1929 through December 1997.
- Maximum and minimum air temperature data are available from January 1972 through December 1997.
Temporal Resolution
- Litterfall was collected every 1-2 weeks; annual data are provided in this data set.
- Leaf area index and herbivory were calculated from litterfall data, with annual average being provided herein.
- Above-ground biomass measurements were made every five years.
Data File Information
LAI measurements are expressed as the total area of leaves per square meter per year (m2/m2).
Above-ground biomass estimates are based on plant dry matter weight (g/m2).
Litterfall accumulation, herbivory loss, tree growth, and ANPP are expressed as g/m2/year (dry matter weight).
Tree mortality is expressed as percentage of trees which died during the sampling interval.
Climate data are expressed as monthly and annual precipitation amounts (mm) and monthly and annual average maximum/minimum temperature (C).
Monthly and annual climatic means are provided for two periods: precipitation, 1929-1997; and precipitation and maximum/minimum temperature, 1972-1997.
Table 1. Data files in this data set archive
| FILE NAME | TEMPORAL COVERAGE | FILE CONTENTS |
|---|---|---|
| brr_npp_r1.txt | 1969/01/01-2000/12/31 | LAI, litterfall, herbivory loss, tree mortality, above-ground biomass data, and ANPP for Barro Colorado Island, Panama |
| brr1_cli.txt | 1972/01/01-1997/12/31 | Monthly and annual precipitation and temperature data from a weather station in the Lutz watershed, measured at the forest site, on Barro Colorado Island, Panama |
| brr2_cli.txt | 1929/01/01-1997/12/31 | Monthly and annual precipitation data from a weather station in the Lutz watershed, measured at the forest site, on Barro Colorado Island, Panama |
NPP Data. ANPP estimates and associated data for the Barro Colorado Island (BCI) site are provided in one file (.txt format) (Table 1). The variable values are delimited by semicolons. The first 18 lines are metadata; data records begin on line 19. The value -999.9 is used to denote missing values. Above-ground biomass estimates are expressed as g/m2 (dry matter weight). LAI measurements are expressed as m2/m2. Litterfall, grazing loss, tree growth, and ANPP estimates are expressed as g/m2/year (dry matter weight). Tree mortality is expressed as the percentage of trees that died during the sampling interval.
Table 2. Column headings in NPP file
| COLUMN HEADING | DEFINITION | UNITS |
|---|---|---|
| Site | Site where data were gathered (code refers to site identification) | Text |
| Treatmt | Long term management of site (code refers to treatment described in metadata in data file or plot location within study site) | |
| Year | Year(s) in which data were collected | Numeric |
| Month | Month in which data were collected | |
| Day | Day of te month on which data were collected | |
| parameter | Parameters measured (see definitions in Table 3) | Text |
| amount | Data values | Numeric |
| units | Unit of measure | Text |
| References/Comments | Reference to primary and secondary data sources and/or explanatory comments |
Table 3. Definition of parameters in NPP file
| PARAMETER | DEFINITION | UNITS |
|---|---|---|
| LAI | Leaf area index (based on the total area of leaves falling per area of ground per year) | m2/m2 |
| leaflittfall | Leaf litterfall | g/m2/year |
| Totlittfall | Total litterfall [leaves + fruit + flowers + twig + trash (Leigh and Windsor, 1982); leaves + fruit (Foster, 1982); leaves + fruit on control plot (Wieder and Wright, 1995); leaves + fruit + twigs (Healey and Swift, 1977)] | |
| twiglittfall | Twig litterfall | |
| Grazloss | Herbivory (based on the total area of leaf matter lost to grazing, estimated by measuring holes and gaps in leaves in litterfall samples and converting area lost to mass) | |
| mortality>10cm | Mortality of trees > 10 cm in diameter during study interval | percent |
| AGbiomass | Above-ground live biomass from tree census (excludes biomass of lianas and palms) | g/m2 |
| Totlittfall | Annual average total litterfall based on earlier studies (see above) | g/m2/year |
| ins_herbiv | Annual average leaf herbivory by insects | |
| vert_herbiv | Annual average leaf herbivory by vertebrates | |
| wood_fall | Annual average coarse wood fall due to tree damage | |
| tree_growth | Annual average tree growth | |
| ANPP | Annual above-ground primary production |
Sample NPP Data Record
|
site; Treatmt; Year; Month; Day; parameter; amount; units; Reference/ Comments brr; none; 1974-77; -999.9; -999.9; LAI; 7.3; m2/m2; Leigh and Windsor in Leigh et al. (1982)brr; plateau; 1969-70; -999.9; -999.9; leaflittfall; 578; g/m2/year; Foster, R.B. in Leigh et al. (1982) brr; plateau; 1970-71; -999.9; -999.9; leaflittfall; 643; g/m2/year; Foster, R.B. in Leigh et al. (1982) brr; plateau; 1971; -999.9; -999.9; leaflittfall; 740; g/m2/year; Healey and Swift (1977), in Leigh and Windsor, in Leigh et al. (1982) brr; Lutz; 1972; -999.9; -999.9; leaflittfall; 749; g/m2/year; Leigh and Windsor in Leigh et al. (1982) ... |
Climate Data. Climate data for the BCI site are provided in two files (Table 1). One file for precipitation amount and mean maximum/minimum temperature for month or year (1972-1997), and one file for precipitation amount for month or year (1929-1997). The data sets are text files (.txt format). The variable values are delimited by semicolons. The first 18 lines are metadata; data records begin on line 19. There are no missing values.
Sample Climate Data Record: brr1_cli.txt
|
Site;Temp;Parm; Jan; Feb; Mar; Apr; May; Jun; Jul; Aug; Sep; Oct; Nov; Dec; Year; brr ;mean;prec; 78.8; 35.2; 34.1; 100.0; 278.4; 276.8; 253.9; 303.1; 308.4; 359.4; 359.3; 176.7; 2564.0; brr ;mean;tmax; 29.3; 29.8; 30.8; 31.9; 31.0; 31.0; 29.8; 30.0; 29.8; 29.3; 29.2; 29.4; 32.9; brr ;mean;tmin; 21.1; 21.4; 21.3; 21.9; 22.1; 21.8; 21.3; 21.1; 21.5; 20.3; 21.4; 21.4; 19.7; brr ;numb;prec; 26; 26; 26; 26; 26; 26; 26; 26; 26; 26; 26; 26; 26; brr ;numb;tmax; 23; 24; 24; 24; 24; 24; 23; 24; 24; 23; 24; 23; 22; brr ;numb;tmin; 23; 24; 24; 24; 24; 24; 23; 24; 24; 24; 24; 23; 20; brr ;stdv;prec; 96.2; 27.2; 37.1; 96.6; 104.3; 82.7; 74.1; 88.4; 91.7; 83.7; 130.5; 135.8; 533.0; brr ;stdv;tmax; 1.8; 1.5; 1.4; 2.5; 1.8; 2.3; 1.6; 1.4; 1.9; 1.5; 2.3; 2.3; 2.7; brr ;stdv;tmin; 1.8; 1.4; 1.3; 1.4; 1.4; 1.5; 1.5; 2.4; 1.6; 6.4; 1.4; 1.5; 2.4; brr ;1972;prec; 166.0; 42.0; 18.0; 127.0; 225.0; 289.0; 128.0; 239.0; 345.0; 350.0; 175.0; 188.0; 2292.0; brr ;1972;tmax; 28.0; 28.8; 30.0; 33.0; 32.0; 30.8; 30.2; 31.5; 28.8; 30.0; 30.0; 29.2; 33.0; brr ;1972;tmin; 18.5; 20.4; 20.4; 21.5; 21.2; 22.0; 22.0; 19.0; 19.5; 19.5; 20.0; 19.5; 18.5; … Where, Temp (temporal) - specific year or long-term statistic: mean = mean based on all years numb = number of years stdv = standard deviation based on all years Parm (parameter): prec = precipitation for month or year (mm) tmax = mean maximum temperature for month or year (C) tmin = mean minimum temperature for month or year (C) |
Sample Climate Data Record: brr2_cli.txt
|
Site;Temp;Parm; Jan; Feb; Mar; Apr; May; Jun; Jul; Aug; Sep; Oct; Nov; Dec; Year; brr ;mean;prec; 68.6; 32.8; 32.7; 89.2; 280.2; 270.2; 274.5; 308.5; 273.9; 350.6; 413.8; 230.9; 2626.0; brr ;numb;prec; 69; 69; 69; 69; 69; 69; 69; 69; 69; 69; 69; 69; 69; brr ;stdv;prec; 77.0; 35.1; 35.9; 86.9; 102.8; 89.3; 97.8; 93.6; 86.0; 93.5; 191.8; 169.2; 455.6; brr ;1929;prec; 12.2; 1.8; 72.1; 42.7; 350.3; 251.0; 317.0; 399.3; 175.3; 249.4; 309.6; 47.8; 2228.5; brr ;1930;prec; 48.5; 16.0; 6.6; 83.6; 258.3; 183.9; 181.4; 149.6; 293.4; 153.9; 298.7; 266.7; 1940.6; brr ;1931;prec; 30.5; 24.6; 140.7; 91.2; 292.0; 381.3; 463.6; 196.3; 194.3; 321.8; 783.3; 67.8; 2987.4; … Where, Temp (temporal) - specific year or long-term statistic: mean = mean based on all years numb = number of years stdv = standard deviation based on all years Parm (parameter): prec = precipitation for month or year (mm) |
3. Data Application and Derivation:
The accumulation of biomass, or NPP, is the net gain of carbon by photosynthesis that remains after plant respiration. While there are many fates for this carbon, this data set accounts for above-ground growth, mortality, and litter dynamics in an undisturbed moist tropical forest. These are considered the major components of ANPP.
This data set contributes to knowledge about the role of tropical forests in the global carbon cycle. BCI is one of the few remaining undisturbed and protected areas where research on tropical ecology can be pursued.
The results of Chave et al. (2003) combined with previously published data provide a first carbon budget for the BCI forest. In that study, above-ground NPP is estimated at 1,800 g/m2/year for the BCI forest. In comparison, similar studies at the Pasoh forest reserve, peninsular Malaysia (Condit et al., 1999) yield an ANPP estimate close to 2,000 g/m2/year (or 1,000 gC/m2/year). A study in a tropical forest near Manaus, Brazil, reports a lower ANPP of about 1,400 g/m2/year (or 700 gC/m2/year), excluding herbivory and coarse litterfall (Malhi et al., 1999). See Clark et al. (2001b) for reported and estimated components of ANPP for other old-growth tropical forest sites.
The forest biomass data for the BCI site are provided for comparison with models and estimation of NPP. Climate data are provided for use in driving ecosystem/NPP models.
4. Quality Assessment:
Leigh and Windsor (1982) found BCI litterfall to be comparable with that in other tropical forests around the world (Table 4, p. 117). ANPP estimates for BCI in Chave et al. (2003) are in the upper range of estimates presented for 39 other tropical forests in Clark et al. (2001b).
The estimates presented in this data set do not account for several components of NPP, such as net increments in biomass of coarse and fine roots; dead coarse and fine roots; root losses to consumers; root exudates; carbohydrates exported by plants to their mycorrhizal or nodule symbionts; and any net increases in stores of nonstructural carbohydrates (Clark et al., 2001a).
Sources of Error
Information not available.
5. Data Acquisition Materials and Methods:
Site Information
The 50-ha study plot is located in the moist lowland tropical forest on the 1,500-ha BCI, a research reserve of the Smithsonian Tropical Research Institute. BCI was formed when the Chagres River was dammed in 1910 during the construction of the Panama Canal. As the river water rose to form Gatun Lake, a small mountain was isolated from the mainland and formed the island. BCI is about 30 km from Panama City. The island is completely forested, most of which, including 48 of the 50 ha study plot, has seen no human disturbance for over 500 years.
BCI was set aside as a biological preserve in 1923, and the Barro Colorado Nature Monument (4,856 ha) was created in 1979 to include BCI and the neighboring mainland peninsulas of Buena Vista, Frijoles, Pena Blanca, Gigante, and Bohio. The historic Barro Colorado Field Research Station (circa 1923) has hosted more than 80 years of biological research, making it one of the sites with the longest history of continuous research in the New World tropics. The Smithsonian Institution has managed the nature reserve since 1945 as part of the Smithsonian Tropical Research Institute. The 50-ha Forest Dynamics Plot on BCI was established in 1981, when a topographic survey was completed to provide elevations for each intersection of a 20-m grid throughout the plot (Hubbell and Foster, 1983).
The soils of BCI are classified as Frijoles clay (described as chocolate brown alluvium underlain by deep red subsoil almost devoid of humus), which is well drained and aerated, slightly acid (pH 3.9), and friable when moist. Areas of BCI known to have been disturbed in the past 75 years have developed a hardpan beneath a grayish soil. The parent rock is predominantly marine Caimito and non-marine Bohio sedimentary formations.
The vegetation of BCI is semi-evergreen moist tropical forest (modified Bailey ecoregion humid tropical forest, #421) whose canopy can attain a height of 35-40 m. About 10% of the 211 tree species lose all or nearly all of their leaves during the dry season (Croat, 1978; Condit et al., 2001). Other canopy trees, and nearly all the midstory and understory plants, are evergreen. The five species holding the largest proportion of above-ground biomass are Trichilia tuberculata, Quararibea astrolepsis, Alseis blackiana, Ceiba pentandra, and Prioria copaifera (Chave et al., 2003). Understory trees and shrubs include Faramea occidentalis, Hybanthus prunifolius, Psychotria spp., and Ficus spp. The epiphetic cactus Epiphyllum phyllanthus grows on the trunks and primary branches of canopy trees, and the epiphetic orchid Catasetum viridiflavum grows on both live branches and dead wood (Leigh, 1999).
Flowering and litterfall are strongly seasonal on BCI. About 330 of the 652 native, woody species flower each month between the end of the dry season and the beginning of the wet season (March, April, and May), while as few as 200 species flower each month in the late wet season (September, October, and November) (Croat, 1978). The rate of leaf fall for the community as a whole peaks early in the dry season (December and January) and is about twice as high during the remainder of the dry season as in the wet season.
The climate of BCI is classified as Tropical Monsoon Climate; warm all year with seasonal rainfall. The long-term mean maximum annual temperature (1972-1997 average), measured at the forest site in the Lutz watershed at 1.0 m above ground, is 32.9 C. The long-term mean minimum annual temperature at the same location is 19.7 C. The long-term mean annual precipitation (1929-1997 average) at the same location is 2,626 mm. Most of the precipitation falls during the eight-month wet season (May to mid-December), with only about 285 mm coming during the dry season. Relative humidity, soil moisture, air pressure, solar radiation, evapotranspiration, wind speed, and wind direction all show marked wet/dry season differences. On the other hand, temperature varies relatively little throughout the year.
Of particular interest from the climate change perspective was the abrupt 14% decline in total rainfall at BCI around 1966 (Windsor, 1990), and a concomitant increase in the frequency of severe dry seasons. This dry period was punctuated by an extremely severe drought in 1983, associated with a strong EI Nino event. During early 1983, just 3 mm of rain fell over a 12-week period and temperatures were 2 degrees C above normal. This drought caused tree death (Leigh et al., 1990). In the 50 ha plot, forest-wide mortality was 3% per year during 1982-1985 but 2% per year during 1985-1990 (Condit et al., 1995; this data set).
Leaf area index
The LAI estimated is based on the average area (m2) of leaves per area (m2) of ground per year in the Lutz catchment (Leigh and Windsor, 1982). See below for litterfall collection methodology.
Litterfall
Litterfall was collected in litter traps randomly located on the BCI plateau above the 137-m contour (Foster, 1982) and in the Lutz catchment (Leigh and Wright, 1982) using comparable methods. Litter traps were polyethelene utility tubs, 19-cm deep, with a collecting surface of 0.083 m2 covered by 0.5-mm mesh screening. The number of tubs varied from 100 to 312 per year in each study. Trap contents were emptied weekly or bi-weekly, dried to a constant mass at 50 degrees C or 60 degrees C for 2 weeks or more, separated into leaves, twigs, flowers, fruit, and the remainder (trash), and weighed. Healey and Swift (1977) also measured litterfall for one year (1971) on the BCI plateau, presumably in larger traps (Leigh and Windsor, 1982).
Litterfall and forest floor mass were also collected over a 5-yr period from December 1986 through December 1990 (Wright and Cornejo, 1990a, b; Wieder and Wright, 1995; Cavelier et al., 1999). Forty leaf traps with a surface area of 0.25 m2 were deployed in 2.25 ha plots located in Poacher's Peninsula, the southernmost extension of BCI. Constructed with PVC tubing and 1.2 mm mesh screening, the traps were mounted 40-cm above the soil and emptied weekly. Plant material was dried to a constant weight at 60 degrees C and weighed to the nearest 0.1 g. The results from non-irrigated plots are presented in this data set.
Herbivory
Herbivory was estimated from leaf litterfall between 1974 and 1977 by measuring the proportion of the area of fallen leaves that consisted of holes and gaps, guessing (where necessary) the outline a leaf had when intact from fragment in hand and then estimating the dry weight of the missing matter. Leigh and Windsor (1982) assumed that this represented the weight of the foliage consumed by insect herbivores in forming the holes and gaps. Whole leaf consumption by vertebrate herbivores was estimated.
Above-ground Biomass
Estimates of dry, living, above-ground biomass standing stock and its turnover in the 50-hectare forest plot were obtained using inventory data collected every 5 years from 1985 to 2000. All stems ≥ 1 cm in diameter were mapped, tagged, measured, and identified to species between 1981 and 1983. The census was repeated in 1985 and every 5 years thereafter. More than 200,000 individual trees of over 300 species were recorded in each census. From 1985 forward, trunk diameter was measured to the nearest mm at 1.30-m above ground or above buttresses.
The heights of 1,414 trees of 83 species in the study plot were estimated using a Laser rangefinder. Height was modeled as a function of diameter using an asymptotic allometric regression (see Chave et al., 2003).
Wood specific gravity (oven-dry weight divided by green volume) is known for 123 species occurring in the study plot, mostly from the literature, but also from field work at BCI (H.C. Muller-Landau, unpublished results). For some species, only wood density at 12% moisture content was available; these were converted to wood specific gravity by multiplying by 0.8 (Brown, 1997). For the remaining species, the average of the mean density of the 123 known species (0.54 g/cm3) was used. This average is lower than the mean reported by Brown (1997) for tropical America (0.60 g/cm3, averaged over 470 species). All estimates of wood density are reported in Chave et al. (2003).
Four allometric regression equations from the literature (Brown et al., 1989; Chambers et al., 2001; Chave et al., 2001; Table 1 in Chave et al., 2003) were used to estimate above-ground biomass of trees > 1 cm diameter as a function of stem diameter, tree height, and wood specific gravity. The four equations yielded comparable but statistically different estimates. Method 4 in Chave et al. (2003) from Brown et al. (1989) had the highest correlation with other methods. The results obtained by this method are reported in this data set. Different regressions were used for saplings (Hughes et al., 1999) and lianas (Putz, 1983; Gerwing and Farias, 2000).
Mortality
Mortality rates of 205 tree and shrub species in the 50 ha study plot were estimated during two intervals, 1982-1985 and 1985-1990, for two size classes, trees 1-10 and > 10 cm in diameter. The severe dry season of 1983 was the focus of the study, since prior observations had demonstrated that it caused mortality in the forest. Mortality was defined as death or disappearance. Four different states of death were recorded: a standing stem, a fallen or broken stem, no stem at all but with the tree's tag located, and neither stem or tag remaining. Many trunks were never found, as even large trees often died and completely rotted away during the five year interval. Stems that snapped but resprouted were considered alive.
ANPP
A preliminary above-ground carbon budget was constructed by combining the results of Chave et al. (2003) with previously published data (Leigh & Windsor 1982; S.J. Wright, personal communication, cited in Leigh 1999; Wright et al., 1994; Leigh & Windsor 1982; Leigh 1999). The components of the carbon budget include litterfall, herbivory, coarse wood fall, and tree growth.
Climate
Precipitation and air temperature provided in this data set were recorded on an instrumented tower 1.0-m above ground at the forest site in the Lutz watershed on BCI, from 1929 through 1997 for precipitation and from 1972 through 1997 for minimum/maximum temperature. Additional meteorological information for this site is available at http://www.striweb.org/tesp.
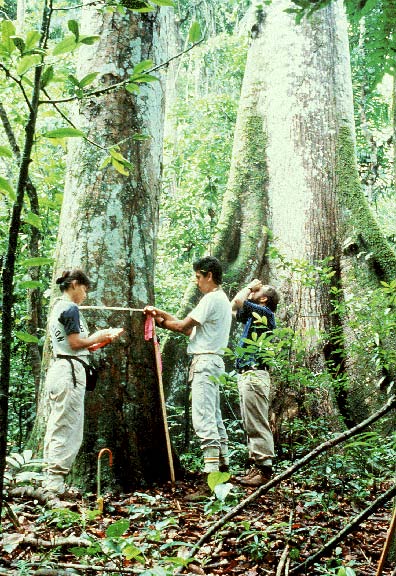
Figure 2. Measuring the dbh [diameter at breast height] of a Prioria copaifera tree (Fabaceae) at the Barro Colorado tropical forest site, Panama. (Zenith Batista and Eduardo Sierra, field supervisors and botanists, are taking the measurements, while Robin Foster [right] is looking through binoculars at the leaves to identify the species. The tree in the background is a Ceiba pentandra (Bombacaceae), one of the largest individuals in the experimental plot. Photograph taken 1990).
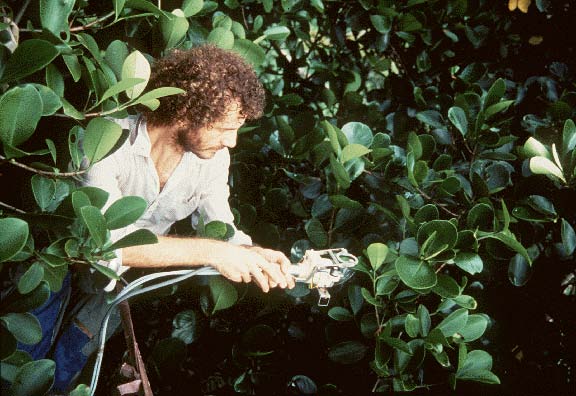
Figure 3. Use of a portable photosynthesis system for leaf gas exchange measurements at the Barro Colorado tropical forest site, Panama. (Gerhard Zotz, a German doctoral student, is using a clampon leaf chamber and infra-red gas analyzer [Heinz Walz, Effettrich, Germany] on leaves of Clusia uvitana. Photograph taken around 1995 by Marcos Guerra, STRI).
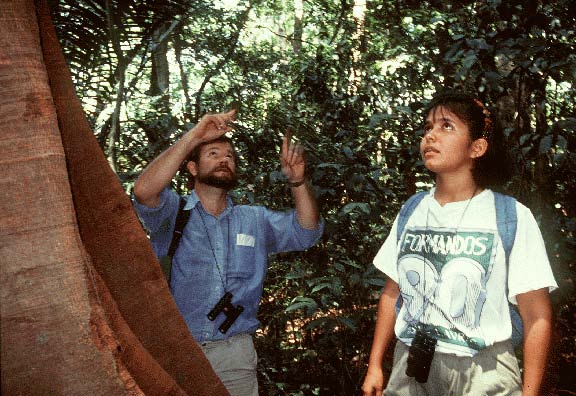
Figure 4. Discussion of light competition between trees in the forest canopy at the Barro Colorado tropical forest site, Panama. (Dr. Robin Foster [left] is instructing Bolivian student Marielos Pena The buttressed tree on the left is a Tachigali versicolor [Fabaceae]. Photograph taken 1992 by Marcos Guerra, STRI).
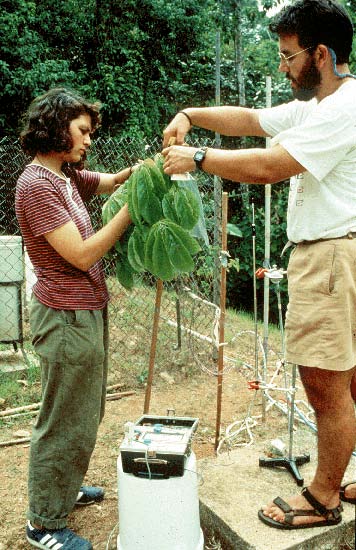
Figure 5. Physiological measurements on a sapling of Pseudobombax sp. at the Barro Colorado tropical forest site, Panama. (Jose Luis Machado and Sandra Patino, both from Colombia, are measuring light intensity and electrical resistance of the leaves. Photograph taken 1993-1995).

Figure 6. Data analysis on a laptop computer at the Barro Colorado tropical forest site, Panama. (Virginia Velez and Damon Kyllo [University of Missouri, USA] are working in the greenhouse near the study site. Photograph taken around 1992).
6. Data Access:
This data set is available through the Oak Ridge National Laboratory (ORNL) Distributed Active Archive Center (DAAC).
Data Archive Center:
E-mail: uso@daac.ornl.gov
Telephone: +1 (865) 241-3952
7. References:
Brown, S. 1997. Estimating Biomass and Biomass Change of Tropical Forests: a Primer. UN FAO Forestry Paper 134. Food and Agriculture Organization, Rome.
Chambers, J. Q., J. dos Santos, R. J. Ribeiro, and N. Higuchi. 2001. Tree damage, allometric relationships, and aboveground net primary production in central Amazon forest. Forest Ecology and Management 152: 73-84.
Chave, J., R. Condit, S. Lao, J. P. Caspersen, R. B. Foster, and S. P. Hubbell. 2003. Spatial and temporal variation of biomass in a tropical forest: results from a large census plot in Panama. Journal of Ecology 91: 240-252.
Condit, R., S. P. Hubbell, and R. B. Foster. 1995. Mortality rates of 205 neotropical tree and shrub species and the impact of a severe drought. Ecological Monographs 65: 419-439.
Foster, R. B. 1982. The seasonal rhythm of fruitfall on Barro Colorado Island, pp. 151-172. In: Leigh, E. G. Jr., Rand, S. A. & Windsor, D. M. (eds.) The Ecology of a Tropical Forest: Seasonal Rhythms and Long-Term Changes. Smithsonian Institution Press, Washington, DC.
Healey, I. N., and M. J. Swift. 1977. A one-year study of litter decomposition in the Barro Colorado Island forest. Abstract, IV International Symposium on Tropical Ecology, Panama.
Leigh and Windsor. 1982. Forest production and regulation of primary consumers on Barro Colorado Island, pp. 111-122. In: Leigh, E. G. Jr., Rand, S. A. & Windsor, D. M. (eds.) The Ecology of a Tropical Forest: Seasonal Rhythms and Long-Term Changes. Smithsonian Institution Press, Washington, DC.
Olson, R. J., K.R. Johnson, D.L. Zheng, and J.M.O. Scurlock. 2001. Global and Regional Ecosystem Modeling: Databases of Model Drivers and Validation Measurements. ORNL Technical Memorandum TM-2001/196. Oak Ridge National Laboratory, Oak Ridge, Tennessee, U.S.A.
Wieder, R. K., and S. J. Wright. 1995. Tropical Forest Litter Dynamics and Dry Season Irrigation on Barro Colorado Island, Panama. Ecology 76(6): 1971-1979.
Additional Sources of Information:
Bennett, H. H. 1929. Soil reconnaissance of the Panama Canal zone and contiguous territory. Techn. Bull. USDA 94: 1-46.
Brown, S., A. Gillespie, and A. Lugo. 1989. Biomass estimation methods for tropical forests with applications to forest inventory data. Forest Science 3: 881-902.
Cavelier, J., S. J. Wright, and J. Santamaria. 1990. Effects of irrigation on litterfall, fine root biomass and production in a
semideciduous lowland forest in Panama. Plant and Soil 211: 207-213.
Chave, J., B. Riéra, and M.-A. Dubois. 2001. Estimation of biomass in a neotropical forest of French Guiana: spatial and temporal variability. Journal of Tropical Ecology 17: 79-96.
Clark, D. A., S. Brown, D. W. Kicklighter, J. Q. Chambers, S. T. Gower, J. Thomlinson, and J. Ni. 2001a. Measuring net primary production in forests: a synthesis of current concepts and field methods. Ecological Applications 11(2): 356-370.
Clark, D. A., S. Brown, D. W. Kicklighter, J. Q. Chambers, J. R. Thomlinson, J. Ni, and E. A. Holland. 2001b. Net primary production in tropical forests: an evaluation and synthesis of existing field data. Ecological Applications 11(2): 371-384.
Condit, R. 1995. Research in large, long-term tropical forest plots. Trends in Ecology and Evolution 10: 18-22.
Condit, R. 1998. Tropical Forest Census Plots: Methods and Results from Barro Colorado Island, Panama and a Comparison with Other Plots. Springer-Verlag, Berlin. 211 pp.
Condit, R., K. Watts, S. A. Bohlman, R. Perez, R. B. Foster, and S. P. Hubbell. 2001. Quantifying the deciduousness of tropical forest canopies under varying climates. Journal of Vegetation Science 11: 649-658.
Cornejo, F. H., A. Varela, and S. J. Wright. 1994. Tropical forest litter decomposition under seasonal drought - nutrient release, fungi and bacteria. Oikos 70: 183-190.
Croat, T. B. 1978. Flora of Barro Colorado Island. Stanford University Press, Stanford, California.
Delaney, M., S. Brown, A. Lugo, A. Torres-Lezama, and N. B. Quintero. 1998. The quantity and turnover of dead wood in permanent forest plots in six life zones of Venezuela. Biotropica 30: 2-11.
Harms, K., R. Condit, S. P. Hubbell, and R. B. Foster. 2001. Habitat associations of trees and shrubs in a 50-ha neotropical forest plot. Journal of Ecology 89: 947-959.
Hubbell, S. P., and R. B. Foster. 1983. Diversity of canopy trees in a neotropical forest and implications for conservation, pp. 25-41. In: Sutton, S. L., T. C. Whitmore, and A. D. Chadwick (eds.). Tropical Rain Forest: Ecology and Management. Blackwell Scientific, Oxford.
Leigh, E. G., Jr . 1999. Tropical Forest Ecology: A View from Barro Colorado Island. Oxford University Press, New York.
Leigh, E. G., Jr., A. S. Rand, and D. M. Windsor (eds.). 1982. The Ecology of a Tropical Forest: Seasonal Rhythms and Long-term Changes. Smithsonian Institution, Washington DC. 468 pp.
Leigh, E. G. Jr., D. M. Windsor, S. A. Rand, and R. B., Foster. 1990. The impact of the 'EI Niño' drought of 1982-1983 on a Panamanian semideciduous forest. In: Glynn, P.W. (ed.) Global Ecological Consequences of the 1982-1983 El Niño-Southern Oscillation, pp. 473-486. Elsevier, Amsterdam.
Leigh, E. G., Jr., and S. J. Wright. 1993. Barro Colorado Island and Tropical Biology, pp.28-47. In: Gentry, A. H. (ed.). Four Neotropical Rainforests. Yale University Press.
Malhi, Y., D. D. Baldocchi, and P. J. Jarvis. 1999. The carbon balance of tropical, temperate, and boreal forests. Plant, Cell and Environment 22: 715-740.
Scurlock, J.M.O., and R.J. Olson. 2002. Terrestrial net primary productivity - A brief history and a new worldwide database. Environ. Rev. 10(2): 91-109. doi:10.1139/a02-002
Scurlock, J.M.O., and R.J. Olson. 2013. NPP Multi-Biome: Grassland, Boreal Forest, and Tropical Forest Sites, 1939-1996, R1. Data set. Available on-line [http://daac.ornl.gov] from Oak Ridge National Laboratory Distributed Active Archive Center, Oak Ridge, Tennessee, USA doi:10.3334/ORNLDAAC/653
Windsor, D. M. 1990. Climate and moisture variability in a tropical forest: long-term records from Barro Colorado Island, Panama. Smithsonian Contribution to the Earth Sciences, no. 29. Smithsonian Institution Press, Washington, DC.
Wright, S. J. and F. H. Cornejo. 1990a. Seasonal drought and leaf fall in a tropical forest. Ecology 71: 1165-1175.
Wright, S. J., and F. H. and Cornejo. 1990b. Seasonal drought and the timing of flowering and leaf fall in a Neotropical forest. In: Bawa, K., and H. Hadley (eds.). The Reproductive Ecology of Tropical Forest Plants. UNESCO, Paris.
Wright, S. J., M. E. Gompper, and B. De Leon. 1994. Are large predators keystone species in Neotropical forests? The evidence from Barro Colorado Island. Oikos, 71: 279-294.
Supplementary Material:
The following materials are available from http://www.blackwellpublishing.com/products/journals/suppmat/JEC/JEC757/JEC757sm.htm:
Table A1. Specific gravity (g/cm3) of species present in the BCI 50-ha plot.
Table A2. Above-ground biomass (in Mg/ha) for each of the 317 species occurring in the 50-ha permanent plot of BCI between 1985 and 2000.
8. Data Set Revisions:
Revision Summary:
Preliminary, unpublished above-ground biomass (AGbiomass) values in the data file, brr_npp.txt, have been replaced with those reported in Table 2 on Page 244 of Chave et al. (2003).
The temporal coverage of the NPP file has been extended to reflect the addition of the new AGbiomass data (i.e., 1969-2000).
Annual litterfall data for 1990 have been replaced with time series annual litterfall for years 1986 through 1990, as reported in Table 1 on Page 1974 of Wieder and Wright (1995).
Leaf litterfall (leaflittfall) value for 1990 from Leigh and Wright (1993) has been deleted because comparable leaf litterfall component data are not reported in Wieder and Wright (1995).
A preliminary above-ground carbon budget has been added from Chave et al (2003).
The References / Comments for the revised AGbiomass, litterfall, and ANPP data have been updated.
The location of LAI measurements has been added to the Treatment column of the data file.
All other NPP values in the data file are not affected.
Data File Changes:
Several AGbiomass and Totlittfall
data values have been corrected by
replacing them with values in sources described above. ANPP component data have been added. The data values
in brr_npp_r1.txt are now correct.
| Parameter in Data Set * | Uncorrected in brr_npp.txt | Corrected in brr_npp_r1.txt |
|---|---|---|
| Temporal Coverage | 1969-1990 | 1969-2000 |
| Treatmt (LAI) | none | Lutz |
| Totlittfall (1986) (Units = g/m2/y) | ** | 1420 |
| Totlittfall (1987) (Units = g/m2/y) | ** | 1411 |
| Totlittfall (1988) (Units = g/m2/y) | ** | 1210 |
| Totlittfall (1989) (Units = g/m2/y) | ** | 1172 |
| Totlittfall (1990) (Units = g/m2/y) | 1366*** | 1016 |
| Leaflittfall (1990) (Units = g/m2/y) | 789 | **** |
| AGbiomass (1985) (Units = g/m2) | 20663 | 27200 |
| AGbiomass (1990) (Units = g/m2) | 20589 | 27700 |
| AGbiomass (1995) (Units = g/m2) | 20459 | 27300 |
| AGbiomass (2000) (Units = g/m2) | ** | 27500 |
| Totlittfall (1985-2000) (Units = g/m2/y) | ** | 1120 |
| ins_herbiv (1985-2000) (Units = g/m2/y) | ** | 50 |
| verte_herbiv (1985-2000) (Units = g/m2/y) | ** | 30 |
| wood_fall (1985-2000) (Units = g/m2/y) | ** | 46 |
| tree_growth (19852000) (Units = g/m2/y) | ** | 554 |
| ANPP (1985-2000) (Units = g/m2/y) | ** | 1800 |
Notes:
* = See data set Guide document for parameter definitions.
** = Not reported in brr_npp.txt
*** = Value is from a different source [Leigh and Wright in Gentry (1993)].
**** = Leaflittfall value for 1990 from Leigh and Wright (1993) deleted because comparable leaf litterfall component data not reported in Wieder and Wright (1995).
Data User Action: If you downloaded this data set from the ORNL DAAC before September 6, 2013, you should download it again from the ORNL DAAC.
Revision History:
Original Citation
Condit, R., D.M. Windsor, and S.P. Hubbell. 1996. NPP Tropical Forest: Barro Colorado, Panama, 1969-1990. Data set. Available on-line [http://daac.ornl.gov] from Oak Ridge National Laboratory Distributed Active Archive Center, Oak Ridge, Tennessee, U.S.A.