Documentation Revision Date: 2018-05-24
Data Set Version: 1
Summary
The WRF-STILT particle trajectories and footprints were used to compute enhancements (over background values) of hourly CO2 values due to regional surface fluxes, over the Boston metropolitan area.
There are 18 monthly data files with this dataset provided as TAR/GZIP files (*.tar.gz). When uncompressed, each monthly file contains 48 files per day (24 hourly files at 2 receptors) in NetCDF (.nc4) format.
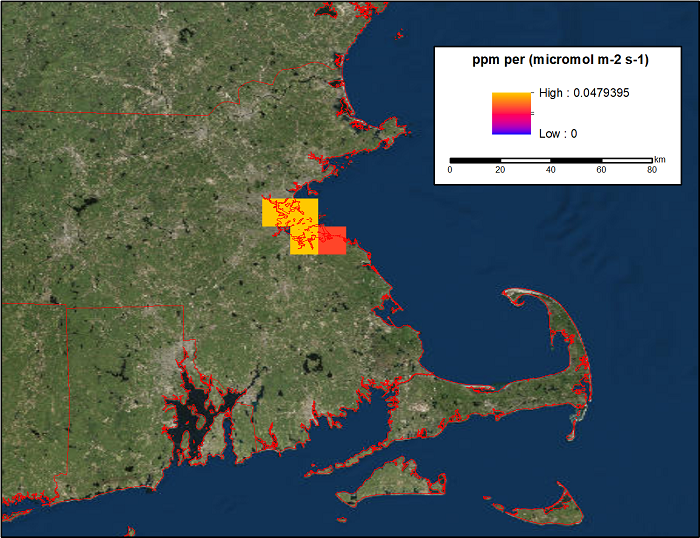
Figure 1. Data from the WRF-STILT model representing the response of a receptor in Boston, Massachusetts to a unit surface emission of CO2 (ppm/umol m-2 s-1).
Citation
Nehrkorn, T., M. Sargent, S.C. Wofsy, and M. Mountain. 2018. WRF-STILT Particle Trajectories for Boston, MA, USA, 2013-2014. ORNL DAAC, Oak Ridge, Tennessee, USA. https://doi.org/10.3334/ORNLDAAC/1596
Table of Contents
- Data Set Overview
- Data Characteristics
- Application and Derivation
- Quality Assessment
- Data Acquisition, Materials, and Methods
- Data Access
- References
Data Set Overview
This dataset provides Weather Research and Forecasting (WRF) Stochastic Time-Inverted Lagrangian Transport (STILT) particle trajectory data products for two receptors located in Boston, Massachusetts, USA, for July 2013 - December 2014. Meteorological fields from version 3.6.1 of the Weather Research and Forecasting model are used to drive STILT. STILT applies a Lagrangian particle dispersion model backwards in time from a measurement location (the "receptor" location), to create the adjoint of the transport model in the form of a "footprint" field. The footprint, with units of mixing ratio (ppm) per surface flux (umol m-2 s-1), quantifies the influence of upwind surface fluxes on CO2 and CH4 concentrations measured at the receptor and is computed by counting the number of particles in a surface-influenced volume and the time spent in that volume. Footprints are provided for the two receptors at two temporal and spatial scales: three days of surface influence over the whole North American coverage area at 1-degree resolution and 24 hours of surface influence within a smaller region close to the measurement locations ('near field') at 0.1-degree resolution.
The WRF-STILT particle trajectories and footprints were used to compute enhancements (over background values) of hourly CO2 values due to regional surface fluxes, over the Boston metropolitan area.
Project: North American Carbon Program (NACP)
The North American Carbon Program (NACP) is a multidisciplinary research program to obtain scientific understanding of North America's carbon sources and sinks and of changes in carbon stocks needed to meet societal concerns and to provide tools for decision makers. The NACP is supported by a number of different federal agencies. The central objective is to measure and understand the sources and sinks of Carbon Dioxide (CO2), Methane (CH4), and Carbon Monoxide (CO) in North America and in adjacent ocean regions.
Related Dataset:
Gridded footprint data on a 1km grid from these model runs are also available as a separate dataset from the ORNL DAAC..
Nehrkorn, T., M. Sargent, S.C. Wofsy, and M. Mountain. 2018. WRF-STILT Gridded Footprints for Boston, MA, USA, 2013-2014. ORNL DAAC, Oak Ridge, Tennessee, USA. https://doi.org/10.3334/ORNLDAAC/1572
Acknowledgements:
This research was supported by the National Aeronautics and Space Administration (grants NNH13CK02C and NNX16AP23G).
Data Characteristics
Spatial Coverage: Footprints were calculated for all of North America and for the 'near field' area surrounding Boston, Massachusetts
Spatial Resolution: 1-degree for foot1 data; 0.1-degree for footnearfield1 data
Temporal Coverage: 2013-07-01 to 2014-12-31
Temporal Resolution: Hourly
Study Area (coordinates in decimal degrees)
| Site | Westernmost Longitude | Easternmost Longitude | Northernmost Latitude | Southernmost Latitude |
|---|---|---|---|---|
| Boston University (receptor location) | -71.1040 | -71.1040 | 42.3500 | 42.3500 |
| Copley Square, Boston (receptor location) | -71.084 | -71.084 | 42.347 | 42.347 |
| Boston region (footnearfield1 variable) | -76.1 | -66.1 | 45.85 | 38.85 |
There are 18 monthly data files with this dataset provided as TAR/GZIP files (*.tar.gz). They are named by year and month (for example, stilt-201310.tar.gz and stilt-201410.tar.gz).
When uncompressed, each of the 18 monthly files contains 48 files per day (24 hourly files at 2 receptors), for a total of 26,304 files, provided in NetCDF (.nc4) format.
The files provide particle trajectories (and lat-lon gridded footprints) from WRF-STILT simulations for one particle receptor location. Each file aggregates the particle data on a lat/lon/time grid starting at the STILT simulation start time.
NetCDF data file naming convention:
The files are named by year, month, day, hour, minute, latitude, longitude, and height A.G.L. in meters, separated by an x.
Example file name: stilt2014x12x31x23x00x42.3500Nx071.1040Wx00029.nc. This file contains the modeled particle trajectories for December 31, 2014 at 23:00 UTC. The observation was taken at 42.3500N, 71.1040W at 29 m above ground level, Boston University.
For a description of the naming elements in the example file name, refer to Table 1.
Table 1. Description of elements in the example file name
| Name element | Example value | Units |
|---|---|---|
| Year | 2014 | YYYY |
| Month | 12 | MM |
| Day | 31 | DD |
| Hour | 23 | hh (UTC) |
| Minute | 00 | mm (UTC) |
| Latitude | 42.3500N | decimal degrees |
| Longitude | 71.1040W | decimal degrees |
| Height A.G.L. | 00029 | m |
Data Variables
Surface influence fields
The first diagnostic surface influence field, represented by the foot1 variable in the NetCDF files, provides 3 days of surface influence representing the response of the receptor to a unit surface emission (ppm/umol m-2 s-1) of CO2 in each 1 x 1-degree grid cell within the whole area of coverage (169.5W to 50.5W and 10.5N to 69.5N) at hourly temporal resolution.
The second diagnostic surface influence field, represented by the footnearfield1 variable in the NetCDF files, provides 24 hours of surface influence representing the response of the receptor to a unit surface emission (ppm/umol m-2 s-1) of CO2 in each 0.1- x 0.1-degree grid cell within a small region close to the measurement location (centered on the receptor location, covering 10 degrees in longitude and 7 degrees in latitude) at hourly temporal resolution.
Data Dictionary
Table 2. Data variables in each NetCDF file. Fill values or missing data were set to -1.0E34 for all variables.
| Variable | Units | Description |
|---|---|---|
| checkbasic | Basic output from Trajeccheck() | |
| checkbasicnames | Names for checkbasic 1D array | |
| checksum | Checksum array | |
| checksumdate | days since 2000-01-01 00:00:00 UTC | Checksum date |
| endpts | Stilt particle location array thinned to retain rows containing trajectory endpoints | |
| checksumnames | Column names for checksum array | |
| endptsdate | days since 2000-01-01 00:00:00 UTC | end points date |
| endptsnames | Column names for particle array "endpts" | |
| foot1 | ppm per (umol m-2 s-1) | Gridded STILT footprint |
| foot1date | days since 2000-01-01 00:00:00 UTC | Date of foot1 |
| foot1hr | hours | Hours back from STILT start time |
| foot1lat | degrees_north | Degrees latitude of center of grid cells |
| foot1lon | degrees_east | Degrees longitude of center of grid cells |
| footnearfield1 | ppm per (umol m-2 s-1) | Gridded STILT footprint |
| footnearfield1date | days since 2000-01-01 00:00:00 UTC | Date for 'footnearfield1' |
| footnearfield1hr | hours | Hours back from STILT start time for 'footnearfield1' |
| footnearfield1lat | degrees_north | Degrees latitude of center of grid cells |
| footnearfield1lon | degrees_east | Degrees longitude of center of grid cells |
| ident | Identifier string | |
| nchar | Numeric identifier | |
| origagl | meters | Original receptor height above ground before rounding for STILT |
| origlat | degrees_north | Original receptor latitude |
| origlon | degrees_east | Original receptor longitude |
| origutctime | UTC time | Original receptor time |
| origutctimeformat | Original receptor time format | |
| part3d | Stilt particle location array thinned to retain rows approximately every so many hours | |
| part3ddate | days since 2000-01-01 00:00:00 UTC date of part3d | |
| part3dnames | Column names for particle array "part3d" | |
| partfoot | Stilt particle location array thinned to retain rows where foot > 0 | |
| partfootdate | days since 2000-01-01 00:00:00 UTC date of partfoot | |
| partfootnames | Column names for particle array "partfoot" | |
| emitwindow | hours, x grid lengths, y grid lengths, z grid lengths | Variables identified by the emitwindownames string array |
| emitwindownames | various | Describe the emission time and space window of particle releases at receptor |
Application and Derivation
STILT footprints support accurate estimates of CO2 and CH4 surface-atmosphere fluxes.
Quality Assessment
Extensive evaluation of WRF meteorological fields, PBL height, and WRf-STILT simulated enhancements are included in Sargent et al. (2018).
Data Acquisition, Materials, and Methods
WRF-STILT Simulations
The Weather Research and Forecasting (WRF; Powers et al., 2017) Stochastic Time-Inverted Lagrangian Transport (STILT) coupled model was used to derive particle trajectory data for two receptors located in Boston, Massachusetts, USA. The receptors were located at Boston University and at Copley Square, Boston.
The WRF-STILT coupled model is described in Nehrkorn et al. (2010). The methods used here are consistent with Henderson et al. (2015). For more information, see Sargent et al. (2018).
Gridded footprint data on a 1km grid from these model runs are also available as a separate dataset from the ORNL DAAC at https://doi.org/10.3334/ORNLDAAC/1572. The footprint data are also provided in this dataset alongside the particle data.
Data Access
These data are available through the Oak Ridge National Laboratory (ORNL) Distributed Active Archive Center (DAAC).
WRF-STILT Particle Trajectories for Boston, MA, USA, 2013-2014
Contact for Data Center Access Information:
- E-mail: uso@daac.ornl.gov
- Telephone: +1 (865) 241-3952
References
Henderson, J.M., J. Eluszkiewicz, M.E. Mountain, T. Nehrkorn, R.Y.-W. Chang, A. Karion, J.B. Miller, C. Sweeney, N. Steiner, S.C. Wofsy, and C.E. Miller. 2015. Atmospheric transport simulations in support of the Carbon in Arctic Reservoirs Vulnerability Experiment (CARVE). Atmos. Chem. Phys. 15:4093-4116. https://doi.org/10.5194/acp-15-4093-2015, 2015
Nehrkorn, T., J. Eluszkiewicz, S.C. Wofsy, J.C. Lin, C. Gerbig, M. Longo, and S. Freitas. 2010. Coupled weather research and forecasting-stochastic time-inverted lagrangian transport (WRF-STILT) model. Meteorol. Atmos. Phys. 107:51-64. doi:10.1007/s00703-010-0068-x
Powers, J.G., J.B. Klemp, W.C. Skamarock, C.A. Davis, J. Dudhia, D.O. Gill, J.L. Coen, D.J. Gochis, R. Ahmadov, S.E. Peckham, G. A. Grell, J. Michalakes, S. Trahan, S.G. Benjamin, C.R. Alexander, G.J. Dimego, W. Wang, C.S. Schwartz, G. S. Romine, Z. Liu, C. Snyder, F. Chen, M.J. Barlage, W. Yu, and M.G. Duda. The Weather Research and Forecasting model: Overview, system efforts, and future directions. Bull. Amer. Meteor. Soc., 98(8):1717 - 1737, 2017. doi:10.1175/BAMS-D-15-00308.1.
Sargent, M., Y. Barrera, T. Nehrkorn, L.R. Hutyra, C. Gately, K. McKain, C. Sweeney, J. Hegarty, B. Hardiman, and S. Wofsy, 2018: Monitoring anthropogenic and biogenic CO2 in the Boston area using atmospheric measurements in an inversion framework, in preparation.