Documentation Revision Date: 2018-05-18
Data Set Version: 1
Summary
The WRF-STILT particle trajectories and footprints were used to compute enhancements (over background values) of CO2 due to surface fluxes over the Boston metropolitan area.
There are 18 monthly data files with this dataset provided as TAR/GZIP files (*.tar.gz). When uncompressed, each monthly file contains 48 files per day (24 hourly files at 2 receptors) in NetCDF (.nc4) format.
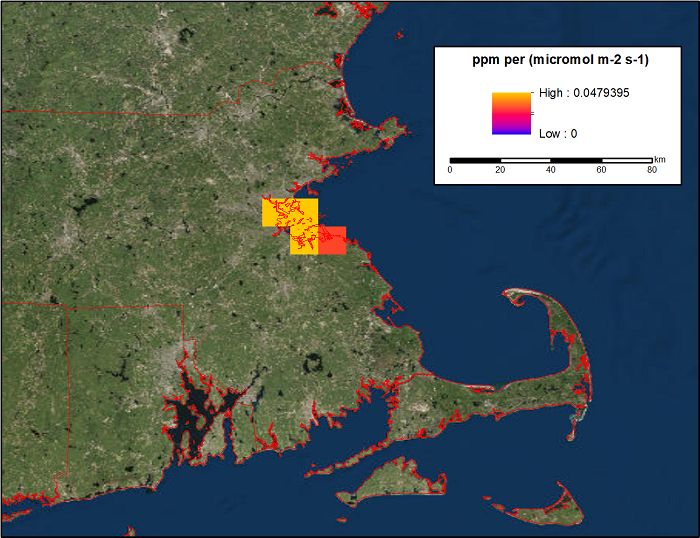
Figure 1. Data from the WRF-STILT model for emissions of CO2 (ppm/umol m-2 s-1) in Boston, Massachusetts.
Citation
Nehrkorn, T., M. Sargent, S.C. Wofsy, and M. Mountain. 2018. WRF-STILT Gridded Footprints for Boston, MA, USA, 2013-2014. ORNL DAAC, Oak Ridge, Tennessee, USA. https://doi.org/10.3334/ORNLDAAC/1572
Table of Contents
- Data Set Overview
- Data Characteristics
- Application and Derivation
- Quality Assessment
- Data Acquisition, Materials, and Methods
- Data Access
- References
Data Set Overview
This dataset provides Weather Research and Forecasting (WRF) Stochastic Time-Inverted Lagrangian Transport (STILT) footprint data products for two receptors located in Boston, Massachusetts, USA, for July 2013 - December 2014. The data are gridded footprints on a 1-km grid congruent with the ACES emissions inventory. Meteorological fields from version 3.6.1 of the Weather Research and Forecasting model are used to drive STILT. STILT applies a Lagrangian particle dispersion model backwards in time from a measurement location (the "receptor" location), to create the adjoint of the transport model in the form of a "footprint" field. The footprint, with units of mixing ratio (ppm) per surface flux (umol m-2 s-1), quantifies the influence of upwind surface fluxes on CO2 and CH4 concentrations measured at the receptor and is computed by counting the number of particles in a surface-influenced volume and the time spent in that volume.
The WRF-STILT particle trajectories and footprints were used to compute enhancements (over background values) of CO2 due to surface fluxes over the Boston metropolitan area.
User Notes:
- This dataset contains only the gridded surface influence-function footprints on the 1 km ACES grid.
- The related dataset (Nehrkorn et al., 2018) provides both gridded footprints (on latitude-longitude grids) and the particle trajectory data (the time-dependent location of each of 500 particles on their backwards-in-time trajectories).
- Users may find these gridded footprint data files more convenient since they are much smaller in size and most end-users are only interested in this final component of the model output.
Project: North American Carbon Program (NACP)
The North American Carbon Program (NACP) is a multidisciplinary research program to obtain scientific understanding of North America's carbon sources and sinks and of changes in carbon stocks needed to meet societal concerns and to provide tools for decision makers. The NACP is supported by a number of different federal agencies. The central objective is to measure and understand the sources and sinks of Carbon Dioxide (CO2), Methane (CH4), and Carbon Monoxide (CO) in North America and in adjacent ocean regions.
Related datasets
Nehrkorn, T., M. Sargent, S.C. Wofsy, and M. Mountain. 2018. WRF-STILT Particle Trajectories for Boston, MA, USA, 2013-2014. ORNL DAAC, Oak Ridge, Tennessee, USA. https://doi.org/10.3334/ORNLDAAC/1596
Gately, C., and L.R. Hutyra. 2018. CMS: CO2 Emissions from Fossil Fuels Combustion, ACES Inventory for Northeastern USA. ORNL DAAC, Oak Ridge, Tennessee, USA. https://doi.org/10.3334/ORNLDAAC/1501
Acknowledgements
This research was supported by the National Aeronautics and Space Administration (grants NNH13CK02C and NNX16AP23G).
Data Characteristics
Spatial Coverage: Boston, Massachusetts and area congruent with the ACES emissions inventory, Northeastern USA
Spatial Resolution: 1 x 1 km
Temporal Coverage: 2013-07-01 to 2014-12-31
Temporal Resolution: Hourly
Study Area (coordinates in decimal degrees)
| Site | Westernmost Longitude | Easternmost Longitude | Northernmost Latitude | Southernmost Latitude |
|---|---|---|---|---|
| Boston University (receptor) | -71.1040 | -71.1040 | 42.35 | 42.35 |
| Copley Square (receptor) | -71.084 | -71.084 | 42.347 | 42.347 |
| Area congruent with the ACES emissions inventory, Northeastern USA: foot1 and foot1_int10_resmedian variables | -81.7794 | -65.9319 | 49.19362 | 34.51113 |
There are 18 monthly data files with this dataset provided as TAR/GZIP files (*.tar.gz). They are named by year and month (for example, foot1km-201310.tar.gz and foot1km-201410.tar.gz).
When uncompressed, each of the 18 monthly files contains 48 files per day (24 hourly files at 2 receptors), 26,304 files total, provided in NetCDF (.nc4) format.
NetCDF file naming convention:
The files provided in the zipped files above are named according to the following naming convention:
foot year, month, day, hour, minute, latitude, longitude, and height A.G.L. in meters, separated by an x.
Example file name: foot2014x12x31x23x00x42.3500Nx071.1040Wx00029.nc4
This file contains the modeled footprints for December 31, 2014 at 23:00 UTC. The observation was taken at 42.3500N, 71.1040W at 29 m above ground level.
Table 1. Description of elements in the data file name
| Name element | Example value | Units |
|---|---|---|
| Year | 2014 | YYYY |
| Month | 12 | MM |
| Day | 31 | DD |
| Hour | 23 | hh (UTC) |
| Minute | 00 | mm (UTC) |
| Latitude | 42.3500N | decimal degrees |
| Longitude | 71.1040W | decimal degrees |
| Height A.G.L. | 00029 | m |
Data Dictionary
Table 2. Variables in the data files
| Variable name | Units | Description |
| foot1 | ppm per (umol m-2 s-1) | Gridded STILT footprint |
| foot1date | days | Date of foot1 (days since 2000-01-01 00:00:00 UTC) |
| foot1hr | hours | Hours back from STILT start time |
| foot1lat_meters | meters | Latitude of SW corner of grid cell on the projected map coordinate system |
| foot1lon_meters | meters | Longitude of SW corner of grid cell on the projected map coordinate system |
| ident | Identifier string | |
| nchar | Numeric identifier | |
| origagl | meters | Original receptor height above ground before rounding for STILT |
| origlat | degrees_north | Original receptor latitude |
| origlon | degrees_east | Original receptor longitude |
| origutctime | UTC time | Original receptor time |
| origutctimeformat | Original receptor time format | |
| foot1_int10_resmedianlon_meters | meters | Latitude of SW corner of grid cell on the projected map coordinate system |
| foot1_int10_resmedianlat_meters | meters | Longitude of SW corner of grid cell on the projected map coordinate system |
| foot1_int10_resmediandate | days | Date of foot1_int10_resmedian (days since 2000-01-01 00:00:00 UTC) |
| foot1_int10_resmedian | ppm per umol m-2 s-1 | Resampled version of the raw gridded footprints, in which footprints are time-interpolated during the first [hr] hours of the back trajectories, and are averaged in space after that time, by an averaging length determined by a combination of the particle spread in space and the median distance traveled by particles between footprint times |
| foot1_int10_resmedianhr | hours | Hours back from STILT start time |
Application and Derivation
STILT footprints support accurate estimates of CO2 and CH4 surface-atmosphere fluxes.
Quality Assessment
Extensive evaluation of WRF meteorological fields, PBL height, and WRf-STILT simulated enhancements are included in Sargent et al. (2018).
Data Acquisition, Materials, and Methods
WRF-STILT Simulations
The Weather Research and Forecasting (WRF; Powers et al., 2017) Stochastic Time-Inverted Lagrangian Transport (STILT) coupled model was used to simulate footprint data products for particle receptors located in Boston for July 2013 - December 2014. The receptors were located at Boston University and at Copley Square, Boston.
The related dataset (Nehrkorn et al., 2018) provides both the gridded footprints and the full particle trajectory data (the time-dependent location of each of 500 particles on their backwards-in-time trajectories).
The WRF-STILT coupled model is described in Nehrkorn et al. (2010). The methods used here are consistent with Henderson et al. (2015). For more information, see Sargent et al. (2018).
Data Access
These data are available through the Oak Ridge National Laboratory (ORNL) Distributed Active Archive Center (DAAC).
WRF-STILT Gridded Footprints for Boston, MA, USA, 2013-2014
Contact for Data Center Access Information:
- E-mail: uso@daac.ornl.gov
- Telephone: +1 (865) 241-3952
References
Gately, C., and L.R. Hutyra. 2017. CMS: CO2 Emissions from Fossil Fuels Combustion, ACES Inventory for Northeastern USA. ORNL DAAC, Oak Ridge, Tennessee, USA. https://doi.org/10.3334/ORNLDAAC/1501
Henderson, J.M., J. Eluszkiewicz, M.E. Mountain, T. Nehrkorn, R.Y.-W. Chang, A. Karion, J.B. Miller, C. Sweeney, N. Steiner, S.C. Wofsy, and C.E. Miller. 2015. Atmospheric transport simulations in support of the Carbon in Arctic Reservoirs Vulnerability Experiment (CARVE). Atmos. Chem. Phys. 15:4093-4116. https://doi.org/10.5194/acp-15-4093-2015, 2015
Nehrkorn, T., J. Eluszkiewicz, S.C. Wofsy, J.C. Lin, C. Gerbig, M. Longo, and S. Freitas. 2010. Coupled weather research and forecasting-stochastic time-inverted lagrangian transport (WRF-STILT) model. Meteorol. Atmos. Phys. 107:51-64. doi:10.1007/s00703-010-0068-x
Powers, J. G., J. B. Klemp, W. C. Skamarock, C. A. Davis, J. Dudhia, D. O. Gill, J. L. Coen, D. J. Gochis, R. Ahmadov, S. E. Peckham, G. A. Grell, J. Michalakes, S. Trahan, S. G. Benjamin, C. R. Alexander, G. J. Dimego, W. Wang, C. S. Schwartz, G. S. Romine, Z. Liu, C. Snyder, F. Chen, M. J. Barlage, W. Yu, and M. G. Duda. The Weather Research and Forecasting model: Overview, system efforts, and future directions. Bull. Amer. Meteor. Soc., 98(8):1717 - 1737, 2017. doi:10.1175/BAMS-D-15-00308.1
Sargent, M., Y. Barrera, T. Nehrkorn, L. R. Hutyra, C. Gately, K. McKain, C. Sweeney, J. Hegarty, B. Hardiman, and S. Wofsy, 2018: Monitoring anthropogenic and biogenic CO2 in the Boston area using atmospheric measurements in an inversion framework, in preparation.