Documentation Revision Date: 2021-12-08
Dataset Version: 1
Summary
There are 100 data files included in this dataset: 96 in GeoTIFF (*.tif) format and four in comma-separated values (CSV; *.csv) format. Also included is one companion file in Portable Document (*.pdf) format.
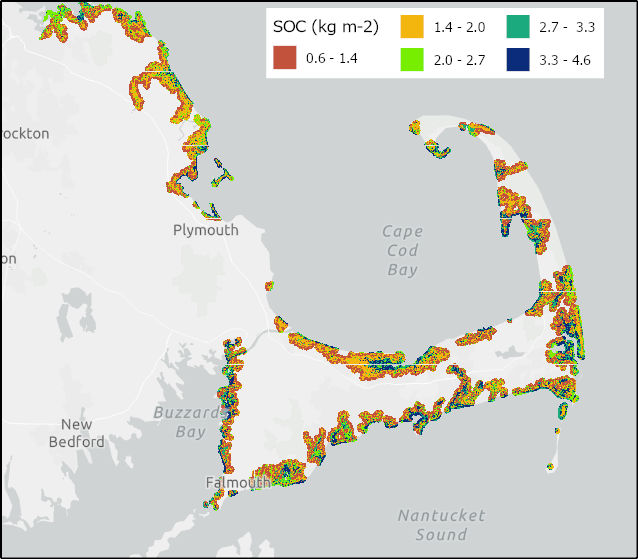
Figure 1. Predicted soil organic carbon (SOC) content of wetlands at 0-5 cm depth in the vicinity of Cape Cod, Massachusetts, U.S. Estimates represent the period 1998-2018 and were derived from publicly available data sources using a quantile regression forest model. Source: SOC_5cm_Zone2_QRF_Mean.tif
Citation
Wardrup, J., M. Guevara, R. Llamas, M.D. Correll, W. Hantson, G. Shriver, B. Vasilas, and R. Vargas. 2021. Soil Organic Carbon Distributions in Tidal Wetlands of the Northeastern USA. ORNL DAAC, Oak Ridge, Tennessee, USA. https://doi.org/10.3334/ORNLDAAC/1905
Table of Contents
- Dataset Overview
- Data Characteristics
- Application and Derivation
- Quality Assessment
- Data Acquisition, Materials, and Methods
- Data Access
- References
Dataset Overview
This dataset provides estimates of soil organic carbon (SOC) in tidal wetlands for the northeastern United States. The data cover the period 1998–2018. Northeastern U.S. tidal wetlands and bordering areas were harmonized from government agencies [U.S. Department of Agriculture - Natural Resources Conservation Service (USDA-NRCS), National Cooperative Soil Survey (NCSS), USDA-NRCS - Rapid Carbon Assessment (RaCA), U.S. Environmental Protection Agency - National Wetland Condition and Assessment (EPA-NWCA)] and published studies. Point data for carbon stocks (in kg m-2) at four soil depths (0–5, 0–30, 0–100, and 0–200 cm) are included. SOC for the four depths was predicted for eight regional zones using regression models driven by environmental covariates. Two methods were used to estimate parameters for these models, a Random Forest (RF) Ranger method and a Quantile Regression Forest (QRF) model. The distribution of SOC was predicted for tidal wetland cover types mapped by Correll et al. (2019). Predictions and uncertainties are available at a 3 m resolution.
Project: North American Carbon Program
The North American Carbon Program (NACP) is a multidisciplinary research program designed to improve understanding of North America's carbon sources, sinks, and stocks. The central objective is to measure and understand the sources and sinks of Carbon Dioxide (CO2), Methane (CH4), and Carbon Monoxide (CO) in North America and adjacent oceans. The NACP is supported by a number of different federal agencies.
Related Publications
Correll, M. D., W. Hantson, T.P. Hodgman, B.B. Cline, C.S. Elphick, W.G. Shriver, E.L. Tymkiw, and B.J. Olsen. 2019. Fine-scale mapping of coastal plant communities in the northeastern USA. Wetlands 39:17–28. https://doi.org/10.1007/s13157-018-1028-3
Holmquist, J. R., L. Windham-Myers, N. Bliss, S. Crooks, J.T. Morris, J.P. Megonigal, T. Troxler, D. Weller, J. Callaway, J. Drexler, M. C. Ferner, M. E. Gonneea, K. D. Kroeger, L. Schile-Beers, I. Woo, K. Buffington, J. Breithaupt, B.M. Boyd, L.N. Brown, N. Dix, L. Hice, B.P. Horton, G.M. MacDonald, R.P. Moyer, W. Reay, T. Shaw, E. Smith, J.M. Smoak, C. Sommerfield, K. Thorne, D. Velinsky, El. Watson, K.W. Grimes, and M. Woodrey. 2018. Accuracy and precision of tidal wetland soil carbon mapping in the conterminous United States. Scientific Reports 8:9478. https://doi.org/10.1038/s41598-018-26948-7
Related Datasets
Hinson, A.L., R.A. Feagin, and M. Eriksson. 2019. Tidal Wetlands Soil Organic Carbon and Estuarine Characteristics, USA, 1972-2015. ORNL DAAC, Oak Ridge, Tennessee, USA. https://doi.org/10.3334/ORNLDAAC/1742
Holmquist, J.R., L. Windham-Myers, N. Bliss, S. Crooks, J.T. Morris, P.J. Megonigal, T. Troxler, D. Weller, J. Callaway, J. Drexler, M.C. Ferner, M.E. Gonneea, K. Kroeger, L. Schile-beers, I. Woo, K. Buffington, B.M. Boyd, J. Breithaupt, L.N. Brown, N. Dix, L. Hice, B.P. Horton, G.M. Macdonald, R.P. Moyer, W. Reay, T. Shaw, E. Smith, J.M. Smoak, C. Sommerfield, K. Thorne, D. Velinsky, E. Watson, K. Grimes, and M. Woodrey. 2019. Tidal Wetland Soil Carbon Stocks for the Conterminous United States, 2006-2010. ORNL DAAC, Oak Ridge, Tennessee, USA. https://doi.org/10.3334/ORNLDAAC/1612
Acknowledgments
This project received support from NASA’s North American Carbon Project and a National Science Foundation (NSF) CAREER Award (grant 1652594).
Data Characteristics
Spatial Coverage: Tidal wetlands of the northeastern U.S., from Virginia to Maine
Spatial Resolution: 3 m
Temporal Coverage: 1998-01-01 to 2018-01-01
Temporal Resolution: One-time estimate
Study Area: Latitude and longitude are given in decimal degrees.
| Site | Westernmost Longitude | Easternmost Longitude | Northernmost Latitude | Southernmost Latitude |
|---|---|---|---|---|
| Northeastern U.S. | -76.348 | -66.945 | 45.259 | 37.08 |
Data File Information
There are 100 data files included in this dataset: 96 in GeoTIFF (*.tif) format and four in comma-separated values (CSV; *.csv) format. The GeoTIFF files contain spatial predictions of soil organic carbon (SOC) in tidal wetlands for eight regional zones between Virginia to Maine. The CSV files hold point-level measurements of SOC and there is one file for each soil depth stratum (0–5, 0–30, 0–100, 0–200 cm). Also included is one companion file in Portable Document (*.pdf) format (Supplementary_Materials.pdf) that provides details of the geographic zones, covariates from Correll et al. (2019), sources for point data, and R code for generating the GeoTIFF files from point data.
The naming convention for the GeoTiff files is SOC_AAAcm_ZoneB_CC_D.tif, where
AAA = maximum soil depth of the measurement ("5cm", "30cm", "100cm", or "200cm"),
B = geographic zone (1–9),
CC = the method ("RF" or "QRF"), and
D = the statistic ("Mean" or "Uncertainty").
The naming convention for the CSV files is SOC_AAAcm_NE-US_2018.csv, where AAA is maximum depth of the measurement ("5cm", "30cm", "100cm", or "200cm"). The number of data points are 373, 371, 169, and 49 for the maximum depths. Variables are listed in Table 2 and data sources are in Table 3. Point locations in the CSVs are accurate to within +/-500 m.
Table 1. Naming conventions and descriptions for three types of GeoTIFF files. There are 4 depths and 8 zones, creating 32 files, for each type of GeoTIFF.
| File Type | File Naming Convention | Units | Description |
|---|---|---|---|
| Random Forest Mean | SOC_AAAcm_ZoneB_RF_Mean.tif | kg m-2 | Mean estimates of SOC generated with Random Forest (RF) Ranger method using eleven environmental covariables. |
| Quantile Regression Mean | SOC_AAAcm_ZoneB_QRF_Mean.tif | kg m-2 | Mean estimates of SOC generated with Quantile Regression Forest (QRF) method using eleven environmental covariables. |
| Quantile Regression Uncertainty | SOC_AAAcm_ZoneB_QRF_Uncertainty.tif | kg m-2 | Uncertainty in estimates of SOC generated with QRF method using eleven environmental covariables. |
Data File Details
The spatial resolution of the GeoTIFFs is 3 meters and the no_data value is -9999.
Point locations in the CSVs are accurate to within +/-500 m.
The coordinate system for all files is UTM zone 18N, datum NAD83 (EPSG:26918).
Table 2. Variables in the CSV files containing point-level data on soil organic carbon.
| Variable | Units | Description |
|---|---|---|
| ID | string | Unique label for point based on coordinate or data source |
| X | m | UTM easting, zone 18 |
| Y | m | UTM northing, zone 18 |
| OCSKGM | kg m-2 | Soil organic carbon content |
| Source | string | Abbreviation for data source as defined in Table 3 |
Application and Derivation
Tidal wetlands contain relatively high quantities of soil organic carbon. The estuarine-level analysis could provide a better understanding of the conditions that lead to enhanced or degraded carbon sequestration rates in times of rapid global change and could lead to future conservation efforts within specific estuarine boundaries.
This dataset provides information on the spatial distribution of these carbon stocks in tidal regions of the eastern US from the Delmarva Peninsula (Virginia and Maryland) to Maine.
Quality Assessment
Point-level data were evaluated to remove outliers and duplicate data. Prior to generating the prediction rasters, a mask was developed to limit the analysis to tidal areas while excluding uplands and non-tidal wetlands. Uncertainty estimates were generated with the Quantile Regression Forest method and are provided in GeoTIFF files of this dataset.
Known Issues
There are lines of missing data in the GeoTIFFs as a result of processing data in 2 km x 2 km tiles. These "no data" lines are ≤6 m wide at the boundaries of tiles.
Data Acquisition, Materials, and Methods
This project compiled data on soil organic carbon (SOC) content of tidal wetlands of the northeastern United States from publicly available sources and published articles (Table 3). These data were harmonized to create a point-level dataset with SOC stocks for four soil depth increments: 0–5 cm, 0–30 cm, 0–100 cm, and 0–200 cm. Data from the past 20 years (1998–2018) were utilized for the three upper depths. The 0–200 cm dataset included all available data without date restrictions.
The region of interest included coastal areas from the Delmarva Peninsula of Virginia and Maryland, northward to Maine. This region was divided into eight zones as used by Correll et al. (2019). These zones differ with respect to ecological structure, climate, geological parent material, and in some cases, salinity gradients.
Point data were screened to remove outliers. Outliers were calculated for organic, sandy, and fine-textured soils. Ranges in values were generated from known values in fundamental soil science literature (Brady and Wiel, 2008; Buol et al., 2003) of bulk densities for the varying soils and soil materials because bulk density determines the maximum values possible for SOC in a given soil sample.
The point-level data were combined with environmental covariates to predict the distributions of SOC (in kg m-2) in tidal wetlands across the region of interest. Covariates, from Correll et al. (2019), included terrain metrics calculated from DEMs and vegetation cover types derived from remotely sensed Difference Vegetation Index (DVI), Normalized Difference Vegetation Index (NDVI), and Normalized Difference Water Index (NDWI) metrics. Spatially explicit predictions of SOC were calculated by regression with parameters estimated using two random forest methods: Random Forest Ranger (RF) (Wright and Ziegler, 2017) and Quantile Regression Forest (QRF) (Meinshausen, 2006). Both methods used the same model structure to ensure the comparability of their results. Uncertainty was calculated using the standard deviation of QRF results.
The data were processed in 2 km x 2 km tiles, and predictions were not possible at pixels at the edge of many tiles. This limitation resulted in lines of "no data" up to 2 pixels (6 m) wide at the boundaries of tiles.
Table 3. Data sources for soil organic carbon measurements in the CSV files.
| Abbreviation | Source | Files |
|---|---|---|
| ISCN | International Soil Carbon Network Dataset: Generation 3 Database 12-2015 https://iscn.fluxdata.org | |
| WoSIS | World Soil Information Service https://www.isric.org/explore/wosis/accessing-wosis-derived-datasets |
wosis_201607_attributes.txt wosis_201607_profiles.txt wosis_201607_layers.txt |
| CCRCN | Coastal Carbon Research Coordination Network https://serc.si.edu/coastalcarbon/data, https://ccrcn.shinyapps.io/CoastalCarbonAtlas |
CCRCB_core_data.csv CCRCN_depthseries_data.csv |
| EPA-NWCA | U.S. Environmental Protection Agency-National Wetlands Condition Assessment https://www.epa.gov/national-aquatic-resource-surveys/data-national-aquatic-resource-surveys | nwca2011_siteinfo.csv nwca2011_soilchem.csv |
| RaCA | Rapid Carbon Assessment https://www.nrcs.usda.gov/wps/portal/nrcs/detail/soils/survey/?cid=nrcs142p2_054164 |
RaCA_data_summary.xlsx |
| NCSS | National Cooperative Soil Survey https://ncsslabdatamart.sc.egov.usda.gov | NCSS_Lab_Data_Mart_01512017.mbd (Geochemistry_query, Bulk_Density_and_Moisture) |
| Holmquist et al. | Holmquist et al. 2018. Accuracy and precision of tidal wetlands soil carbon mapping in the conterminous United States. Scientific Reports. https://doi.org/10.1038/s41598-018-26948-7, https://repository.si.edu/handle/10088/35684 |
Data Access
These data are available through the Oak Ridge National Laboratory (ORNL) Distributed Active Archive Center (DAAC).
Soil Organic Carbon Distributions in Tidal Wetlands of the Northeastern USA
Contact for Data Center Access Information:
- E-mail: uso@daac.ornl.gov
- Telephone: +1 (865) 241-3952
References
Brady, N.C. and R.R. Wiel. 2008. The Nature and Properties of Soils (14th ed.). Pearson Prentice Hall.
Buol, S.W., R.J. Southard, R.C. Graham, and P. A. McDaniel. 2003. Soil Genesis and Classification (5th ed.). Iowa State Press; Ames, Iowa.
Correll, M.D., W. Hantson, T.P. Hodgman, B.B. Cline, C.S. Elphick, W.G. Shriver, E.L. Tymkiw, and B.J. Olsen. 2019. Fine-scale mapping of coastal plant communities in the northeastern USA. Wetlands 39:17–28. https://doi.org/10.1007/s13157-018-1028-3
Holmquist, J.R., L. Windham-Myers, N. Bliss, S. Crooks, J.T. Morris, J.P. Megonigal, T. Troxler, D. Weller, J. Callaway, J. Drexler, M. C. Ferner, M. E. Gonneea, K. D. Kroeger, L. Schile-Beers, I. Woo, K. Buffington, J. Breithaupt, B.M. Boyd, L.N. Brown, N. Dix, L. Hice, B.P. Horton, G.M. MacDonald, R.P. Moyer, W. Reay, T. Shaw, E. Smith, J.M. Smoak, C. Sommerfield, K. Thorne, D. Velinsky, El. Watson, K.W. Grimes and M. Woodrey. 2018. Accuracy and precision of tidal wetland soil carbon mapping in the conterminous United States. Scientific Reports 8:9478. https://doi.org/10.1038/s41598-018-26948-7
Meinshausen, N. 2006. Quantile regression forests. J. Machine Learning Research 7:983-999. https://www.jmlr.org/papers/v7/meinshausen06a.html
Wright, M. N. and A. Ziegler, A. 2017. Ranger: A fast implementation of random forests for high dimensional data in C++ and R. J. Statistical Software 77:1-17. https://doi.org/10.18637/jss.v077.i01