Get Data
Revision date: June 11, 2013
Summary:
The NBCD 2000 (National Biomass and Carbon data set for the Year 2000) data set provides a high-resolution (30 m) map of year-2000 baseline estimates of basal area-weighted canopy height, above-ground, live, dry biomass, and standing carbon stock for the conterminous United States. This data set distributes, for each of 66 map zones, a set of six raster files in GeoTIFF format. There is a detailed README companion file for each map zone. There is also an ArcGIS shapefile (mapping_zone_shapefile.shp) with the boundaries of all the map zones. A mosaic image of biomass at 240-m resolution for the whole conterminous U.S. is also included.
Development of the data set used an empirical modeling approach that combined USDA Forest Service Forest Inventory and Analysis (FIA) data with high-resolution InSAR data acquired from the 2000 Shuttle Radar Topography Mission (SRTM) and optical remote sensing data acquired from the Landsat ETM+ sensor. Three-season Landsat ETM+ data were systematically compiled by the Multi-Resolution Land Characteristics Consortium (MRLC) between 1999 and 2002 for the entire U.S. and were the foundation for development of both the USGS National Land Cover data set 2001 (NLCD 2001) and the Landscape Fire and Resource Management Planning Tools Project (LANDFIRE). Products from both the NLCD 2001 (landcover and canopy density) and LANDFIRE (existing vegetation type) projects as well as topographic information from the USGS National Elevation data set (NED) were used within the NBCD 2000 project as spatial predictor layers for canopy height and biomass estimation. Forest survey data provided by the USDA Forest Service FIA program were made available to the project under a national Memorandum of Understanding. The response variables (canopy height and biomass) used in model development and validation were derived from the FIA database (FIADB). Production of the NLCD 2001 and LANDFIRE projects was based on a mapping zone approach in which the conterminous U.S. was split into 66 ecoregionally distinct mapping zones. This mapping zone approach was also adopted by the NBCD 2000 project.
Development of the NBCD 2000 data set used an empirical modeling approach that combined USDA Forest Service Forest Inventory and Analysis (FIA) data with high-resolution InSAR data acquired from the 2000 Shuttle Radar Topography Mission (SRTM) and optical remote sensing data acquired from the Landsat ETM+ sensor. Three-season Landsat ETM+ data were systematically compiled by the Multi-Resolution Land Characteristics Consortium (MRLC) between 1999 and 2002 for the entire U.S. and were the foundation for development of both the USGS National Land Cover Dataset 2001 (NLCD 2001) and the Landscape Fire and Resource Management Planning Tools Project (LANDFIRE). Products from both the NLCD 2001 (landcover and canopy density) and LANDFIRE (existing vegetation type) projects as well as topographic information from the USGS National Elevation Dataset (NED) were used within the NBCD 2000 project as spatial predictor layers for canopy height and biomass estimation. Forest survey data provided by the USDA Forest Service FIA program were made available to the project under a national Memorandum of Understanding. The response variables (canopy height and biomass) used in model development and validation were derived from the FIA database (FIADB). Production of the NLCD 2001 and LANDFIRE projects was based on a mapping zone approach in which the conterminous U.S. was split into 66 ecoregionally distinct mapping zones. This mapping zone approach was also adopted by the NBCD 2000 project.
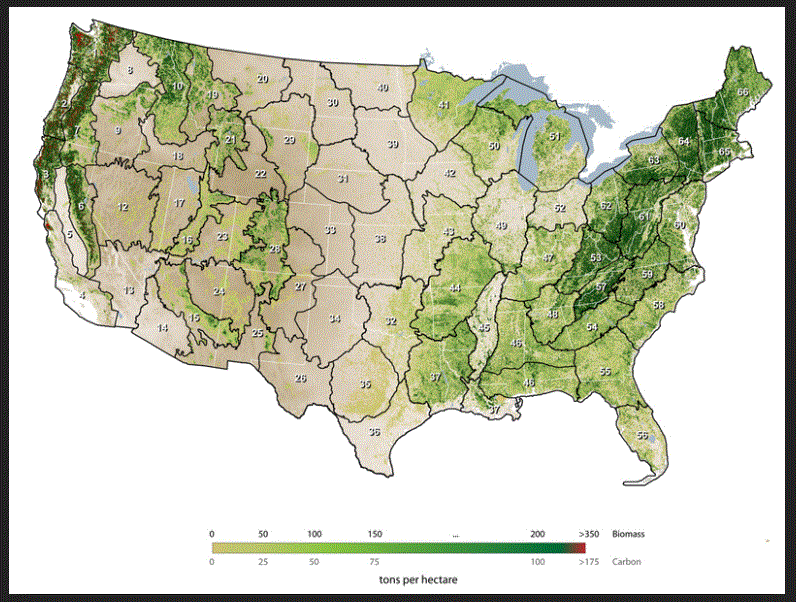
Figure 1. A mosaic image of biomass at 240-m resolution for the whole conterminous United States.
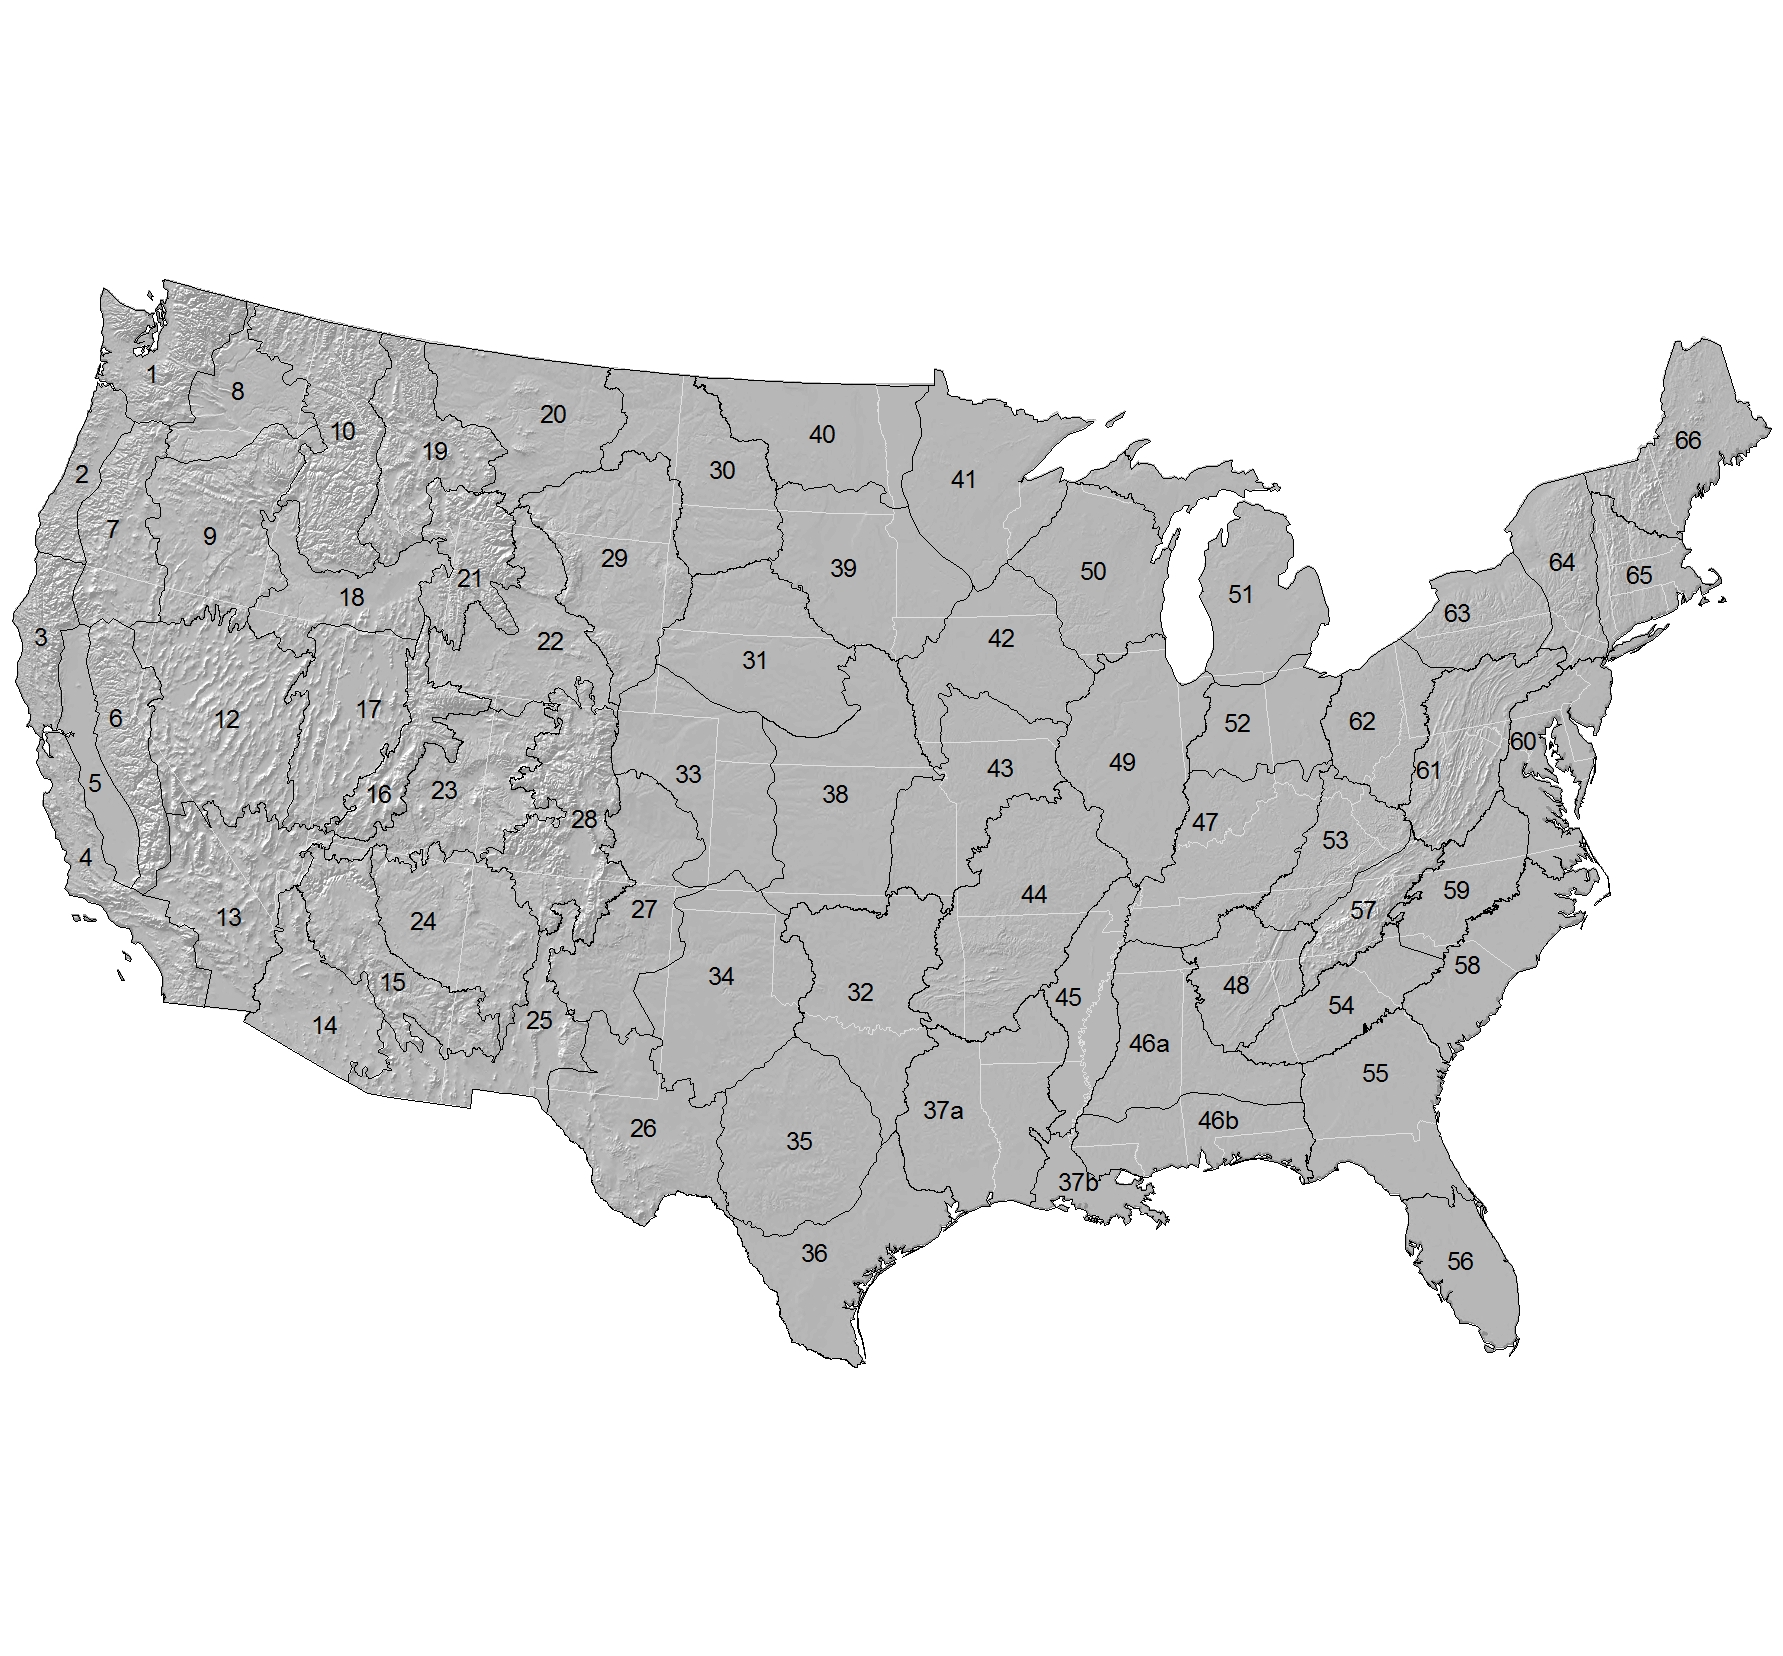
Figure 2. Mapping zone approach in which the conterminous U.S. is divided into 66 ecoregionally distinct mapping zones: Zones 1 – 10, 12 – 36, 37a and 37b, and 38-66 for a total of 66 zones. This mapping zone approach was adopted by the NBCD 2000 project.
Acknowledgements
The accompanying data set was produced as part of a project funded under NASA's Terrestrial Ecology Program and titled "The National Biomass and Carbon data set 2000 (NBCD 2000): A High Spatial Resolution Baseline to Reduce Uncertainty in Carbon Accounting and Flux Modeling".
The NBCD 2000 project is funded by NASA's Earth Science Division/Terrestrial Ecology Program under grant number NNG05G127G. Additional support for generation of the canopy NBCD2000 Mapping Zone height layer was provided by the USGS under the Landscape Fire and Resource Management Planning Tools Project (LANDFIRE). PCI Geomatics and ESRI supported the project through donation of software licenses. Definiens Imaging co-sponsored licenses of eCognition/Definiens Professional/Definiens Developer. Acknowledged collaborators on the project are Collin Homer (USGS/EDC National Land Cover Database 2001), Dean Gesch (USGS/EDC National Elevation Dataset), Zhiliang Zhu (USGS/EDC LANDFIRE Team), and their respective staffs.
ORNL DAAC Version Record
| NBCD 2000 Version | ORNL DAAC Release Date | Data Files Version Notes | Date Superseded |
|---|---|---|---|
| Version 2.0 | 2013/05/15 | All 66 mapping zones were updated with the previously unaccounted for land cover types now included
in modeled estimates. Updated files are: • NBCD_MZxx_BAW_height.tgz • NBCD_MZxx_FIA_ALD_biomass.tgz • NBCD_MZxx_NCE_ALD_biomass.tgz Where “xx” is the respective map zone. The no data value was changed to -32768 for all 66 mapping zones. The authors recommend use of the new version for all analyses and will only support the updated version. The NBCD2000 Version 2 data set was released on October 26, 2012 by The Woods Hole Research Center. | 2013/05/24 |
Figure 1. A mosaic image of biomass at 240-m resolution for the whole conterminous United States.
Figure 2. Mapping zone approach in which the conterminous U.S. is divided into 66 ecoregionally distinct mapping zones: Zones 1 – 10, 12 – 36, 37a and 37b, and 38-66 for a total of 66 zones. This mapping zone approach was adopted by the NBCD 2000 project.
Acknowledgements
The accompanying data set was produced as part of a project funded under NASA's Terrestrial Ecology Program and titled "The National Biomass and Carbon data set 2000 (NBCD 2000): A High Spatial Resolution Baseline to Reduce Uncertainty in Carbon Accounting and Flux Modeling".
The NBCD 2000 project is funded by NASA's Earth Science Division/Terrestrial Ecology Program under grant number NNG05G127G. Additional support for generation of the canopy height layer was provided by the USGS under the Landscape Fire and Resource Management Planning Tools Project (LANDFIRE). PCI Geomatics supported the project through donation of Geomatica software licenses. Definiens imaging co-sponsored licenses of eCognition/Definiens Professional/Definiens Developer. Acknowledged collaborators on the project are Elizabeth LaPoint (USDA/Forest Service Forest Inventory and Analysis Program), Collin Homer (USGS/EDC National Land Cover Database 2001), Dean Gesch (USGS/EDC National Elevation data set), Zhiliang Zhu (USGS/EDC LANDFIRE Team), and their respective staffs.
Data and Documentation Access:
Get Data: NACP Aboveground Biomass and Carbon Baseline Data (NBCD 2000), U.S.A., 2000
Description and Links to Companion Files and Supplemental Information:
Woods Hole Research Center: National Biomass and Carbon data set for the year 2000 (NBCD2000)
ORNL DAAC Spatial Data Access
Tool (SDAT) link:
http://webmap.ornl.gov/wcsdown/index.jsp
Data Citation:
Cite this data set as follows:
Kellndorfer, J., Walker, W., Kirsch, K., Fiske, G., Bishop, J.,
LaPoint, L., Hoppus, M., and Westfall, J. 2012. NACP Aboveground
Biomass and Carbon Baseline Data (NBCD 2000), U.S.A., 2000. 2012. ORNL DAAC.
Oak Ridge, Tennessee, USA.
http://dx.doi.org/10.3334/ORNLDAAC/1081
Table of Contents:
- 1 Data Set Overview
- 2 Data Characteristics
- 3 Applications and Derivation
- 4 Quality Assessment
- 5 Acquisition Materials and Methods
- 6 Data Access
- 7 References
1. Data Set Overview:
Project: NACP
The NBCD 2000 (National Biomass and Carbon data set for the Year 2000) data set provides a high-resolution (30 m) map of year- 2000 baseline estimates of basal area-weighted canopy height, above-ground, live, dry biomass, and standing carbon stock for the conterminous United States.
2. Data Characteristics:
This data set provides: (1) a high-resolution (30 m) map of year-2000 baseline estimates of basal area-weighted canopy height, aboveground live dry biomass, and standing carbon stock for each of the 66 map zones defined for the conterminous United States; (2) a mosaic image of aboveground live dry biomass at 240-m resolution for the whole conterminous United States; and (3) boundaries of all the map zones; and (4) ArcGIS-compatible color layer files.
1) Estimates of basal area-weighted canopy height, above-ground live, dry biomass, and standing carbon stock for ecoregionally distinct mapping zones at 30 m resolution.
This data set distributes, for each of the 66 map zones (Note 37a and 37b zone split. See Figure 2.), a set of six raster files in GeoTIFF format (together with associated metadata XMLs) and a companion README document that provides specific map zone file and accuracy assessments.
File naming convention for GeoTIFF format files:
NBCD_MZxx_content_type.tif
Where xx is the map zone and content_type is one of the 6 types shown below.
(1) NBCD_MZxx_BAW_height.tif
(2) NBCD_MZxx_FIA_ALD_biomass.tif
(3) NBCD_MZxx_NCE_ALD_biomass.tif
(4) NBCD_MZxx_SRTM_datatakes.tif
(5) NBCD_MZxx_averaging_index.tif
(6) NBCD_MZxx_NED_META_SRTM_voids.tif
GeoTIFF file descriptions:
NBCD_MZxx_BAW_height
One 16-bit signed raster layer at 30 m resolution. Digital numbers represent the average basal area weighted height in meters * 10.
Thus, the average basal area weighted height in meters =
NBCD_MZxx_FIA_ALD_biomass
One 16-bit signed raster layer at 30 m resolution. Digital numbers represent the amount of
above-ground, live, dry biomass present in kg/m2 * 10. Thus, above-ground, live,
dry biomass in kg/m2 =
NBCD_MZxx_NCE_ALD_biomass
One 16-bit signed raster layer at 30 m resolution. Digital numbers represent the amount of above-ground, live, dry biomass present in kg/m2 * 10. Thus, above-ground, live, dry biomass in kg/m2 = / 10. Values were multiplied by 10 to preserve significant figures yet reduce file size. Units of kg/m2 were selected to coincide with FIA results/methodology. It may be preferable to convert the current units to metric tons (tonnes) per hectare. To estimate the number of metric tonnes of biomass in a given region of interest/polygon, sum the values that lie within the polygon of interest and then multiply the result by 0.09 (which accounts for the fractional portion of a hectare present in a single 30 meter pixel). Biomass estimates were derived from nationally consistent allometric equations (NCE) developed by Jenkins et al. (2003) and were applied to the FIADB on a tree-by-tree basis. Data User Note: The data providers suggest that users calculate carbon estimates with the *_FIA_ALD_biomass data rather than this beta version product.
NBCD_MZ01_SRTM_datatakes
One 8-bit unsigned raster layer at 30 m resolution. Digital numbers represent the number of SRTM C-band datatakes associated with each 30 m pixel.
NBCD_MZ01_averaging_index
One 16-bit unsigned raster layer at 30 m resolution. Digital numbers represent an index computed by multiplying the number of SRTM datatakes (see datatake layer) by the size (measured in pixels) of the particular image-object polygon to which the pixel belongs. The averaging index provides a measure of confidence in the estimates of canopy height and biomass as it relates directly to the amount of noise reduction achieved in each image pixel. Hence, the larger the index value, the greater the noise reduction, and the higher the confidence in the canopy height/biomass prediction. For further information see Walker et al. (2007a).
NBCD_MZ01_NED_META_SRTM_voids
One 8-bit unsigned raster layer at 30 m resolution. Digital numbers identify the locations of (1) low NED quality (i.e., electronic image correlation and manual profiling production methods – see http://ned.usgs.gov/Ned/downloads.asp for more information) and presence of SRTM voids (2) high NED quality and presence of SRTM voids, (3) low NED quality and absence of SRTM voids, (4) high NED quality and absence of SRTM voids, (5) lidar-based DEM and presence of SRTM voids, and (6) lidar-based DEM and absence of SRTM voids.
File naming convention for companion README files:
NBCD_MZxx_README.pdf
Where xx is the map zone.
The README file contains descriptions of the project and the data description, summarizes standard and zone-specific processing methods as well as zone results, and provides a list of relevant publications and contact information where additional details can be obtained.
2) Biomass mosaic of the conterminous U.S. at 240-m resolution.
This 240-m mosaic is a straight aggregation (sum) of the 30 m map zone FIA ALD biomass estimates (i.e. 64 pixels per mosaic cell). The values are total above-ground, live, dry biomass in metric tonnes per cell. To convert these values back to tonnes/ha, divide the cell values by 5.76 (i.e. the number of ha in a 240 x 240-m pixel). The projection is Albers equal-area, the same as the 30 m map zone data.
The GeoTIFF format file, BCD_countrywide_biomass_mosaic.tif, is contained in the compressed file, NBCD_countrywide_biomass_240m_raster.zip.
3) Shapefile with the boundaries of all map zones.
There is also an ESRI ArcGIS shapefile with the boundaries of all the map zones: Zones 1 – 10, 12 – 36, 37a and 37b, and 38-66 for a total of 66 zones. The files are provided in the compressed file, mapping_zone_shapefile.zip. When unzipped, the mapping_zone_shapefile contains seven files (.dbf, .prj, .sbn, .sbx, .shp, xml, .shx).
4) ArcGIS-compatible color layer files.
Included are two ArcGIS-compatible color layer files for use with the 30 m resolution raster data.
NBCD_biomass_color_scheme.lyr
NBCD_height_color_scheme.lyr
GeoTIFF file viewing guidance:
To view the data in most GIS and image processing software packages, statistics need to be calculated for each raster file. For example,
using ESRI's ArcCatalog, right click the GeoTIFF raster image and choose 'build statistics'.
Site boundaries (all latitude and longitude given in decimal degrees)
| Site (Region) | Westernmost Longitude | Easternmost Longitude | Northernmost Latitude | Southernmost Latitude | Geodetic Datum |
|---|---|---|---|---|---|
| Conterminous United States | -126.46 | -67.96 | 49.79 | 26.52 | World Geodetic System, 1984 (WGS-84) |
Time period:
- The data set covers the period 1999/01/01 to 2002/12/31
3. Data Application and Derivation:
The production of the NBCD canopy height and above-ground, live, dry biomass layers comes at a time when understanding and quantifying the carbon balance for North America is more important than ever. This spatially explicit, high resolution (30 m) data set of vegetation height, biomass, and carbon stock is the first of its kind and provides a baseline from which to detect future changes.
4. Quality Assessment:
In each mapping zone README file, an accuracy assessment for that zone is provided along with a summary of any mapping zone-specific deviations from standard processing steps.
For example, the following figures, from NBCD_MZ01_README.pdf, include (1) variable importance (VI) plots (2a, 2b, 2c) and (2) validation (one-to-one) plots (2d, 2e, 2f) for basal area- weighted height and above-ground, live, dry biomass (FIA and NCE). VI plots provide a graphic view of the relative importance of a spatial predictor layer used in each regression-tree model. For further information on VI plots see Liaw and Wierner (2002) or Walker et al. (2007a). Validation plots are based on a bootstrap approach described in Kellndorfer et al. (Submitted).
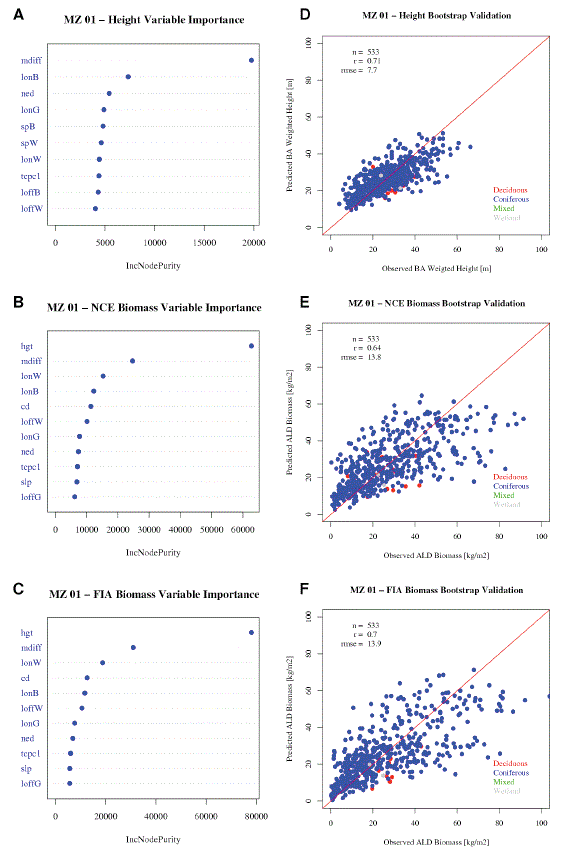
Figure 3. Mapping zone results provide a graphic view of the relative importance of a spatial predictor layer used in each regression-tree model.
5. Data Acquisition Materials and Methods:
Summary of Standard Processing Methods
A diagram of the general process flow for
the NBCD 2000 project is included in Figure 4. Detailed information on
the methods employed at each step in the process can be found in Walker
et al. (2007a/b) and Kellndorfer et al. (Submitted).
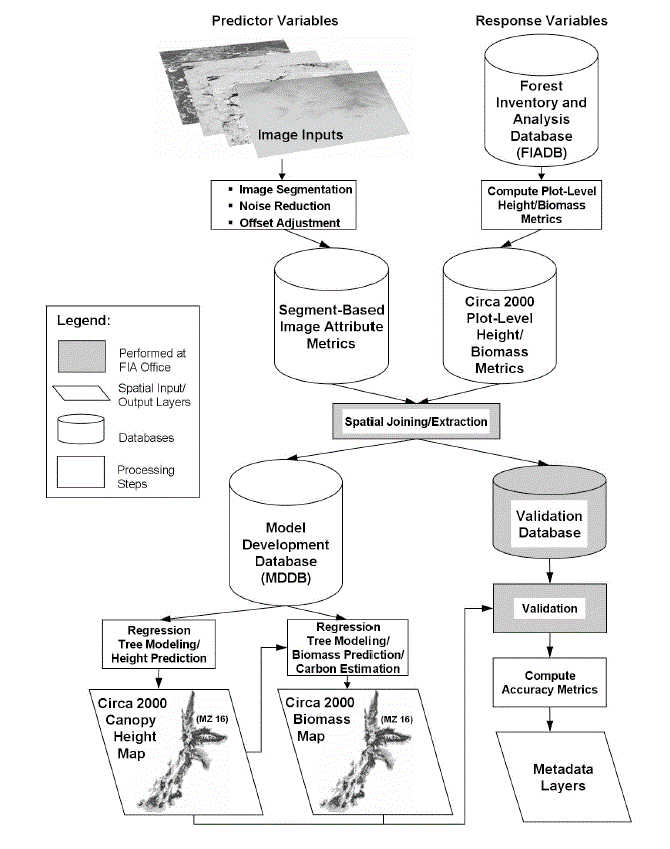
Figure 4. General process flow for the NBCD 2000 project.
6. Data Access:
This data is available through the Oak Ridge National Laboratory (ORNL) Distributed Active Archive Center (DAAC).
Data Archive Center:
Contact for Data Center Access Information:
E-mail: uso@daac.ornl.gov
Telephone: +1 (865) 241-3952
7. References:
Kellndorfer, J.M., Walker, W.S., Kirsch, K.M., Fiske,
G., Bishop, J., LaPoint, E., Hoppus, M, & Westfall, J. The
National
Biomass and Carbon data set 2000 (NBCD 2000): A high resolution baseline
for the conterminous U.S. Remote Sensing of
Environment, Submitted.
Kellndorfer,
J., Walker, W., Pierce, L., Dobson, C., Fites, J., Hunsaker, C., Vona,
J., & Clutter, M. 2004. Vegetation height estimation from
Shuttle
Radar Topography Mission and National Elevation data sets. Remote
Sensing of Environment, 93:339-358.
Liaw, A. & Wierner, M. 2002. Classification and regression by
randomForest. R News, 2/3, 18-22.
Jenkins, J.C., Chojnacky, D.C., Heath, L.S., & Birdsey, R.A. 2003. National-scale biomass estimators for United States tree species. Forest Science, 49:12-35.
Pierce, L.E., Kellndorfer, J.M., Walker, W.S., & Barros, O. 2006. Evaluation of the horizontal resolution of SRTM elevation data. Photogrammetric Engineering and Remote Sensing, 72(11), 1235-1244.
Walker, W.S. 2006. Toward Regional- to Continental-Scale Estimates of Vegetation Canopy Height: An Empirical Approach Based on Data from the Shuttle Radar Topography Mission. Ph.D. Dissertation. The University of Michigan, School of Natural Resources and Environment, Ann Arbor, MI. 263 pp.
Walker, W.S., Kellndorfer, J.M., LaPoint, E., Hoppus, M., & Westfall, J. 2007a. An empirical InSAR optical fusion approach to mapping vegetation height. Remote Sensing of Environment, 109:482-499.
Walker, W.S., Kellndorfer, J.M. &Pierce, L.E. 2007b. Quality Assessment of SRTM C-and XBand Interferometric Data: Implications for the Retrieval of Vegetation Canopy Height.Remote Sensing of Environment, 106:428-448.