Documentation Revision Date: 2016-03-03
Data Set Version: R1
Summary
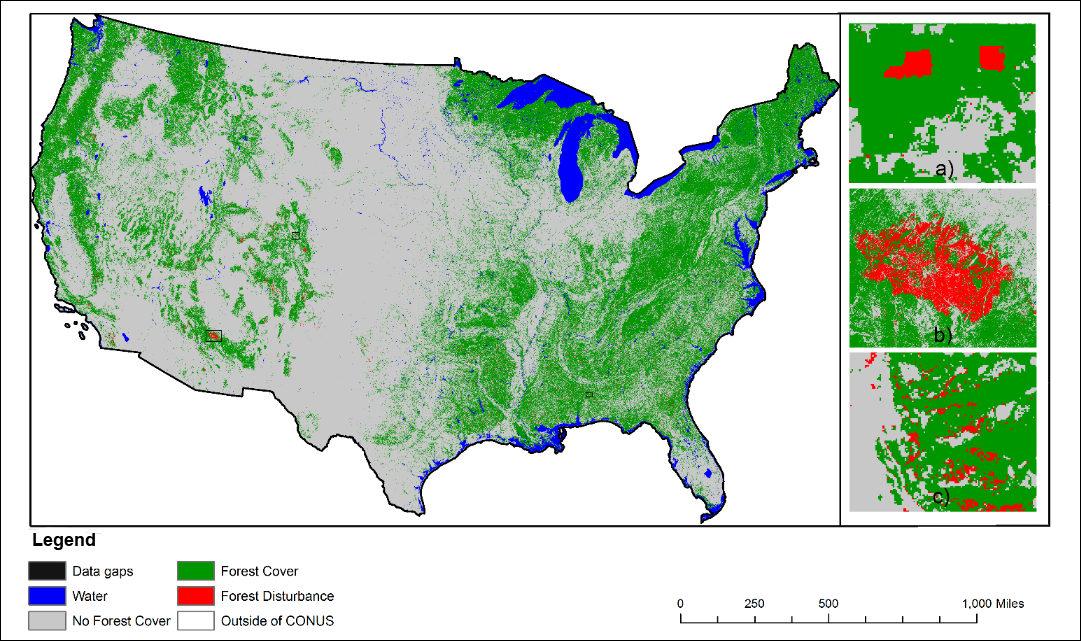
Maps have a nominal spatial resolution of 30 m, with forest disturbances mapped at an annual time step (Fig. 1). These products are referred to as the NAFD-NEX data set to acknowledge the collaboration with the supercomputing facilities at the NASA Ames Research Center provided by the NASA Earth Exchange (NEX: Nemani et al. 2011) to process the large volume of Landsat imagery used in this study.
Products are provided in the Albers Conic Equal Area projection and are distributed as 27 GeoTIFF images.
Support Acknowledgement
The NAFD (North American Forest Dynamics) study, a core project of the North American Carbon Program (NACP), was supported by grants from NASA’s Terrestrial Ecology, Carbon Cycle Sciences, and Applied Sciences Programs. The UMD group was supported under NASA Grant NNX11AJ78G S01. Associated NAFD-NEX activities have been carried out by Warren Cohen, USFS Pacific Northwest Research Station (Product Validation), Jeffrey Masek, NASA Goddard Space Flight Center (Regrowth Dynamics), Gretchen Moisen, USFS Rocky Mountain Research Station (Causal Factors Attribution) and Ramakrishna Nemani, NASA Ames Research Center (NEX computing).
Rest of figure caption: Insets reveal the high spatial resolution of detected disturbances: a)Forest harvesting in Butler County, Alabama; b)Massive Rodeo-Chediski fire in Navajo County, Arizona; and c)Mountain pine beetle damage in Grand County, Colorado.
Citation
Goward, S.N., C. Huang, F. Zhao, K. Schleeweis, K. Rishmawi, M. Lindsey, J.L. Dungan, and A. Michaelis. 2016. NACP NAFD Project: Forest Disturbance History from Landsat, 1986-2010. ORNL DAAC, Oak Ridge, Tennessee, USA. http://dx.doi.org/10.3334/ORNLDAAC/1290
Table of Contents
- Data Set Overview
- Data Characteristics
- Application and Derivation
- Quality Assessment
- Data Acquisition, Materials, and Methods
- Data Access
- References
Data Set Overview
Project: North American Forest Dynamics (NAFD)
Investigators: Goward S.N., C. Huang, F. Zhao, K. Schleeweis, K. Rishmawi, M. Lindsey, J.L Dungan, and A. Michaelis
NAFD-NEX provides two sets of map products. The first map set is a collection of 25 annual disturbance maps (1986-2010) showing water, no forest cover, forest cover, no data available (data gaps) in present year, and disturbances that occurred in that year (Fig.1). Data gaps occur when no scenes are available for a given path-row and year that meet the standards for inclusion in the NAFD data set (Schleeweis et al., in prep). Gaps are caused by, for example, the satellite not operating, excessive cloud cover and orthorectification failure.
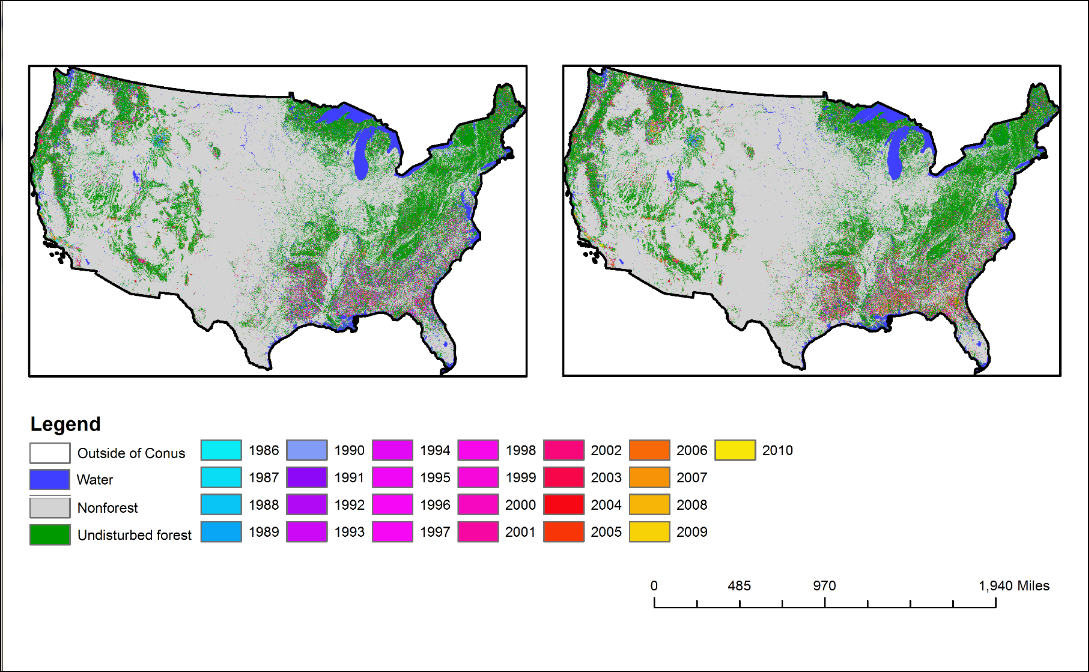
Some portions of US forests experienced at least two disturbances between 1986 and 2010. To resolve this information in the NAFD-NEX forest disturbance product, two time-integrated maps are provided, with one map noting the first disturbance and the second map noting the last disturbance (Fig. 2). No data gaps are present in the time-integrated maps -- the data gaps seen in the individual year maps are filled with information from other years that have valid Landsat observations.
North American Forest Dynamics (NAFD), a core project of the North American Carbon Program (NACP), was designed to improve understanding of the carbon budget for North America (Goward et al., 2008). The primary goal of this project was to evaluate forest disturbance and regrowth history between 1996 and 2010 (25 years) for the conterminous U.S. using time-series of Landsat observations.
Related Data Sets
NACP North American Forest Dynamics Project: Forest Disturbance and Regrowth Data (Previous sample-based study for the US updated with the wall-to-wall, annual NAFD-NEX study)
Data Characteristics
The NAFD-NEX products provided in this data set consist of 25 annual and two time-integrated forest disturbance maps for the conterminous United States (CONUS) for the period 1986-2010. Each annual map has classified pixels showing water, no forest cover, forest cover, no data available (data gaps) in present year and disturbances that occurred in that year. The time-integrated maps are similarly classified, but over the entire 1986-2010 period with the first and last forest disturbance years identified and provided as separate maps.
Spatial Coverage
This data set includes the conterminous United States covered by 434 WRS2 path-row tiles.
Note: Three additional WRS2 tiles (i.e., p023r027, p016r029 and p016r043) are required to provide a complete coverage of the CONUS, but each of those tiles has less than 5% land areas within the CONUS. Those tiles are not included in the NAFD-NEX study. Given the large overlaps between those WRS2 tiles and the ones used in this study, less than 0.14% of the CONUS is missing in this data set.
Spatial Resolution
The NAFD-NEX forest disturbance maps are produced using images with a nominal spatial resolution of 30 meters.
Temporal Coverage
Although the NAFD-NEX study was designed to use Landsat images acquired between 1984 and 2011, only disturbance maps between 1986 and 2010 are provided. The 1984 and 1985 results had many data gaps because of operational problems with Landsat 4 and 5 in these years. The 2011 map is removed because the vegetation change tracker (VCT) algorithm is more likely to classify unidentified clouds in the last year of the time series as false disturbances.
Temporal Resolution
Annual
Data File Naming
The annual forest disturbance map GeoTIFF files are named as follows: VCT_Annual_30m_YYYY.tif
Where:
- VCT_ refers to the Vegetation Change Tracker, an automated forest change analysis algorithm (Huang et al. 2010) used to process the Landsat images.
- Annual_30m_ denotes annual disturbance maps at 30 m resolution.
- YYYY is the year Landsat images were analyzed for disturbances, beginning in 1986 through 2010. Twenty-five total files.
For example, VCT_Annual_30m_1986.tif
The two time-integrated forest disturbance GeoTIFF maps are named VCT_30m_first.tif and VCT_30m_last.tif.
Where:
- VCT_ refers to the Vegetation Change Tracker, an automated forest change analysis algorithm (Huang et al. 2010) used to process the Landsat images.
- 30m_ denotes the map has 30 m resolution.
- “first” and “last” indicate that one map shows the year when a first disturbance was detected for a pixel and the second map noting the last disturbance.
GeoTIFF Spatial Data Properties
Spatial Representation Type: Raster
Pixel Depth: 8 bit
Pixel Type: byte
Compression Type: LZW
Number of Bands: 1
Raster Format: TIFF
Source Type: discrete
No Data Value: 255
Data Format and Projection
All NAFD-NEX forest disturbance maps are distributed in GeoTIFF format with the following projection:
Projection: Albers Conic Equal Area
Center of Upper Left Pixel: (-2364615.0, 3180555.0)
Center of Lower Right Pixel: (2266815.0, 251205.0)
Rows: 97646
Columns: 154,382
Datum: North American Datum 1983
Spheroid name: GRS 1980
Latitude of 1st parallel: 29:30:00 N
Latitude of 2nd parallel: 45:30:00 N
Longitude of central meridian: 96:00:00 W
Latitude of origin of projection: 23:00:00 N
False easting at central meridian: 0 Meters
False northing at origin: 0 meters
These projection parameters are provided within each GeoTiff file.
Map Pixel Classifications
Table 1. Class definitions for annual disturbance maps
|
Value |
Name |
Definitions |
|
0 |
Data gaps |
No acceptable data available. |
|
1 |
Water |
Area covered by water during the entire observing period |
|
2 |
No forest cover |
Area not covered by trees in the current year but may or may not have tree cover in other years during the observing period |
|
3 |
Forest cover |
Area covered by trees in the current year but may or may not have tree cover in other years during the observing period |
|
4 |
Forest disturbance |
Indicating the occurrence of a disturbance event over a forest area in the current year |
|
254 |
Outside of study area |
Area outside the study area |
Table 2. Class definitions for time-integrated disturbance maps
|
Value |
Name |
Definitions |
|
|
Stable classes |
|
|
1 |
Water |
Area covered by water during the entire observing period |
|
2 |
Nonforest |
Area never covered by trees during the entire observing period |
|
3 |
“Undisturbed” forest |
Forested area that had no disturbance detected during the entire observing period. This includes areas that 1) had tree cover throughout the entire observing period, 2) were disturbed before the beginning of the time series, but returned to forest cover and were not disturbed again, and 3) were nonforest at the beginning of the observing period but had tree cover in later years (e.g., woody encroachment, agricultural abandonment, urban tree growth). |
|
254 |
Outside of study area |
Area outside the study area |
|
|
Disturbance classes |
|
|
15-40 |
Disturbance year |
Area disturbed in a particular year. Disturbance year = 1970 + class value. The mapped disturbance event typically occurred between the acquisition dates of two Landsat images – one acquired in the disturbance year and the other in the immediately previous year – that were used in the VCT analysis. |
Application and Derivation
The objective in producing this data set was to provide annual time series forest disturbance maps of the conterminous United States (Fig. 2). This activity was undertaken because the errors encountered in the previous sampled results were larger than desirable to evaluate the role of U.S. forest disturbance in the North American carbon cycle. These maps can be used to calculate annual disturbance rates as well as forest cover in each year. This information is being used to evaluate the role of forest disturbance in the North American carbon cycle.
The time-integrated maps reveal the multi–temporal dynamics of CONUS forest disturbance. Together they provide an overview of the spatio-temporal patterns of disturbances that have occurred during the 1986-2010 time period. Approximately 20% of all locations have experienced more than one disturbance during this time period. When viewed from 2011 or a later year, this map shows the spatial pattern of age since disturbance, which is highly correlated with forest age for areas where regrowth occurred soon after stand-clearing disturbances.

Figure 2. Time-integrated forest disturbance maps for 1986-2010 time period with the first and last forest disturbance years identified. Left: First integrated forest disturbance map. Right: Last integrated forest disturbance map.
Note regarding resolution:
The NAFD-NEX forest disturbance maps are produced using images with a nominal spatial resolution of 30 meters. A Minimum Mapping Unit (MMU) process was applied to the annual forest disturbance mapping results. A MMU size of four 30-m pixels was applied to disturbed pixels while stable classes with a size of less than two 30-m pixels were removed. Therefore, although the NAFD-NEX products are provided at the 30-m resolution, we recommend coarser scales of analysis (~60m-100m), which can be achieved through spatial aggregation of the 30-m forest disturbance product.
Quality Assessment
The NAFD-NEX forest disturbance maps have been validated using a visual assessment of Landsat time series images and high resolution image observations.
Reference data derived for samples selected from across the CONUS using the TimeSync tool (Cohen et al. 2010) are being used to further evaluate the NAFD-NEX forest disturbance products. Results will be reported as the assessment is completed.
Data Acquisition, Materials, and Methods
These data products are referred to as the NAFD-NEX data set because the volume of Landsat imagery used in this study required the use of the supercomputing facilities at the NASA Ames Research Center provided by the NASA Earth Exchange (NEX, Nemani et al., 2011). The study Included detailed validation of the forest disturbance history as well as consideration of forest regrowth history and attribution of disturbance causal factors.
Image Selection and Processing
An automated NAFD Image Selection and Processing stream (NISPS) was designed and used to select the Landsat images to produce the NAFD-NEX disturbance products (Schleeweis et al., in prep). All images used were processed to Level -1 Terrain corrected (L1T) by the USGS Earth Resources Observation and Science (EROS) Center, Sioux Falls, SD and ingested into the NASA Earth Exchange (NEX) computing environment at NASA Ames Research Center. In NEX, over 60,000 images were converted to surface reflectance using the atmospheric correction algorithm implemented in LEDAPS v2.0 (Masek et al., 2006, Vermote et al., 1997). The LEDAPS AROP package version 2.5, available through the LEDAPS website (http://ledaps.nascom.nasa.gov), was used to verify that the tie points between an image and its equivalent in the orthorectified GLS 2000 reference image met minimum project requirements (Gao et al., 2009).
The VCT Algorithm
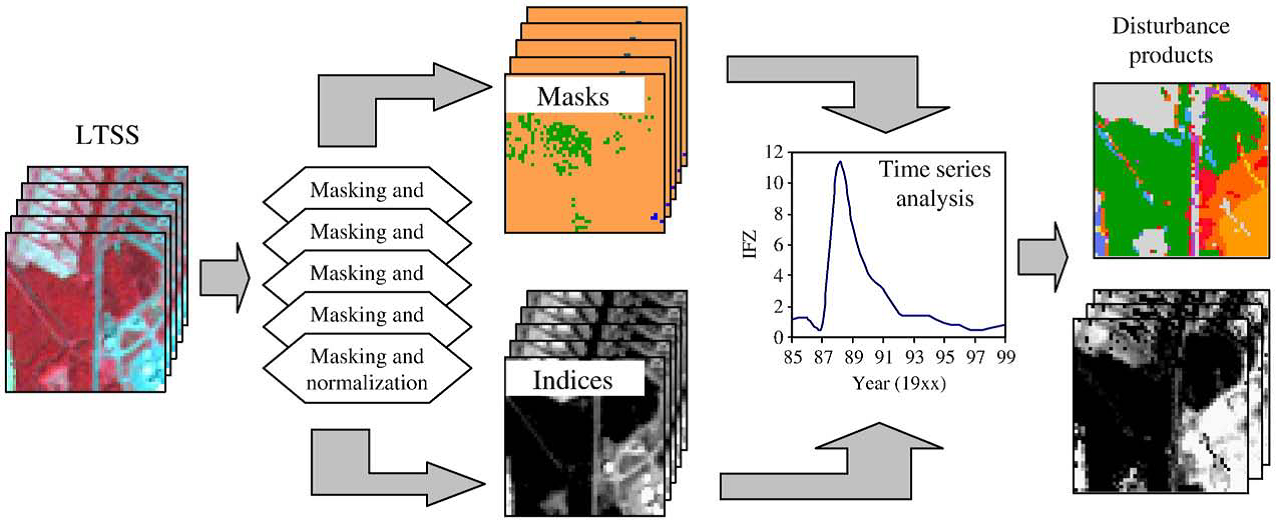
The Vegetation Change Tracker (VCT) is an automated forest change analysis algorithm (Huang et al. 2010). The VCT runs on annual Landsat Time Series Stacks (LTSSs) of images and produces NAFD-NEX forest disturbance map products (Fig. 3). This algorithm is based on the spectral–temporal properties of forest, disturbance, and post-disturbance recovery processes. It first analyzes each individual image to create masks and spectral indices that measure forest likelihood. It then simultaneously analyzes all images within an LTSS to detect disturbances and uses the spectral trajectory following each disturbance to track post-disturbance processes.

Figure 3. The VCT algorithm uses the spectral-temporal properties of Landsat Time Series Stacks to produce NAFD-NEX products (from Huang et al., 2010). IFZ is the integrated forest z-score.
Data Access
This data is available through the Oak Ridge National Laboratory (ORNL) Distributed Active Archive Center (DAAC).
NACP NAFD Project: Forest Disturbance History from Landsat, 1986-2010
Contact for Data Center Access Information:
- E-mail: uso@daac.ornl.gov
- Telephone: +1 (865) 241-3952
References
Cohen, W. B., Z. G. Yang & R. E. Kennedy (2010) Detecting trends in forest disturbance and recovery using yearly Landsat time series:2: TimeSync - tools for calibration and validation. Remote Sensing of Environment, 114, 2911-2924.
Gao, F., J. Masek & R. E. Wolfe (2009) Automated registration and orthorectification package for Landsat and Landsat-like data processing. Journal of Applied Remote Sensing, 3, 033515-033515-20.
Goward, S. N., C. Huang, J. G. Masek, W. B. Cohen, G. G. Moisen & K. Schleeweis. 2012. NACP North American Forest Dynamics Project: Forest disturbance and regrowth data. Collge Park: ORNL DAAC, Oak Ridge, Tennessee, U.S.A.
Goward, S. N., C. Huang, K. Schleeweis, F. Zhao, K. Rishmawi, J. G. Masek, W. Cohen, G. Moisen, R. Nemani & M. A. Lindsey (in prep) US national forest disturbance patterns and dynamics: NAFD Phase III results.
Goward, S. N., J. G. Masek, W. Cohen, G. Moisen, G. J. Collatz, S. Healey, R. Houghton, C. Huang, R. Kennedy, B. Law, S. Powell, D. Turner & M. A. Wulder (2008) Forest disturbance and North American carbon flux. Eos Transactions American Geophysical Union, 89, 105-116.
Huang, C., S. N. Goward, J. G. Masek, F. Gao, E. F. Vermote, N. Thomas, K. Schleeweis, R. E. Kennedy, Z. Zhu, J. C. Eidenshink & J. R. G. Townshend (2009) Development of time series stacks of Landsat images for reconstructing forest disturbance history. International Journal of Digital Earth, 2, 195-218.
Huang, C., S. N. Goward, J. G. Masek, N. Thomas, Z. Zhu & J. E. Vogelmann (2010) An automated approach for reconstructing recent forest disturbance history using dense Landsat time series stacks. Remote Sensing of Environment, 114, 183-198.
Masek, J. G., S. N. Goward, R. E. Kennedy, W. B. Cohen, G. G. Moisen, K. Schleeweis & C. Huang (2013) U.S. forest disturbance trends observed using Landsat time series. Ecosystems, 16, 1087-1104.
Masek, J. G., E. F. Vermote, N. E. Saleous, R. Wolfe, F. G. Hall, K. F. Huemmrich, F. Goa, J. Kutler & T. Lim (2006) A Landsat surface reflectance dataset for North America, 1990–2000. IEEE Geoscience and Remote Sensing Letters, 3, 68-72.
Nemani, R., P. Votava, A. Michaelis, F. Melton & C Milesi (2011) Collaborative supercomputing for global change science. Eos, Transactions American Geophysical Union, 92, 109-110.
Schleeweis, K., S. N. Goward, C. Huang, K. Rishmawi, M. A. Lindsay, A. Michaelis, J. G. Masek & . (in prep) Selection and quality assessment of Landsat data for mapping US forest history.
