Documentation Revision Date: 2020-12-03
Dataset Version: 1
Summary
These products are part of the NAFD-NEX data set, produced in collaboration with the supercomputing facilities at the NASA Ames Research Center provided by the NASA Earth Exchange. NAFD was a core project of the North American Carbon Program (NACP), and a long term collaboration between NASA, the University of Maryland, and the US Forest Service Forest Inventory and Analysis (USFS FIA) program designed to improve the understanding of the carbon budget for CONUS using 25 years of Landsat observations.
There are four GeoTIFF (*.tiff) files included in this dataset. These maps have a nominal spatial resolution of 30 m, with no additional minimum mapping unit applied.
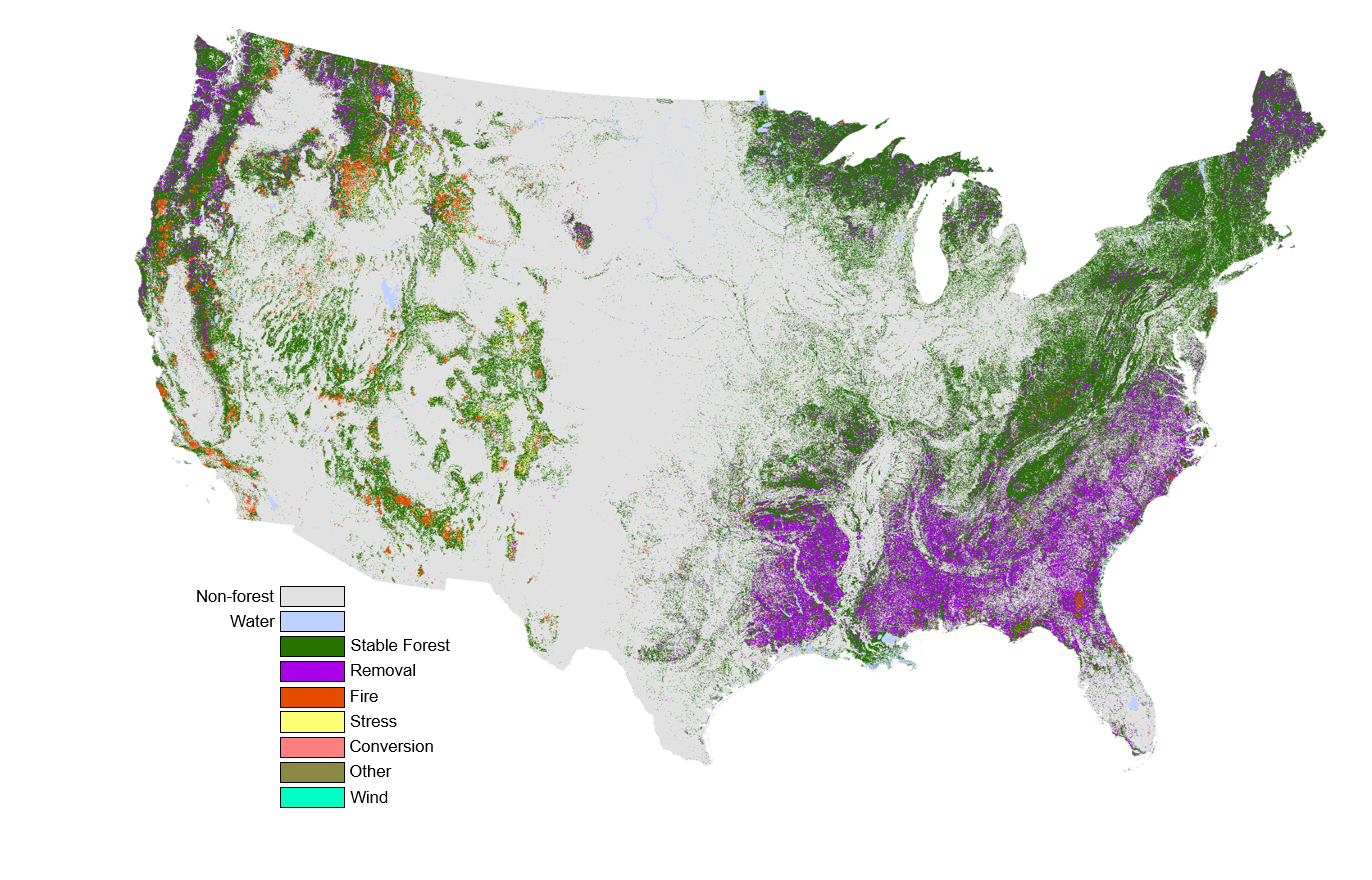
Figure 1. North American Forest Dynamics (NAFD) Attribution type layer
Citation
Schleeweis, K., G.G. Moisen, C. Toney, T.A. Schroeder, C. Huang, E.A. Freeman, S.N. Goward, and J.L. Dungan. 2020. NAFD-ATT Forest Canopy Cover Loss from Landsat, CONUS, 1986-2010. ORNL DAAC, Oak Ridge, Tennessee, USA. https://doi.org/10.3334/ORNLDAAC/1799
Table of Contents
- Dataset Overview
- Data Characteristics
- Application and Derivation
- Quality Assessment
- Data Acquisition, Materials, and Methods
- Data Access
- References
Dataset Overview
The North American Forest Dynamics (NAFD) products provided in this dataset predict characteristics related to the cause of forest canopy cover losses for the conterminous United States (CONUS) derived from Landsat images for the period 1986-2010. The characteristics are summarized in four separate data layers. The first layer labels the type of change event (stable-no change, removals, fire, stress, wind, conversion, other) (Figure 1), the second labels the year of the event, the third and fourth layers measure dominance and diversity, measures of qualitative confidence metrics derived from the model predictions. For each pixel the maps depict the greatest magnitude event occurring between 1986-2010.
These products are part of the NAFD-NEX data set, produced in collaboration with the supercomputing facilities at the NASA Ames Research Center provided by the NASA Earth Exchange, which made possible the processing and storage of large volumes of Landsat imagery and derivatives used in this study. NAFD was a core project of the North American Carbon Program (NACP), and a long term collaboration between NASA, the University of Maryland, and the US Forest Service Forest Inventory and Analysis (USFS FIA) program designed to improve the understanding of the carbon budget for CONUS using 25 years of Landsat observations (Goward et al., 2008; Masek et al., 2013, Cohen et. al., 2016, Zhao et al., 2018, Schleeweis et al. 2020).
Project: North American Carbon Program
The North American Carbon Program (NACP) is a multidisciplinary research program designed to improve understanding of North America's carbon sources, sinks, and stocks. The central objective is to measure and understand the sources and sinks of Carbon Dioxide (CO2), Methane (CH4), and Carbon Monoxide (CO) in North America and adjacent oceans. The NACP is supported by a number of different federal agencies.
Related Publications
Schleeweis, K.G., G.G. Moisen, T.A. Schroeder, C. Toney, E.A. Freeman, S.N. Goward, C. Huang, and J.L. Dungan. 2020. US National Maps Attributing Forest Change: 1986–2010. Forests, 11(6), p.653. https://doi.org/10.3390/f11060653
Zhao, F., C. Huang, S.N. Goward, K. Schleeweis, K. Rishmawi, M.A. Lindsey, et al. 2018. Development of Landsat-based annual US forest disturbance history maps (1986–2010) in support of the North American Carbon Program (NACP). Remote Sensing of Environment, 209:312-326. https://doi.org/10.1016/j.rse.2018.02.035
Schroeder, T.A., K.G. Schleeweis, G.G. Moisen, C. Toney, W.B. Cohen, E.A. Freeman, Z. Yang, and C. Huang. 2017. Testing a Landsat-based approach for mapping disturbance causality in U.S. forests. Remote Sensing of Environment, 195:230-243. https://doi.org/10.1016/j.rse.2017.03.033
Schleeweis, K., S.N. Goward, C. Huang, J.L. Dwyer, J.L. Dungan, M.A. Lindsey, A. Michaelis, K. Rishmawi, and J.G. Masek. 2016. Selection and quality assessment of Landsat data for the North American forest dynamics forest history maps of the US. International Journal of Digital Earth,9(10):1-18. https://doi.org/10.1080/17538947.2016.1158876
Cohen, W.B., Yang, Z., Stehman, S.V., Schroeder, T.A., Bell, D.M., Masek, J.G., Huang, C. and Meigs, G.W., 2016. Forest disturbance across the conterminous United States from 1985–2012: the emerging dominance of forest decline. Forest Ecology and Management, 360, pp.242-252. https://doi.org/10.1016/j.foreco.2015.10.042
Related Datasets
Goward, S.N., C. Huang, F. Zhao, K. Schleeweis, K. Rishmawi, M. Lindsey, J.L. Dungan, and A. Michaelis. 2016. NACP NAFD Project: Forest Disturbance History from Landsat, 1986-2010. ORNL DAAC, Oak Ridge, Tennessee, USA. http://dx.doi.org/10.3334/ORNLDAAC/1290
Goward, S.N., C. Huang, J.G. Masek, W.B. Cohen, G.G. Moisen, and K. Schleeweis. 2012. NACP North American Forest Dynamics Project: Forest Disturbance and Regrowth Data. ORNL DAAC, Oak Ridge, Tennessee, USA. https://doi.org/10.3334/ORNLDAAC/1077
Acknowledgments
The North American Forest Dynamics (NAFD), a core project of the North American Carbon Program (NACP), was designed to improve understanding of the carbon budget for North America for the conterminous U.S. using time-series of Landsat observations, between 1986 and 2010 (25 years) (Goward et al., 2008). The work was pursued with grant support from NASA’s Terrestrial Ecology, Carbon Cycle Sciences, and Applied Sciences Programs (NNX11AJ78G) NASA’s Carbon Monitoring System program (NNX14AR39G), and the USDA Forest Service Forest Inventory and Analysis program in the Interior West. Associated NAFD-NEX activities have been carried out by Warren Cohen, USFS Pacific Northwest Research Station (Reference data, Product Validation), Jeffrey Masek, NASA Goddard Space Flight Center (Regrowth Dynamics), Samuel N. Goward, UMD (Annual Forest Disturbance History) and Ramakrishna Nemani, NASA Ames Research Center (High-End Computing Capability).
Data Characteristics
Spatial Coverage: The conterminous United States (CONUS)
Spatial Resolution: 30 m
Temporal Coverage: 1986-06-01 to 2010-09-01 (These month and day ranges are approximate as the actual month/day depends on the quality of satellite acquisitions and the estimate length of the growing season in each path/row (Schleeweis 2016))
Temporal Resolution: A composited single event layer combining all events 1986-2010.
The study was designed to use Landsat images acquired between 1984 and 2011, however, only event maps between 1986 and 2010 are produced. The 1984 and 1985 results had many data gaps because of operational problems with Landsat 4 and 5 in these years. Also, the beginning and end of time-series analysis are removed because the change detection algorithms used are more likely to classify unidentified clouds in the last year of the time series as false disturbances. The year layer labels which year (1986-2010) the attributed event occurred.
Study Area: Latitude and longitude are given in decimal degrees.
| Site | Northernmost Latitude | Southernmost Latitude | Easternmost Longitude | Westernmost Longitude |
|---|---|---|---|---|
| Conterminous United States (CONUS) | 51.678467 | 22.69113056 | -65.202475 | -128.0289194 |
Data File Information
There are 4 files in GeoTIFF (*.tiff) format. The file naming convention is NAFD_Attribution_X.tif where X is type, year, dominance, or diversity.
Data File Details
- Projection: "North_American_1983_Albers", EPSG:5069
- Row number: 154383; Column number: 97647
- Missing data value: 254 (Over areas that were masked nonforest, the RF classification model was not run.)
Table 1. File names and descriptions.
| File Names | Description |
|---|---|
| NAFD_Attribution_type.tif | The type of event predicted over pixels during the period of observation, classes include stable (i.e., no loss), removals, fire, stress, wind, conversion, and other (Table 2). This is a composite layer derived from Landsat data that were used to predict one event per pixel for the time period of record. In locations where there could have been more than one event, the most recent and highest magnitude event type is reported. Note, the “Conversion” class only pertains to conversion (loss) out of forest cover, not to conversion (gain) into forest land through afforestation or reforestation (replanting). Technically, afforestation and reforestation are captured in the NAFD-NEX products, which includes all areas detected as forest at any point in the record of observation (1984-2010) not just those forested at the beginning of the record. |
| NAFD_Attribution_year.tif | The year of the event onset, ranging from 1986 to 2010. Note that events with an onset during the first year could have begun prior. For example, an insect outbreak that started in 1982 in the same area as slow, persistent declines in canopy cover lasting over five years would result in a pixel value corresponding to the first year of the dataset's timespan (i.e., 1986). |
| NAFD_Attribution_dominance.tif | Simpson’s dominance index (D) characterizes evenness of a set of values, taking into account the number of values in the set as well as the relative abundance of each value. Simpson’s dominance index (D) characterizes evenness of a set of values, taking into account the number of values in the set as well as the relative abundance of each value. The vote proportion for each response class is squared, and the squares are summed. Dominance is a measure of the information energy of a system in that if (in this case) one class has the maximum proportion of votes, than it has a higher dominance index. A decreased or lower dominance would be related to a related rise in the equitable distribution of the class proportions, especially if the number of classes decreases. |
| NAFD_Attribution_confidence.tif | The difference between the proportion of votes for the “winning” class and the proportion of votes for the runner-up class is recorded in the confidence layer of the NAFD attribution product. Larger numbers imply a larger difference in the proportions of votes between the winning and the runner up class and a related higher “confidence” in the prediction. Lower numbers indicate a closer call between the winning class and the runner up. This confidence metric is not similar to confidence intervals derived from probabilities and statistical inference. |
*Random Forest classification selects the class (i.e., event type) with the majority of "votes" from the “forest” of decision trees as the "winning" prediction for a pixel.
Table 2. Data file values and value descriptions.
| File Name | Value | Description |
|---|---|---|
| NAFD_Attribution_type.tif | 1 | Non-forest land cover |
| 4 | Water | |
| 100 | Stable forest cover (no loss) | |
| 101 | Removals | |
| 102 | Fire | |
| 103 | Other | |
| 104 | Stress | |
| 105 | Wind | |
| 107 | Conversion | |
| NAFD_Attribution_year.tif | 16–40 | The year of forest disturbance; the pixel value plus 1970 equals the year of the event (e.g., a pixel with a value of 33 was disturbed in 2003) |
| 99 | No event | |
| NAFD_Attribution_dominance.tif | 16–100 | The pixel level Shanon’s Dominance index (D), a measure of evenness of the distribution of votes proportions across all classes. |
| NAFD_Attribution_confidence.tif | 1–100 | The difference between the number of random forests votes for the winning class (i.e., the predicted event type) and the number for the runner-up class |
Application and Derivation
According to Schleeweis et al. 2020, this study attributes the cause of major forest loss event types including removal, fires, stress and conversion annually across the nation at the spatial scale of forest stands (hectares). This is the first CONUS wide map of removal area spanning the years between 1986 and 2010. Advantages of national products include consistency in grain, scale and methodology, but disadvantages include a lack of ecological depth and difficulty in characterizing rare classes (Hermosilla et al., 2015). These products capture one event per pixel over the period of observation. This limitation may lead to under representation in areas where repeat events are common, as in partial harvesting in industrial forests, or in areas where synergies between disturbance types are common, such as when beetle attacks precede large fire events. This national attribution map can be used to inform sampling efforts, including pre and post- stratification to improve precision in design-based and small area estimation (Schroeder et al., 2014). The scale of these maps support regional to local applications, though as with similar national products developed with Landsat imagery, we caution against per pixel analysis (Blankenship et al., 2012). Other current applications include neighborhood analysis to explore relationships between intact forests, fragmentation and change processes, as well as combining neighborhood analysis of these data with forest characteristics from FIA plots to estimate the impact of canopy cover loss on different forest attributes such as ownership and forest type.
Quality Assessment
Two indirect derivatives of the random forest modeling process were used to quantify model confidence.
- The first measure of model confidence is dominance. Random forest selects the class (i.e., event type) with the majority of "votes" from the "forest" of decision trees as the "winning" prediction for each unit (i.e., pixel). To document the strength (i.e., dominance) of the winning class, the votes for the "runner-up" class were subtracted from the votes for the winning class. Larger numbers imply a larger difference between the winning class and the runner up, whereas smaller numbers indicate that it was a "close call" between the winning class and the runner up.
- The second measure of model confidence is diversity/evenness. The vector of the number of votes for all classes (i.e., event type) was used to calculate a diversity index for each pixel, which provides a measure of evenness of the distribution of votes across all classes, for each prediction unit (i.e., pixel). Simpson’s Diversity Index was used to characterize diversity in the per-pixel vector containing the richness (i.e., number of votes) for each class. For a given measure of richness, diversity increases as equitability increases, and for a given measure of equitability, diversity increases as richness increases.
Over areas that were masked as nonforest, the random forest classification model was not run and the pixels assume the missing data value and no values for dominance or diversity.
Weighted out-of-bag (OOB) errors under the two-step design were calculated for the five reference data strata, yielding accuracy statistics with associated sampling variance and standard errors for each response class. Training data were collected with a two-stage sampling design that first divided the nation into five strata based on forest characteristics, then randomly selected sample areas within the strata (see section "Training data and Modeling").
For more information, see Schleeweis et al. (2020).
Data Acquisition, Materials, and Methods
The event type map (Figure 1) was produced using a Random Forest (RF) ensemble model. Data gathered for reference and validation of the NAFD-NEX annual products was used as training for the RF attribution model. Response classes included, stable-no change forests, fire, removal, stress, wind, conversion and other. Predictor data sets used included an ensemble of forest change results and metrics from multiple disturbance algorithms including, the Vegetation Change Tracker (VCT) (Huang et al., 2010), the Shapes algorithm, and Monitoring Trends in Burn Severity (MTBS) outputs. In addition to these ‘dynamic’ predictors that summarized the landscape through time, ‘static’ vegetation and topographic predictors were also used (aggregated LANDFIRE existing vegetation type v1.4, elevation, slope, aspect, latitude and longitude).

Figure 2: The four layers of the NAFD-ATT dataset include, type, year, confidence and dominance.
The second map has pixels classified by year of onset for the event in that location (pixel). The third and fourth data layers provide additional information on the event type map quality, reflecting confidence and dominance, respectively. For example, if a pixel is labeled as fire and has a high confidence index value that fire prediction had a much larger proportion of trees votes than the next class in ranked order (Figure 2). On the other hand if a pixel is labeled as fire and a low dominance index than the proportion of votes was very evenly distributed among the 6 response classes evaluated, even if the fire class won the prediction with slightly more votes.
Following is a brief synopsis of methods from Schleeweis et al. (2020).
Image Selection and Processing
In Phase III of the North American Forest Dynamics (NAFD) project, the US Landsat observation record was evaluated annually during the growing season (June through September) for 434 path-row locations for the time period 1986-2010. The month and day ranges are approximate as the actual month/day depends on the quality of satellite acquisitions and the estimated length of the growing season in each path/row (Schleeweis, 2016). Landsat images were acquired through the NEX platform from EROS data center, prior to collection 1.
An automated NAFD Image Selection and Processing stream (NISPS) was designed and used to select the Landsat images to produce disturbance products. All images used were processed to Level-1 Terrain corrected (L1T) by the USGS Earth Resources Observation and Science (EROS) Center and ingested into the NASA Earth Exchange (NEX) computing environment at NASA Ames Research Center. In NEX, over 60,000 images were converted to surface reflectance using the atmospheric correction algorithm implemented in LEDAPS v2.0. The LEDAPS AROP package version 2.5 was used to verify that the tie points between an image and its equivalent in the orthorectified GLS 2000 reference image met minimum project requirements (Gao et al., 2009).
Training Data and Modeling
The NAFD-Attribution products provide a per pixel model prediction of the event type attributed to canopy cover loss events. Three change algorithms were used as predictor variables: the vegetation change tracker (VCT) algorithm, the Shapes algorithm, and the MTBS burn severity raster. The disturbance year was calculated.
Training Data: A sample of 7,200 TimeSync plots, collected through a two-stage sample design, were used for training the classification model. There were 180 non-overlapping sampling units, randomly located within each of 5 strata (based on forest area and type), with more samples in areas of more diverse and abundant forest regions. Sampling unit centers were defined by the WRS-2 Landsat path-row reference grid, and 40 plots were randomly distributed within each selected sample unit, 2,700 plots fell on land that had forest cover at some point in the time-series. Full details of the sampling scheme are available and were led by the NAFD training and validation group Cohen et al., (2016). All training data sets included land cover and land use observations for each plot. Plots labeled as “mechanical” forest change processes, were relabeled to “removal” or “conversion” depending on evidence of vegetation recovery and/or land use change. “Mechanical clearings”, observed within six years of the end of the time series, were labeled as removal unless there was evidence of land use change. At the end of the time series, it is harder to determine whether forest change is the result of land use conversion or ongoing silviculture.
Further training data included plots from the LANDFIRE project, FIA ground data, and analyst interpretation of Landsat/aerial time-series images using Timesync software (details available in Schroeder et al., (2014)). These opportunistic data were not appropriate for inference, thus they were not used in calculating out-of-bag (OOB) accuracy measures.
Modeling: Outputs from three change algorithms were used as predictor variables in the ensemble random forest classification model: the vegetation change tracker (VCT) algorithm, the Shapes algorithm, and the MTBS burn severity raster. Local geographic predictors included aspect, slope, latitude and longitude, elevation, and transformed aspect. Vegetation predictors include USFS forest group type and probability, down sampled from 250 m to 30 m, and LANDFIRE Existing Vegetation Type (EVT v1.4.0) data collapsed to three classes: agriculture, forest, and developed.
Following a two-step, “flat-to-annual” process (Moisen et al., 2016; Schroeder et al., 2017), a categorical random forest model was constructed for the event type classes, and then the disturbance year was calculated using a simple, rule-based approach and temporal metrics from the three predictor disturbance algorithms. The foundation for these heuristic rules were tested in the pilot study and modified for the national modeling to take advantage of the temporal metrics from all three of the disturbance algorithms used as predictor variables.
Mosaicking
The NAFD-NEX (NASA Earth Exchange) forest/non-forest areas from the path-row data level were used to limit the number of pixels for event prediction. Note: This NAFD NEX masking step is a byproduct of the VCT algorithm and though it has an temporally integrated mmu applied at the annual path-row level this differs largely from the temporal-integration and mmu filtering done on the national mosaics (Zhao et al., 2018). Therefore, forest areas in the VCT annual disturbance national mosaics and these attribution national mosaics may not coincide. Random Forests models were run only on forested pixels to predict response classes of event type at the path-row level. Path-row level results were stitched together to make a national mosaic, using the same technique as the NAFD-NEX mosaics (Zhao et al., 2018).
This dataset covers CONUS with 434 WRS2 path-row tiles. Three additional WRS2 tiles (i.e., p023r027, p016r029, and p016r043) are required to provide complete coverage of the CONUS, but each of those tiles has less than 5% land areas within the CONUS. Those tiles were not included in the original NAFD-NEX study nor this NAFD-ATT study which used the same Landsat time series stacks for each path-row. Given the large overlaps between the path-row tiles used in this study, less than 0.14% of the CONUS is missing in this dataset.
Data Access
These data are available through the Oak Ridge National Laboratory (ORNL) Distributed Active Archive Center (DAAC).
NAFD-ATT Forest Canopy Cover Loss from Landsat, CONUS, 1986-2010
Contact for Data Center Access Information:
- E-mail: uso@daac.ornl.gov
- Telephone: +1 (865) 241-3952
References
Blankenship, K., Smith, J., Swaty, R., Shlisky, A. J., Patton, J., & Hagen, S. (2012). Modeling on the grand scale: LANDFIRE lessons learned. In In: Kerns, Becky K.; Shlisky, Ayn J.; Daniel, Colin J., tech. eds. Proceedings of the First Landscape State-and-Transition Simulation Modeling Conference, June 14–16, 2011, Portland, Oregon. Gen. Tech. Rep. PNW-GTR-869. Portland, OR: US Department of Agriculture, Forest Service, Pacific Northwest Research Station: 43-56. (pp. 43-56).
Cohen, W.B., Yang, Z., Stehman, S.V., Schroeder, T.A., Bell, D.M., Masek, J.G., Huang, C. and Meigs, G.W., 2016. Forest disturbance across the conterminous United States from 1985–2012: the emerging dominance of forest decline. Forest Ecology and Management, 360, pp.242-252. https://doi.org/10.1016/j.foreco.2015.10.042
Eidenshink, J., B. Schwind, K. Brewer, Z. Zhu, B. Quayle, and S. Howard. 2007. A project for monitoring trends in burn severity. Fire Ecology 3(1): 3-21. https://doi.org/10.4996/fireecology.0301003
Gao, F., J. Masek, and R.E. Wolfe. 2009. Automated registration and orthorectification package for Landsat and Landsat-like data processing. Journal of Applied Remote Sensing, 3:033515. https://doi.org/10.1117/1.3104620
Goward, S.N., Masek, J.G., Cohen, W., Moisen, G., Collatz, G.J., Healey, S., Houghton, R.A., Huang, C., Kennedy, R., Law, B. and Powell, S., 2008. Forest disturbance and North American carbon flux. Eos, Transactions American Geophysical Union, 89(11), pp.105-106. https://doi.org/10.1029/2008EO110001
Hermosilla, T.; Wulder, M.A.; White, J.C.; Coops, N.C.; Hobart, G.W. Regional detection, characterization, and attribution of annual forest change from 1984 to 2012 using Landsat-derived time-series metrics. Remote Sensing of Environment 2015, 170, 121-132, doi:http://dx.doi.org/10.1016/j.rse.2015.09.004.
Huang, C.; Goward, S.N.; Masek, J.G.; Thomas, N.; Zhu, Z.; Vogelmann, J.E. An automated approach for reconstructing recent forest disturbance history using dense Landsat time series stacks. Remote Sensing of Environment 2010, 114, 183-198. https://doi.org/10.1007/s10021-013-9669-9
Masek, J.G., Goward, S.N., Kennedy, R.E., Cohen, W.B., Moisen, G.G., Schleeweis, K. and Huang, C., 2013. United States forest disturbance trends observed using Landsat time series. Ecosystems, 16(6), pp.1087-1104.
Meyer, M.C. A simple new algorithm for quadratic programming with applications in statistics. Communications in Statistics-Simulation and Computation 2013, 42, 1126-1139.
Meyer, M.C. Inference using shape-restricted regression splines. The Annals of Applied Statistics 2008, 2, https://doi.org/10.1214/08-AOAS167
Moisen, G.G., M.C. Meyer, T.A. Schroeder, X. Liao, K.G. Schleeweis, E.A. Freeman, and J.C. Toney. 2016. Shape selection in Landsat time series: A tool for monitoring forest dynamics. Global Change Biology, 22:3518-3528. https://doi.org/10.1111/gcb.13358
Schleeweis, K.G., Moisen, G.G., Schroeder, T.A., Toney, C., Freeman, E.A., Goward, S.N., Huang, C. and Dungan, J.L., 2020. US National Maps Attributing Forest Change: 1986–2010. Forests, 11(6), p.653. https://doi.org/10.3390/f11060653
Schleeweis, K., S.N. Goward, C. Huang, J.L. Dwyer, J.L. Dungan, M.A. Lindsey, A. Michaelis, K. Rishmawi, and J.G. Masek. 2016. Selection and quality assessment of Landsat data for the North American forest dynamics forest history maps of the US. International Journal of Digital Earth, 9(10):1-18. https://doi.org/10.1080/17538947.2016.1158876
Schroeder, T.A., K.G. Schleeweis, G.G. Moisen, C. Toney, W.B. Cohen, E.A. Freeman, Z. Yang, and C. Huang. 2017. Testing a Landsat-based approach for mapping disturbance causality in U.S. forests. Remote Sensing of Environment, 195:230-243. https://doi.org/10.1016/j.rse.2017.03.033
Schroeder, T.A.; Healey, S.P.; Moisen, G.G.; Frescino, T.S.; Cohen, W.B.; Huang, C.; Kennedy, R.E.; Yang, Z. Improving estimates of forest disturbance by combining observations from Landsat time series with U.S. Forest Service Forest Inventory and Analysis data. Remote Sensing of Environment 2014, 154, 61-73, doi:https://doi.org/10.1016/j.rse.2014.08.005.
Simpson, E.H. 1949. Measurement of Diversity. Nature, 163: 688. https://doi.org/10.1038/163688a0
Zhao, F., C. Huang, S.N. Goward, K. Schleeweis, K. Rishmawi, M.A. Lindsey, et al. 2018. Development of Landsat-based annual US forest disturbance history maps (1986–2010) in support of the North American Carbon Program (NACP). Remote Sensing of Environment, 209:312-326. https://doi.org/10.1016/j.rse.2018.02.035