Documentation Revision Date: 2018-01-03
Data Set Version: 1
Summary
This data set includes 13 compressed shapefiles (*.zip). The shapefile data are also provided in .kmz format for viewing in Google Earth.
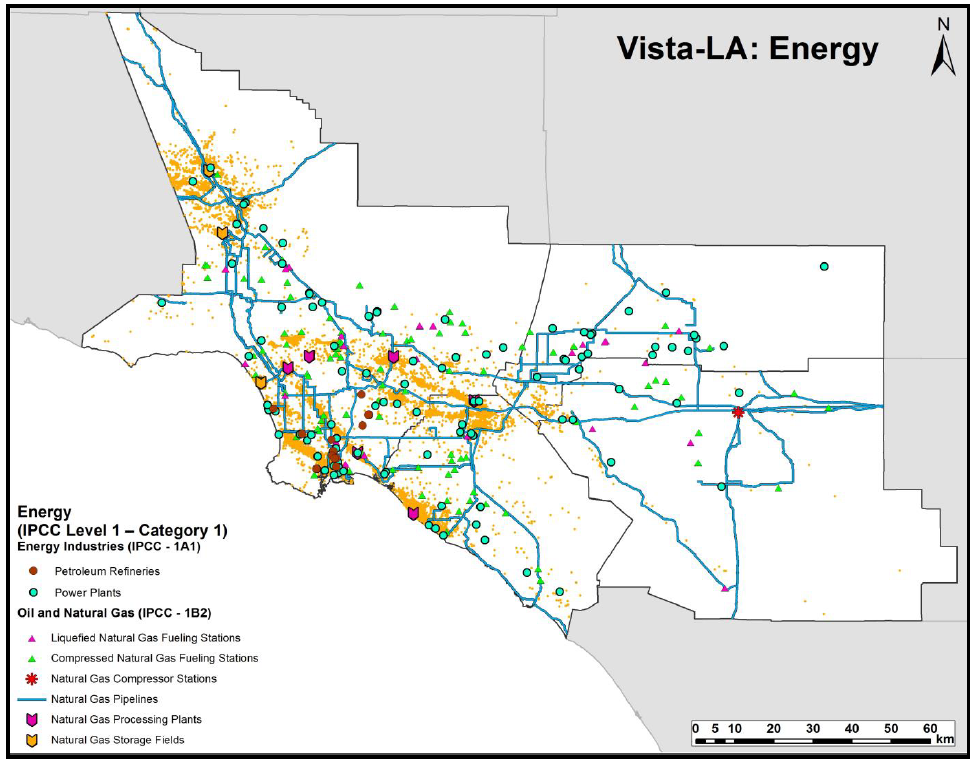
Figure 1. Locations for infrastructures associated with the energy industry with known or expected potential to emit CH4 in the South Coast Air Basin (SoCAB). Vista-LA includes a total of 33,614 features across 13 layers. From Carranza et al., 2017.
Citation
Carranza, V., T. Rafiq, I. Frausto-Vicencio, F. Hopkins, K.R. Verhulst, P. Rao, R.M. Duren, and C.E. Miller. 2018. Sources of Methane Emissions (Vista-LA), South Coast Air Basin, California, USA. ORNL DAAC, Oak Ridge, Tennessee, USA. https://doi.org/10.3334/ORNLDAAC/1525
Table of Contents
- Data Set Overview
- Data Characteristics
- Application and Derivation
- Quality Assessment
- Data Acquisition, Materials, and Methods
- Data Access
- References
Data Set Overview
The Vista-LA database is a GIS-based CH4 emissions mapping database designed to address shortcomings in current urban CH4 inventories. Vista encompasses key CH4 emissions categories from the Intergovernmental Panel on Climate Change (IPCC) greenhouse gas (GHG) inventory methodology. Vista-LA spatial data identify and classify locations of potential methane emitting facilities and infrastructure in the South Coast Air Basin (SoCAB). SoCAB is the air shed for the greater Los Angeles urban extent, which includes urbanized portions of the Los Angeles, Orange, Riverside, and San Bernardino Counties. Vista-LA spatial data were created utilizing an assortment of publicly available data sources from local, state, and federal agencies. Vista-LA spatial data are organized using the IPCC categorization for greenhouse gas emissions. IPCC categories utilize a level system (levels 1 to 3), with level 1 relating to general categories (“CH4 Sectors”) and level 3 relating to specific emission sources (“CH4 Sources”). This database contains over 33,000 entries which are presented as CH4 emitting infrastructure maps that will improve understanding of CH4 emissions in the Los Angeles megacity.
Project: North American Carbon Program (NACP)
The North American Carbon Program (NACP) is a multidisciplinary research program to obtain scientific understanding of North America's carbon sources and sinks and of changes in carbon stocks needed to meet societal concerns and to provide tools for decision makers.
Related Publication:
Carranza, V., T. Rafiq, I. Frausto-Vicencio, F. Hopkins, K.R. Verhulst, P. Rao, R.M. Duren, and C.E. Miller. 2017. Vista-LA: Mapping methane emitting infrastructure in the Los Angeles megacity. Submitted to Earth Syst. Sci. Data.
Acknowledgements:
This project was funded by the NASA Carbon Cycle Science Program Grant NNN13D504T.
Data Characteristics
Spatial Coverage: South Coast Air Basin (SoCAB), California, USA
Spatial Resolution: point, polylines, and polygons
Temporal Coverage: 2005-01-01 to 2017-03-31
Temporal Resolution: One time
Study Area (All latitude and longitude given in decimal degrees)
|
Site |
West |
East |
North |
South |
|---|---|---|---|---|
|
South Coast Air Basin (SoCAB) that includes urbanized portions of Los Angeles, Orange, Riverside, and San Bernardino Counties |
-118.913288 |
-116.676164 |
34.81774 |
33.433425 |
Data File Information:
The Vista-LA data set features thirteen spatial layers totaling to 33,614 individual features comprised of geo-located and validated points, polylines, and polygons. This data set contains 13 compressed shapefiles (.zip) of which three are point layers, one is a polyline layer, and nine are polygon layers. The spatial domain for all the data has been geo-processed to fit the SoCAB extent and all data are georeferenced to the WGS 1984 Datum and UTM Zone 11N Projection. Units for dimensions and activity data has been kept consistent with the original data source.
Companion Files: 13 .kmz files are provided which contain the shapefile data for viewing in Google Earth along with NACP_Vista_LA_Data_Information.pdf that provides specific information and definitions for every data field found in each Vista-LA spatial layer
Table 1. Data file names and descriptions
| File Names | Description |
|---|---|
| VistaLA_Anaerobic_Lagoons.zip | The Vista-LA anaerobic lagoons layer contains a total of 228 anaerobic lagoons in SoCAB based on National Agriculture Imagery Program (NAIP) and Google Earth’s Time Tool for the year 2015. |
| VistaLA_CNG_Fueling_Stations.zip | The Vista-LA CNG fueling stations data provides location, extent and site specific information for 109 Compressed Natural Gas (CNG) fueling stations within SoCAB based on USDOE’s Alternative Fuels Data Center for the year 2017. |
| VistaLA_Dairies.zip | The Vista-LA dairy layer contains a total of 110 dairy facilities in SoCAB based on data from California Regional Water Quality Control Board (RWQCB) 2015. |
| VistaLA_LNG_Fueling_Stations.zip | The Vista-LA LNG fueling stations data provides location, extent and site specific information for 27 liquefied natural gas (LNG) fueling stations within SoCAB based on USDOE’s Alternative Fuels Data Center for the year 2017. |
| VistaLA_Landfills.zip | The Vista-LA landfills data provides location, extent, site-specific information (such as throughput, capacity, and waste types) and operation status for 334 landfills within SoCAB based on data from CalRecycle 2015 and Southern California Association of Governments (SCAG) land use data for the years 2005 and 2012. |
| VistaLA_NG_Compressor_Stations.zip | The Vista-LA natural gas compressor stations layer contains two verified geolocated natural gas compressor stations located in SoCAB from data obtained from USEPA’s facility level information on GHG online reporting Tool (EPA Flight 2016). |
| VistaLA_NG_Pipelines.zip | The Vista-LA natural gas pipelines layer contains 111 polyline segments located in SoCAB based on data from the US Energy Information Administration (EIA 2017). |
| VistaLA_NG_Processing_Plants.zip | The Vista-LA natural gas processing plant layer contains verified geolocated polygons of 6 facilities located in SoCAB based on data from US Energy Information Administration (EIA) online database for the year 2014. |
| VistaLA_NG_Storage_Fields.zip | The Vista-LA natural gas storage field polygon layer contains the spatial and attribute information of the three natural gas storage facilities located within SoCAB based on data for the year 2016 from US Energy Information Administration (EIA) and California's Division of Oil, Gas, and Geothermal Resources (DOGGR 2016). |
| VistaLA_Oil_Gas_Wells.zip | The Vista-LA oil and gas wells layer contains information on 32,537 oil and gas wells within the SoCAB based on data from DOGGR 2016. |
| VistaLA_Petroleum_Refineries.zip | The Vista-LA petroleum refinery data provides location and extent data for 12 petroleum refineries within SoCAB based on data from US Energy Information Administration (EIA) 2016 and Southern California Association of Governments (SCAG) land use data for the years 2005 and 2012. |
| VistaLA_Power_Plants.zip | The Vista-LA power plants data provides location and extent data for 109 power plants within SoCAB based on data from US Energy Information Administration (EIA) 2016 and Southern California Association of Governments (SCAG) land use data for the years 2005 and 2012. |
| VistaLA_Wastewater_Treatment_Plants.zip | The Vista-LA wastewater treatment plants layer provides accurate location, extent and facility level metrics for a total of 26 largest domestic wastewater treatment plants in SoCAB based on data from California Air Resources Board (CARB) 2016 and SCAG 2005, 2012. |
Attributes of the respective shapefiles are provided in Tables 2-14 below.
Table 2: VistaLA_Anaerobic_Lagoons.zip
| Field | Description |
| FID | Feature identification number |
| Shape | Vector format identification |
| Longitude | x-coordinate in decimal degrees |
| Latitude | y-coordinate in decimal degrees |
| VistaDate | Date of most recent update by the NASA JPL Vista Team |
Table 3: VistaLA_CNG_Fueling_Stations.zip
| Field | Description | ||||||||||||||
| FID | Feature identification number | ||||||||||||||
| Shape | Vector format identification | ||||||||||||||
| Fuel_Type | CNG=Compressed Natural Gas | ||||||||||||||
| Station_Na | Station Name; Name of the CNG fueling station | ||||||||||||||
| Station_Add | Station Address; Address of the CNG fueling station | ||||||||||||||
| City_1 | City location of the CNG fueling station | ||||||||||||||
| State | State location of the CNG fueling station | ||||||||||||||
| ZIP | Zip Code of the CNG fueling station | ||||||||||||||
| Status_Cod | Status Code; The current status of the station given as a code; E=Open | ||||||||||||||
| NG_Fill_Ty | The type of dispensing capability available at CNG stations
|
||||||||||||||
| NG_PSI | Natural Gas operating pressure (pounds per square inch) | ||||||||||||||
| Latitude | y-coordinate in decimal degrees | ||||||||||||||
| Longitude | x-coordinate in decimal degrees | ||||||||||||||
| ID_1 | CNG fueling station identification number | ||||||||||||||
| Owner_Type | The type of organization that owns the fueling infrastructure
|
||||||||||||||
| Federal_Ag | Federal Agency; A record for the federal agency that owns the CNG station is displayed if it is owned by one | ||||||||||||||
| Open_Date | Date when the CNG fueling station opened | ||||||||||||||
| NG_Vehicle | Type of vehicles served at the CNG fueling station
|
||||||||||||||
| Notes | Vista validation notes | ||||||||||||||
| Ver_Google | Y/N Flag to indicate verification with Google Earth aerial imagery | ||||||||||||||
| Vista_Date | Date of most recent update by the NASA JPL Vista Team |
Table 4: VistaLA_Dairies.zip
| Field | Description |
| FID | Feature identification number |
| Shape | Vector format identification |
| Site_Descr | Site Description; Name of the farm |
| Facility_S | Address of the farm |
| Basin | Basin location of the farm |
| Place_ID | Unique dairy farm identifier |
| GPSLat_D | Latitude, y-coordinate in decimal degrees |
| GPSLong_D | Longitude, x-coordinate in decimal degrees |
| Report_Y ea | Year the report was generated |
| No_Milking | Amount of milking cows on the farm |
| Report_Y_1 | Amount of dry cows on the farm |
| No_Heifers | Amount of young female cows that haven’t borne a calf on the farm |
| No_Calves | Amount of young cows on the farm |
| No_Horses | Amount of horses on the farm |
| No_Pigs | Amount of pigs on the farm |
| Others | Amount of other animals on the farm |
| Annual_Man | Amount of manure produced (tons/year) |
| Manure_Hau | Amount of manure hauled (tons/year) |
| FacilityCr | Amount of crops at a facility (tons) (if available) |
| Crop | Types of crops grown on the farm (if applicable) |
| WW | Amount of waste water generated (gallons/day) |
| ver_Google | Y/N Flag to indicate verification with Google Earth aerial imagery |
| notes | Vista validation notes |
| VistaDate | Date of most recent update by the NASA JPL Vista Team |
Table 5: VistaLA_LNG_Fueling_Stations.zip
| Field | Description | ||||||||||||||
| FID | Feature identification number | ||||||||||||||
| Shape | Vector format identification | ||||||||||||||
| State | State | ||||||||||||||
| StAddr | Street Address | ||||||||||||||
| City | City | ||||||||||||||
| Postal | Zip Code | ||||||||||||||
| Fuel_Type | Fuel Type used at the fueling station; LNG= liquefied natural gas | ||||||||||||||
| Station_1 | Station Name; Name of the LNG fueling station | ||||||||||||||
| Intersecti | Intersection; Location of the nearest intersection | ||||||||||||||
| Station_Ph | Station Phone; Phone number of LNG fueling station (if available) | ||||||||||||||
| Station_C_1 | Station Code; The current status of the station given as a code; E=Open | ||||||||||||||
| Latitude_1 | Y-coordinate in decimal degrees | ||||||||||||||
| Longitud_1 | X-coordinate in decimal degrees | ||||||||||||||
| ID_12 | LNG fueling station identification number | ||||||||||||||
| Owner_Ty_1 | The type of organization that owns the fueling infrastructure
|
||||||||||||||
| Open_Date_1 | Date when the LNG fueling station opened | ||||||||||||||
| NG_Vehic_1 | Type of vehicles served at the LNG fueling station
|
||||||||||||||
| Notes | Vista validation notes | ||||||||||||||
| Ver_Google | Y/N Flag to indicate verification with Google Earth aerial imagery | ||||||||||||||
| VistaDate | Date of most recent update by the NASA JPL Vista Team | ||||||||||||||
Table 6: VistaLA_Landfills.zip
| Field | Description | ||||||||||||||||
| Location | Address of the landfill | ||||||||||||||||
| Placename | Name of the city the landfill resides in | ||||||||||||||||
| Zip | Zip code the landfill resides in | ||||||||||||||||
| EnforAgent | Enforcement Agency; the entity responsible for enforcing solid waste handling laws and regulations in a particular jurisdiction in the state. | ||||||||||||||||
| Owner | Name of the owner of the landfill | ||||||||||||||||
| Category | A set of waste management activities that are related through similar waste handling methods. Categories include: Transfer/Process, Composting, Transformation, Disposal, Waste Tire Site
|
||||||||||||||||
| Activity | A solid waste facility or site or operation may include one or more waste handling activities.
|
||||||||||||||||
| RegStatus | Regulatory Status; The state of a particular waste handling facility, operation or site with respect to the requirements that the waste handling activities are to be conducted under the terms and conditions of a permit, closure plan, never been required to have a permit, or currently not required to have a permit.
|
||||||||||||||||
| OpStatus | Operation Status of the landfill | ||||||||||||||||
| Latitude | y-coordinate in decimal degrees | ||||||||||||||||
| Longitude | x-coordinate in decimal degrees | ||||||||||||||||
| SiteID | Unique numeric identifier for the landfill site | ||||||||||||||||
| UnitID | Unique numeric identifier for the landfill unit | ||||||||||||||||
| Ver_Google | Y/N Flag to indicate verification with Google Earth aerial imagery | ||||||||||||||||
| Ver_SCAG_0 | Y/N Flag to indicate verification with SCAG 2005 land use data | ||||||||||||||||
| Ver_SCAG_1 | Y/N Flag to indicate verification with SCAG 2012 land use data | ||||||||||||||||
| Notes | Vista validation notes | ||||||||||||||||
| Shape_Area | Area of the polygon (square miles) | ||||||||||||||||
| VistaDate | Date of most recent update by the NASA JPL Vista Team |
Table 7: VistaLA_NG_Compressor_Stations.zip
| Field | Description |
| FID | Feature identification number |
| Shape | Vector format identification |
| Facility_N | Name of the natural gas compressor station |
| Operator_N | Name of the operator in charge of the natural gas compressor station |
| Address | Address of the natural gas compressor station |
| City | City of the natural gas compressor station |
| County | County of the natural gas compressor station |
| State | State of the natural gas compressor station |
| Zip_Code | Zipcode of the compressor station |
| Latitude | y-coordinate in decimal degrees |
| Longitude | x-coordinate in decimal degrees |
| Ver_Google | Y/N Flag to indicate verification with Google Earth aerial imagery |
| VistaDate | Date of most recent update by the NASA JPL Vista Team |
Table 8: VistaLA_NG_Pipelines.zip
| Field | Description |
| FID | Feature identification number |
| Shape | Vector format identification |
| Typepipe | Pipeline extent type, intrastate=within a state, interstate=between states |
| Operator | Name of Operating Company |
| Length | Length of pipeline line segment (miles) |
Table 9: VistaLA_NG_Processing_Plants.zip
| Field | Description |
| FID | Feature identification number |
| Shape | Vector format identification |
| Facility | Facility name of the natural gas processing plant |
| Owner | Name of the natural gas processing plant Owner |
| Operator | Name of the natural gas processing plant Operator |
| State | State of the natural gas processing plant |
| County | County of the natural gas processing plant |
| City | City of the natural gas processing plant |
| ZipCode | Zip code of the natural gas processing plant |
| Plant_Flow | Plant flow (Million cubic feet per day) |
| BTU_Conten | Energy Content (British thermal units) |
| Dry_Stor | Dry Storage (Million cubic feet) |
| NGL_Stor | Amount of liquefied natural gas stored at this processing plant (barrel) |
| Latitude | y-coordinate in decimal degrees |
| Longitude | x-coordinate in decimal degrees |
| Capa_MMcfd | Processing capacity of the natural gas processing plant (Million cubic feet per day) |
| Ver_Google | Y/N Flag to indicate verification with Google Earth aerial imagery |
| VistaDate | Date of most recent update by the NASA JPL Vista Team |
Table 10: VistaLA_NG_Storage_Fields.zip
| Field | Description |
| FID | Feature identification number |
| Shape | Vector format identification |
| NAME | Name of the natural gas storage field |
| FIELD_CODE | DOGGR field boundary identifier |
| AREA_SQ_MI | Area of the natural gas storage field (square miles) |
| AREA_ACRE | Area of the natural gas storage field (acres) |
| PERIMETER | Length of perimeter around the natural gas storage field (miles) |
| District | DOGGR field boundary district number for the state of California (6 total districts) |
| Statename | Name of the state of the natural gas storage field |
| Reservoir | Name of the reservoir of the natural gas storage field |
| Fld_type | Field Type; the type of field the natural gas sits in |
| Company | Name of the operating company of the natural gas storage field |
| County | Name of the county of the natural gas storage field |
| Region | Name of the region of the natural gas storage field |
| Status | Operational status of the natural gas storage field |
| Base_gas | Volume of natural gas intended as permanent inventory in a storage reservoir to maintain adequate pressure and deliverability rates throughout the withdrawal season (million cubic feet) |
| Work_cap | Total gas storage capacity minus base gas (million cubic feet) |
| Fld_cap | Maximum volume of natural gas that can be stored in an underground storage facility in accordance with its design, which comprises the physical characteristics of the reservoir, installed equipment, and operating procedures particular to the site (million cubic feet) |
| Maxdeliv | Maximum amount of gas that can be delivered (withdrawn) from a storage facility on a daily basis (million cubic feet per day) |
| Source | Source of the U.S. EIA survey used to obtain data |
| Period | Last updated by the U.S. EIA |
| Latitude | y-coordinate in decimal degrees |
| Longitude | x-coordinate in decimal degrees |
| VistaDate | Date of most recent update by the NASA JPL Vista Team |
Table 11: VistaLA_Oil_Gas_Wells.zip
| Field | Description | ||||||||||||||||||||||||||||||
| FID | Feature identification number | ||||||||||||||||||||||||||||||
| Shape | Vector format identification | ||||||||||||||||||||||||||||||
| APINumber | Unique, permanent number assigned to each well as standardized by the American Petroleum Institute | ||||||||||||||||||||||||||||||
| WellNumber | Operator assigned designation for well | ||||||||||||||||||||||||||||||
| WellStatus | Current status of the well
|
||||||||||||||||||||||||||||||
| GISSymbol | Well status code that uses 2-digits to identify type of well
|
||||||||||||||||||||||||||||||
| OperatorCo | Operator Company; Unique, permanent number assigned to each operator | ||||||||||||||||||||||||||||||
| OperatorNa | Operator Name; Name of individual or organization responsible for management of well | ||||||||||||||||||||||||||||||
| LeaseName | Name of Oil & Gas lease in which well is located | ||||||||||||||||||||||||||||||
| FieldName | Name of Oil & Gas field in which the well is located | ||||||||||||||||||||||||||||||
| AreaName | Name of area in which well is located | ||||||||||||||||||||||||||||||
| District | California Department of Conservation Division of Oil, Gas and Geothermal Resources (DOGGR) district with jurisdiction over the location in which well is located | ||||||||||||||||||||||||||||||
| County | County with jurisdiction over the location in which well is located | ||||||||||||||||||||||||||||||
| Section_ | Public Land Survey System section number in which well is located | ||||||||||||||||||||||||||||||
| Township | Public Land Survey System township in which well is located | ||||||||||||||||||||||||||||||
| Range | Public Land Survey System range in which well is located | ||||||||||||||||||||||||||||||
| Township_D | Single digit designator for Public Land Survey System township in which well is located | ||||||||||||||||||||||||||||||
| Range_D | Single digit designator for Public Land Survey System range in which well is located | ||||||||||||||||||||||||||||||
| BMeridian | Principle meridians required for all California surveys; defines Public Land Survey System base (Base Meridian); SB=San Bernardino | ||||||||||||||||||||||||||||||
| Latitude | y-coordinate in decimal degrees | ||||||||||||||||||||||||||||||
| Longitude | x-coordinate in decimal degrees | ||||||||||||||||||||||||||||||
| Elevation | Surface elevation of the well (feet) | ||||||||||||||||||||||||||||||
| TotalDepth | Total measured depth of well bore (feet) | ||||||||||||||||||||||||||||||
| RedrillFt | Total vertical depth of re-drill (feet) (Re-drill Footage) | ||||||||||||||||||||||||||||||
| RedCanFlag | Represents the number of re-drills for a well (Re-drill Cancel Flag) | ||||||||||||||||||||||||||||||
| Location | Optional verbal description of well location | ||||||||||||||||||||||||||||||
| Comments | Optional comments about the well | ||||||||||||||||||||||||||||||
| GISSource | 3-digit code describing the method by which the well location was established (Ranked from most accurate to least accurate)
|
||||||||||||||||||||||||||||||
| DryHole | Y/N flag indicating if a well produced commercial quantities of hydrocarbons | ||||||||||||||||||||||||||||||
| ConfWell | Confidential Well; Y/N flag indicating if subsurface information for well is held confidential for a period of two years pursuant to Public Resources Code 3234 | ||||||||||||||||||||||||||||||
| DirDrill | Directional Drilling; Indicator of whether well was directionally drilled (NULL for confidential wells) | ||||||||||||||||||||||||||||||
| HydFrac | Hydraulic Fracturing; BLANK | ||||||||||||||||||||||||||||||
| Y/N flag indicating whether a well received hydraulic stimulation treatment (hydraulic fractured) | |||||||||||||||||||||||||||||||
| BLMWell | Y/N flag indicating whether the Bureau of Land Management (BLM) exercises jurisdiction of well | ||||||||||||||||||||||||||||||
| EPAWell | Y/N flag indicating whether the Environmental Protection Agency (EPA) exercises jurisdiction of well | ||||||||||||||||||||||||||||||
| SpudDate | Date on which well drilling commenced | ||||||||||||||||||||||||||||||
| CompDate | Completion Date; Date on which wellhead oil & gas production equipment was installed | ||||||||||||||||||||||||||||||
| AbdDate | Abandoned Date; Date on which well was plugged & abandoned to Division standards | ||||||||||||||||||||||||||||||
| VistaDate | Date of most recent update by the NASA JPL Vista Team | ||||||||||||||||||||||||||||||
Table 12: VistaLA_Petroleum_Refineries.zip
| Field | Description |
| FID | Feature identification number |
| Shape | Vector format identification |
| COUNTYNAME | County where the petroleum refinery resides |
| Shape_Leng | Perimeter length of the petroleum refinery (miles) |
| Shape_Area | Area of the petroleum refinery (square miles) |
| Company | Name of the company operating the petroleum refinery |
| Corp | Corporation; Name of the corporation in charge of the petroleum refinery |
| Site | City of the petroleum refinery |
| ZIP | Zip code of the petroleum refinery |
| State | State of the petroleum refinery |
| PADD | Petroleum Administration for Defense Districts; geographic aggregations of the 50 States and the District of Columbia into five districts |
| AD_Mbpd | Atmospheric Distillation; volume of crude oil processed by the atmospheric distillation chamber (thousands of barrels per day; Mb/d) |
| VDist_Mbpd | Vacuum Distillation; volume of crude oil processed by the vacuum distillation chamber (thousands of barrels per day; Mb/d) |
| CaDis_Mbpd | Catalytic Disintegration; volume of crude oil processed by the catalytic disintegration chamber (thousands of barrels per day; Mb/d) |
| VRedu_Mbpd | Viscosity Reduction; volume of crude oil processed by the viscosity reduction chamber (thousands of barrels per day; Mb/d) |
| CaRef_Mbpd | Catalytic Reformation; volume of crude oil processed by the catalytic reformation chamber (thousands of barrels per day; Mb/d) |
| Isal_Mbpd | Alkylation and Isomerization; volume of crude oil processed by the alkylation and isomerization chambers (thousands of barrels per day; Mb/d) |
| HDS_Mbpd | Hydroesulphurization; volume of crude oil processed by the hydroesulphurization chamber (thousands of barrels per day; Mb/d) |
| Cokin_Mbpd | Coking; volume of crude oil processed by the coking chamber (thousands of barrels per day; Mb/d) |
| Asph_Mbpd | Asphalt Production; maximum production of asphalt products (thousands of barrels per day; Mb/d) |
| Source | Source Agency; source of the data |
| Period | Date of last update |
| Latitude | y-coordinate in decimal degrees |
| Longitude | x-coordinate in decimal degrees |
| Notes | Vista validation notes |
| Ver_Google | Y/N Flag to indicate verification with Google Earth aerial imagery |
| VistaDate | Date of most recent update by the NASA JPL Vista Team |
Table 13: VistaLA_Power_Plants.zip
| Field | Description | ||||||||||||||||
| FID | Feature identification number | ||||||||||||||||
| Shape | Vector format identification | ||||||||||||||||
| Plant_Code | Office of Regulatory Information Systems (ORIS) in the Department of Energy (DOE) Code, unique identification number for each plant | ||||||||||||||||
| Plant_Name | Name of the power plant | ||||||||||||||||
| Utility_Na | Utility Name; Name of the utility company that owns/operates the power plant | ||||||||||||||||
| Utility_ID | Identification number of the utility company that owns/operates the power plant | ||||||||||||||||
| Sector_nam | Sector Name; Type of entity that owns the powerplant facilities to generate electric power for sale to utilities and end users
|
||||||||||||||||
| City | City in which the power plant resides | ||||||||||||||||
| County | County in which the power plant resides | ||||||||||||||||
| StateName | State in which the power plant resides | ||||||||||||||||
| Zip | Zip code in which the power plant resides | ||||||||||||||||
| Street_Add | Street address of the power plant | ||||||||||||||||
| PrimSource | Primary Source; Primary energy source of the power plant
|
||||||||||||||||
| Total_MW | Total capacity; the total design capacity of the power plant (megawatts/hour; MW/hr) | ||||||||||||||||
| Coal_MW | Design capacity of the power plant for energy derived from coal (megawatts/hour; MW/hr) | ||||||||||||||||
| NG_MW | Design capacity of the power plant for energy derived from natural gas (megawatts/hour; MW/hr) | ||||||||||||||||
| Crude_MW | Design capacity of the power plant for energy derived from crude oil and petroleum products (megawatts/hour; MW/hr) | ||||||||||||||||
| Bio_MW | Design capacity of the power plant for energy derived from biomass (megawatts/hour; MW/hr) | ||||||||||||||||
| Hydro_MW | Hydroelectricity; Design capacity of the power plant for energy derived from hydroelectricity (megawatts/hour; MW/hr) | ||||||||||||||||
| HydroPS_MW | Hydroelectricity Pumped Storage; Design capacity of the power plant for energy derived from pumped storage (megawatts/hour; MW/hr) | ||||||||||||||||
| Nuclear_MW | Nuclear Power; Design capacity of the power plant for energy derived from nuclear (megawatts/hour; MW/hr) | ||||||||||||||||
| Solar_MW | Solar Power; Design capacity of the power plant for energy derived from solar (megawatts/hour; MW/hr) | ||||||||||||||||
| Wind_MW | Wind Power; Design capacity of the power plant for energy derived from wind (megawatts/hour; MW/hr) | ||||||||||||||||
| Geo_MW | Geothermal; Design capacity of the power plant for energy derived from geothermal (megawatts/hour; MW/hr) | ||||||||||||||||
| Other_MW | Design capacity of the power plant for energy derived from other sources (megawatts/hour; MW/hr) | ||||||||||||||||
| Tech_desc | Description of the technology/methodology used to generate power | ||||||||||||||||
| Source | The designated Energy Information Administration (EIA) data collection forms where the power plant data was obtained from | ||||||||||||||||
| Period | Period the data was collected for (YYYYMM) | ||||||||||||||||
| Latitude | y-coordinate in decimal degrees | ||||||||||||||||
| Longitude | x-coordinate in decimal degrees | ||||||||||||||||
| Ver_Google | Y/N Flag to indicate verification with Google Earth aerial imagery | ||||||||||||||||
| Ver_SCAG_0 | Y/N Flag to indicate verification with SCAG 2005 land use data | ||||||||||||||||
| Ver_SCAG_1 | Y/N Flag to indicate verification with SCAG 2012 land use data | ||||||||||||||||
| Notes | Vista validation notes | ||||||||||||||||
| Shape_Area | Area of the polygon (square miles) | ||||||||||||||||
| VistaDate | Date of most recent update by the NASA JPL Vista Team | ||||||||||||||||
Table 14: VistaLA_Wastewater_Treatment_Plants.zip
| Field | Description |
| FID | Feature identification number |
| Shape | Vector format identification |
| Shape_Area | Area of the polygon (square miles) |
| Plant | Name of the wastewater treatment plant |
| Location | Address of the wastewater treatment plant |
| City | City of the wastewater treatment plant |
| County | County of the wastewater treatment plant |
| State | State of the wastewater treatment plant |
| ZIP | Zip code of the wastewater treatment plant |
| Latitude | y-coordinate in decimal degrees |
| Longitude | x-coordinate in decimal degrees |
| DesignFlow | Amount of intake of wastewater in the treatment plant (million gallons/day) |
| Notes | Vista validation notes |
| Ver_Google | Y/N Flag to indicate verification with Google Earth aerial imagery |
| VistaDate | Date of most recent update by the NASA JPL Vista Team |
Application and Derivation
The Vista-LA data product is a key tool for CH4 emissions research and mitigation efforts; by (1) mapping areas of CH4 emitting infrastructure, (2) identifying targets for CH4 surveys, and (3) enabling interpretation of atmospheric observations, including source attribution, and comparison of measured emissions to permitted or reported emissions. Combined with atmospheric observations, Vista enables systematic study of urban CH4 emission sources.
Quality Assessment
Vista-LA data have been significantly geoprocessed, edited, digitized, and standardized on the ArcGIS 10.4 platform. Point source locations and spatial extents of infrastructure known or expected to emit methane were extensively validated by comparing multiple data sets which had varying degrees of spatial accuracy. The uncertainty in the final data has been reduced relative to the original data through comparisons of the existing publicly available data and more recent aerial imagery. Where applicable, the point source locations or spatial extents were modified using the best available information, which significantly reduced the uncertainty in the locations of individual facilities and/or infrastructure.
Data Acquisition, Materials, and Methods
The Vista-LA database extends over SoCAB, the air-shed for the greater Los Angeles urban extent, including the urbanized parts of Los Angeles, Orange, Riverside, and San Bernardino Counties. It follows the IPCC CH4 emissions reporting framework (IPCC, 2006) and is compatible with the State of California CH4 emissions reporting. The database comprises of infrastructures associated with emissions from primarily three sources: energy; agriculture, forestry and other land use; and waste. Spatial data on these infrastructures were compiled from reliable and verified public databases on government and federal/state research agency portals. For more information refer to Carranza et al 2017.
Data Access
These data are available through the Oak Ridge National Laboratory (ORNL) Distributed Active Archive Center (DAAC).
Sources of Methane Emissions (Vista-LA), South Coast Air Basin, California, USA
Contact for Data Center Access Information:
- E-mail: uso@daac.ornl.gov
- Telephone: +1 (865) 241-3952
References
California Department of Conservation Division of Oil Gas and Geothermal Resources (DOGGR 2016). GIS Mapping http://www.conservation.ca.gov/dog/maps/Pages/GISMapping2.aspx.
California Department of Resources Recycling and Recovery (CalRecycle 2015). SWIS Facility/Site Search http://www.calrecycle.ca.gov/SWFacilities/Directory/Search.aspx.
Carranza, V., T. Rafiq, I. Frausto-Vicencio, F. Hopkins, K.R. Verhulst, P. Rao, R.M. Duren, and C.E. Miller. 2017. Vista-LA: Mapping methane emitting infrastructure in the Los Angeles megacity. Submitted to Earth Syst. Sci. Data.
CARB. GHG Inventory Technical Documentation; 2014.
CARB. California Greenhouse Gas Inventory for 2000-2013 — by Sector and Activity Electricity Generation (In State) California Greenhouse Gas Inventory for 2000-2013 — by Sector and Activity; 2015.
Hunsaker, L. Larry Hunsaker of California Air Resources Board, Emission Inventory Branch, personal communication with Valerie Carranza; 2016.
IPCC: 2006 IPCC Guidelines for National Greenhouse Gas Inventories, Ch. 4, Table 4.1., 2006.
Kashak, E. Edward Kashak from California Regional Water Quality Board, Santa Ana Region personal communication with Francesca Hopkins. 2016.
Los Angeles County GIS Data Portal. Methane Producing Landfills http://egis3.lacounty.gov/dataportal/2014/01/06/methane-producing-landfills-2/.
Pipeline and Hazardous Materials Safety Administration; U.S. Department of Transportation. National Pipeline Mapping System https://www.npms.phmsa.dot.gov/.
Rose, T. Terry Rose of California Energy Commission, GIS Unit, personal communication with Francesca Hopkins; 2016.
Southern California Association of Governments (SCAG). GIS and Data Services http://gisdata.scag.ca.gov/Pages/GIS-Library.aspx.
State Water Resources Control Board. Regulated Facility Report https://ciwqs.waterboards.ca.gov/ciwqs/readOnly/CiwqsReportServlet?inCommand=reset&reportNa me=RegulatedFacility.
State Water Resources Control Board. Searching for NPDES Wastewater Facilities http://www.swrcb.ca.gov/water_issues/programs/npdes/docs/wwtf_search.pdf.
U.S. Department of Energy. Alternative Fuels Data Center, 2017. http://www.afdc.energy.gov/fuels/data_methods_stations.html.
U.S. Energy Information Administration (EIA). Maps: Layer Information for Interactive State Maps https://www.eia.gov/maps/layer_info-m.cfm.
U.S. Environmental Protection Agency. EPA Facility Level Information on Greenhouse Gases Tool (FLIGHT). 2017. https://ghgdata.epa.gov/ghgp/main.do#.
U.S. Environmental Protection Agency. EPA Facility Registry Service (FRS): Wastewater Treatment Plants https://catalog.data.gov/dataset/epa-facility-registry-service-frs-wastewater-treatment-plants.
U.S. Environmental Protection Agency. ICIS-NPDES Download Summary and Data Element Dictionary https://echo.epa.gov/tools/data-downloads/icis-npdes-download-summary.