Documentation Revision Date: 2019-12-17
Dataset Version: 1
Summary
This data set includes 15 compressed shapefiles (provided in *.zip format). The shapefile data are also provided in .kmz format in the Companion Files section.
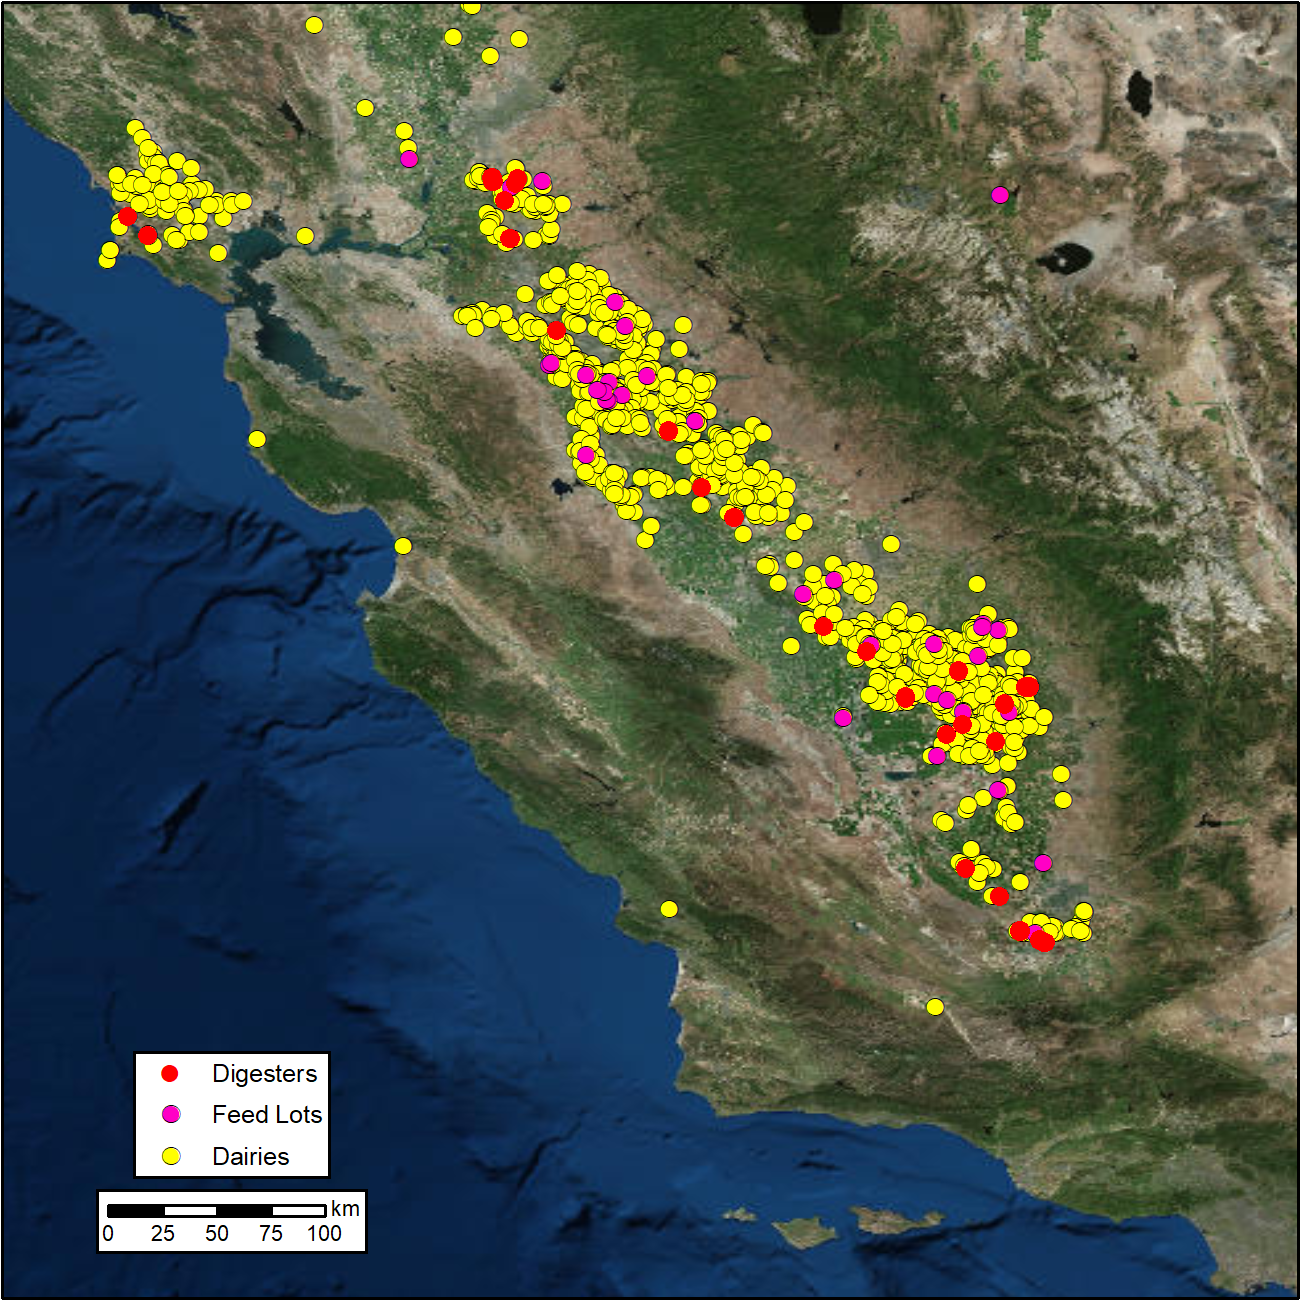
Figure 1. Vista-CA provides locations of methane (CH4) emitting facilities and infrastructure in the State of California. In this figure, the distribution of digesters, feed lots, and dairies across the San Francisco Bay Area and Central Valley are shown.
Citation
Hopkins, F.M., T. Rafiq, and R.M. Duren. 2019. Sources of Methane Emissions (Vista-CA), State of California, USA. ORNL DAAC, Oak Ridge, Tennessee, USA. https://doi.org/10.3334/ORNLDAAC/1726
Table of Contents
- Dataset Overview
- Data Characteristics
- Application and Derivation
- Quality Assessment
- Data Acquisition, Materials, and Methods
- Data Access
- References
Dataset Overview
This data set provides spatial data products with identified and organized locations of potential methane (CH4) emitting facilities and infrastructure spanning the State of California. These data products form a GIS-based mapping database designed to address shortcomings in current CH4 source inventories and is known as Vista California (Vista-CA). Vista-CA consists of detailed spatial maps for facilities and infrastructure in California that are known or expected sources of CH4 emissions and illustrates the spatial distribution of potential CH4 sources. Vista-CA spatial data sets were created utilizing an assortment of publicly available data sources from local, state, and federal agencies for the years 2005 to 2019. The final Vista-CA database contains over 230,000 entries, which are presented as fifteen CH4 emitting infrastructure maps. The database was used to support flight planning and source attribution for the California Methane Survey project.
Project: Carbon Monitoring System (CMS)
The NASA Carbon Monitoring System (CMS) is designed to make significant contributions in characterizing, quantifying, understanding, and predicting the evolution of global carbon sources and sinks through improved monitoring of carbon stocks and fluxes. The System will use the full range of NASA satellite observations and modeling/analysis capabilities to establish the accuracy, quantitative uncertainties, and utility of products for supporting national and international policy, regulatory, and management activities. CMS will maintain a global emphasis while providing finer scale regional information, utilizing space-based and surface-based data and will rapidly initiate generation and distribution of products both for user evaluation and to inform near-term policy development and planning.
Related Publication:
Duren, R. M., Thorpe, A. K., Foster, K.T., Rafiq, T. , Hopkins, F. M. Yadav, V., Bue, B. D., Thompson, D. R., Conley, S., Colombi, N.K., Frankenberg, C., McCubbin, I. B., Eastwood, M. L., Falk, M., Herner, J. D., Croes, B. E., Green, R. O., Miller, C. E. 2019. California’s Methane Super-Emitters. Nature 575, 180–184 https://doi.org/10.1038/s41586-019-1720-3
Related Datasets:
Thorpe, A.K., B.D. Bue, D.R. Thompson, and R.M. Duren. 2019. Methane Plumes Derived from AVIRIS-NG over Point Sources across California, 2016-2017. ORNL DAAC, Oak Ridge, Tennessee, USA. https://doi.org/10.3334/ORNLDAAC/1727
The following dataset, Vista-LA, was a predecessor to Vista-CA. The new Vista-CA product covers the entire state and so includes the LA area, but the Vista-CA data does not necessarily supersede Vista-LA.
Carranza, V., T. Rafiq, I. Frausto-Vicencio, F. Hopkins, K.R. Verhulst, P. Rao, R.M. Duren, and C.E. Miller. 2018. Sources of Methane Emissions (Vista-LA), South Coast Air Basin, California, USA. ORNL DAAC, Oak Ridge, Tennessee, USA. https://doi.org/10.3334/ORNLDAAC/1525
Acknowledgements:
This work was supported in part by NASA’s Carbon Monitoring System (CMS) Prototype Methane Monitoring System for California and the Advancing Collaborative Connections for Earth System Science (ACCESS) Methane Source Finder project.
Data Characteristics
Spatial Coverage: California, USA
Spatial Resolution: points and polygons
Temporal Coverage: 2005-01-01 to 2019-08-20
Temporal Resolution: One time
Study Area (All latitude and longitude given in decimal degrees)
| Site (Region) | Westernmost Longitude | Easternmost Longitude | Northernmost Latitude | Southernmost Latitude |
|---|---|---|---|---|
| California | -124.36367 | -114.49253 | 41.92629 | 32.537812 |
Data File Information:
This data set includes 15 compressed shapefiles (provided in *.zip format). The shapefile data are also provided in .kmz format in the Companion Files section.
Table 1. Vista-CA data files of CH4 sources organized by Intergovernmental Panel on Climate Change (IPCC) greenhouse gas emission reporting taxonomy. Number of features, attributes, and data type are provided for each file. Attributes are defined below.
| Vista-CA Layers (IPCC Level 3) | File Name | No. of Features | Attributes | Shapefile Data Type |
|---|---|---|---|---|
| Power Plants | Vista_CA_Power_Plants.zip | 433 | 12 | polygons |
| Refineries | Vista_CA_Refineries.zip | 26 | 12 | polygons |
| Distribution Pipelinesa | *** No data provided | 569,609 | polylines | |
| Natural Gas Fueling Stationsb | Vista_CA_NG_Fueling_Stations.zip | 208 | 12 | polygons |
| Natural Gas Stations | Vista_CA_NG_Stations.zip | 1,120 | 12 | points |
| Oil and Gas Facilities | Vista_CA_Oil_and_Gas_Facilities.zip | 3,356 | 11 | polygons |
| Oil and Gas Field Boundaries | Vista_CA_Oil_and_Gas_Field_Boundaries.zip | 516 | 9 | polygons |
| Oil and Gas Wells | Vista_CA_Oil_and_Gas_Wells.zip | 225,766 | 12 | points |
| Pipelinesa | *** No data provided | 96,823 | polylines | |
| Processing Plants | VistaCA_Processing_Plants.zip | 26 | 12 | polygons |
| Storage Fields | Vista_CA_Storage_Fields.zip | 12 | 12 | polygons |
| Feed Lots *** | Vista_CA_Feed_Lots.zip | 72 | 12 | points |
| Digesters | Vista_CA_Digesters.zip | 33 | 12 | polygons |
| Dairies *** | Vista_CA_Dairies.zip | 1,715 | 12 | points |
| Landfills | Vista_CA_Landfills.zip | 714 | 12 | polygons |
| Composting Sites | Vista_CA_Composting_Sites.zip | 430 | 12 | polygons |
| Wastewater Treatment Plants | Vista_CA_Wastewater_Treatment_Plants.zip | 149 | 12 | polygons |
***Information and delivery of distribution pipelines, pipelines and addresses/names for feed lots and dairies are only accessible through correspondence and approval with the authors. Also see feed lot note in Section 5.
a - Source accessible only through correspondence and approval with publishers/authors
b - Source not currently included in the California Air Resources Board’s 2010-2017 GHG Inventory
Spatial Properties: The spatial domain for all these datasets have been geoprocessed to fit within the geographic extent of California. Vista-CA spatial data is georeferenced to the WGS 1984 Geographic Coordinate System and Datum with geographic coordinates set to decimal degrees (EPSG: 4326).
Table 2. Attributes in the shapefiles. Both polygon and point shapefiles have the following 12 attributes in common. Please note the exceptions. Exceptions: Oil and Gas Facilities has no 'City' attribute and Oil and Gas Field Boundaries has no 'Latitude', 'Longitude', or 'City' attributes.
| Field | Description | Type |
|---|---|---|
| FID | Feature identification number | Object ID |
| Shape | Shapefile format | Text |
| Latitude | y-coordinate in decimal degrees | Double |
| Longitude | x-coordinate in decimal degrees | Double |
| City | City where the Vista feature exists | Text |
| State | State where the Vista feature exists | Text |
| Source | Source of original data | Text |
| Vista_ID | Unique alphanumeric Vista feature identifier | Text |
| VistaIPCC | IPCC sector designation of the Vista feature | Text |
| VistaName | Name of the Vista feature | Text |
| VistaSType | Type of methane source | Text |
| VistaDate | Date of most recent update | Date |
Companion Files
The shapefile data are also provided in .kmz format. Vista_CA_Data_Documentation.pdf provides specific information and definitions for every data field found in each Vista-CA spatial layer
Application and Derivation
The Vista-CA data product is a key tool for CH4 emissions research and mitigation efforts; by (1) mapping areas of CH4 emitting infrastructure, (2) identifying targets for CH4 surveys, and (3) enabling interpretation of atmospheric observations, including source attribution, and comparison of measured emissions to permitted or reported emissions. Combined with atmospheric observations, Vista enables systematic study of CH4 emission sources. See Duren et al. (2019) for more analysis information.
Quality Assessment
Vista-CA datasets have been significantly geoprocessed, edited, digitized, and standardized on the ArcGIS 10.6 platform.
Point source locations and spatial extents of infrastructure known or expected to emit methane were extensively validated by comparing multiple data sets which had varying degrees of spatial accuracy. The uncertainty in the final data has been reduced relative to the original data through comparisons of the existing publicly available data and more recent aerial imagery. Where applicable, the point source locations or spatial extents were modified using the best available information, which significantly reduced the uncertainty in the locations of individual facilities and/or infrastructure. See Duren et al. (2019) for details.
Data Acquisition, Materials, and Methods
Vista-CA spatial datasets identify and classify potential methane source emitters in California. Vista-CA spatial datasets were created utilizing an assortment of publicly available data sources ranging from local, state, and federal agencies. See Duren et al. (2019) for more details. Tables 3 and 4 identify the data sources for each product and the source references, respectively.
Vista-CA spatial datasets are organized using the IPCC categorization for Greenhouse Gas emissions. IPCC categories utilize a level system, levels 1 to 3, with level 1 relating to general categories (“CH4 Sectors”) and level 3 relating to specific emission sources (“CH4 Sources”) identified in this dataset. The database was used to support flight planning and source attribution for the California Methane Survey project (see related dataset Thorpe et al, 2019).
This Vista-CA dataset features 15 spatial layers totaling to over 230,000 individual features comprised of geolocated and validated points and polygons. This dataset contains 4 point layers and 11 polygon layers. Vista-CA datasets have been significantly geoprocessed, edited, digitized, and standardized on the ArcGIS 10.6 platform. The standard data formats developed for the released version of the Vista-CA datasets are shapefiles (.shp; Esri vector data storage format). The spatial domain for all these datasets have been geoprocessed to fit within the geographic extent of California. Vista-CA spatial data is georeferenced to the WGS 1984 Geographic Coordinate System and Datum with geographic coordinates set to decimal degrees.
Note that information and delivery of distribution pipelines, pipelines and addresses/names for feed lots and dairies are only accessible through correspondence and approval with the authors. No pipeline data are provided.
Also note that feed lot locations were determined from a subset of water quality permit data referring to livestock operations with the words “stockyard”, “cattle ranch”, “livestock market”, “livestock ranch”, “feedyard”, “beef”, or “cattle” in the facility name. The feed lot dataset did not receive the same level of vetting as the dairy dataset, and is likely not complete.
Table 3. Vista-CA data files of CH4 sources organized by IPCC greenhouse gas emission reporting taxonomy. The source and year of the raw input datasets are provided for each file. See references below.
| Vista-CA Layers (IPCC Level 3) | File Name | Data Sources |
|---|---|---|
| Power Plants | Vista_CA_Power_Plants.zip | Southern California Association of Governments (SCAG) (2005 and 2012) and U.S. Energy Information Administration (EIA) (2015) |
| Refineries | Vista_CA_Refineries.zip | Southern California Association of Governments (SCAG) (2005 and 2012) and U.S. Energy Information Administration (EIA) (2015) |
| Distribution Pipelinesa | *** | No sources provided. |
| Natural Gas Fueling Stationsb | Vista_CA_NG_Fueling_Stations.zip | U.S. Department of Energy Alternative Fuels Data Center (DOE AFDC) (2017) |
| Natural Gas Stations | Vista_CA_NG_Stations.zip | California Energy Commission (2017) and U.S. Environmental Protection Agency Facility Level Green House Gas Tool (2017) |
| Oil and Gas Facilities | Vista_CA_Oil_and_Gas_Facilities.zip | California Energy Commission (CEC) (2018) |
| Oil and Gas Field Boundaries | Vista_CA_Oil_and_Gas_Field_Boundaries.zip | California Energy Commission (CEC) (2018) |
| Oil and Gas Wells | Vista_CA_Oil_and_Gas_Wells.zip | California Department of Conservation Division of Oil, Gas, and Geothermal Resources (DOGGR) (2017) |
| Pipelinesa | *** | No sources provided. |
| Processing Plants | VistaCA_Processing_Plants.zip | U.S. Energy Information Administration (EIA) (2014) |
| Storage Fields | Vista_CA_Storage_Fields.zip | California Department of Conservation Division of Oil, Gas, and Geothermal Resources (DOGGR) (2016), U.S. Energy Information Administration (EIA) (2016) |
| Feed Lots *** | Vista_CA_Feed_Lots.zip | California Regional Water Quality Control Board (RWQCB) Rancho Cordova, Fresno, and Santa Ana Region (RQWCB) (2017), State Water Resource Control Board Regulated Facility Report (California Integrated Water Quality System Project) (2018) |
| Digesters | Vista_CA_Digesters.zip | California Air Resources Board (CARB) (2013) |
| Dairies *** | Vista_CA_Dairies.zip | California Regional Water Quality Control Board (RWQCB) Rancho Cordova, Fresno, and Santa Ana Region (2017), State Water Resource Control Board Regulated Facility Report (California Integrated Water Quality System Project) (2018) |
| Landfills | Vista_CA_Landfills.zip | California Air Resources Board (CARB) (2014), California's Department of Resources Recycling and Recovery’s Solid Waste Information System (CalRecycle) (2015), Southern California Association of Governments (SCAG) (2005 and 2012) |
| Composting Sites | Vista_CA_Composting_Sites.zip | California's Department of Resources Recycling and Recovery’s Solid Waste Information System (CalRecycle) (2015) |
| Wastewater Treatment Plants | Vista_CA_Wastewater_Treatment_Plants.zip | California Air Resources Board (CARB) (2016), Southern California Association of Governments (SCAG) (2005 and 2012) |
***Information and delivery of distribution pipelines, pipelines and addresses/names for feed lots and dairies are only accessible through correspondence and approval with the authors. Also see feed lot note above.
a- Source accessible only through correspondence and approval with publishers/authors
b- Source not currently included in the California Air Resources Board’s 2010-2017 GHG Inventory
Table 4. References for Vista-CA Layers data sources
|
California Department of Conservation, Division of Oil Gas and Geothermal Resources. GIS Mapping http://www.conservation.ca.gov/dog/maps/Pages/GISMapping2.aspx |
|
California Department of Resources Recycling and Recovery (CalRecycle). SWIS Facility/Site Search http://www.calrecycle.ca.gov/SWFacilities/Directory/Search.aspx |
|
California Energy Commission, GIS Open Data. https://cecgis-caenergy.opendata.arcgis.com/ |
| CARB. California Greenhouse Gas Inventory for 2000-2013 — by Sector and Activity Electricity Generation (In State) California Greenhouse Gas Inventory for 2000-2013 — by Sector and Activity; 2015. |
| California Air Resources Board 2013 https://ww3.arb.ca.gov/ag/manuremgmt/operating-manure-digester-site-list-1st-quarter-2013.pdf |
|
California Regional Water Quality Board, Santa Ana Region. National Pollutant Discharge Elimination System (NPDES). https://www.waterboards.ca.gov/water_issues/programs/npdes/cafo.html |
|
Southern California Association of Governments. GIS and Data Services http://gisdata.scag.ca.gov/Pages/Home.aspx |
|
State Water Resources Control Board. Regulated Facility Report (California Integrated Water Quality System Project) https://ciwqs.waterboards.ca.gov/ciwqs/readOnly/CiwqsReportServlet?inCommand=reset&reportName=RegulatedFacility |
|
State Water Resources Control Board. Searching for NPDES Wastewater Facilities https://www.waterboards.ca.gov/water_issues/programs/npdes/ |
|
U.S. Department of Energy. Alternative Fuels Data Center http://www.afdc.energy.gov/ |
|
U.S. Energy Information Administration. Maps: Layer Information for Interactive State Maps |
|
U.S. Environmental Protection Agency. EPA Facility Level Information on Greenhouse Gases Tool (FLIGHT). 2017. https://ghgdata.epa.gov/ghgp/main.do# |
Data Access
These data are available through the Oak Ridge National Laboratory (ORNL) Distributed Active Archive Center (DAAC).
Sources of Methane Emissions (Vista-CA), State of California, USA
Contact for Data Center Access Information:
- E-mail: uso@daac.ornl.gov
- Telephone: +1 (865) 241-3952
References
Duren, R. M., Thorpe, A. K., Foster, K.T., Rafiq, T. , Hopkins, F. M. Yadav, V., Bue, B. D., Thompson, D. R., Conley, S., Colombi, N.K., Frankenberg, C., McCubbin, I. B., Eastwood, M. L., Falk, M., Herner, J. D., Croes, B. E., Green, R. O., Miller, C. E. 2019. California’s Methane Super-Emitters. Nature 575, 180–184 https://doi.org/10.1038/s41586-019-1720-3